A Work Project, presented as part of the requirements for the Award of a Masters Degree in Management from Nova School of Business and Economics
Young adults’ Preferences and Satisfaction
levels in Duty-free shopping in airports
A Project carried out on the L’Oréal Brandstorm Field Lab, with the supervision of Professor Luísa Agante
June 2015
Booklet 1 of 2
Rita Pereira dos Santos Santana Godinho
#1907
2
Abstract
This study aims to explore and understand what young adults’ duty free shoppers (18-26
years old) want and are getting from travel retail shopping on airport environments and
to evaluate their satisfaction levels with the service. It has important managerial
contributions since it is an important target in a fast growing market. An online survey
was conducted with 188 young adults and its results show that young adults’ are
somewhat satisfied with the overall service on duty free stores mainly in what concerns
quality of the products and physical evidence of the stores. Results also show that the
majority of buyers within this segment are price driven and strongly influenced by
promotions associated with price reductions, and do not seem very satisfied with respect
to that.
3
Acknowledgements
I would like to thank Professor Luisa Agante for guiding me throughout this process, for
being always available to answer my doubts and for helping me acquiring a better
knowledge of all the topics developed in this thesis. Being part of the L’Oréal Brandstorm Field lab was an experience that certainly marked my life and I also need to
thank Professor Luisa for giving me that amazing opportunity. It was worth every single
moment.
A special thank you to João for all his invaluable support, encouragement and
motivation. To my best friend Catarina, who accompanied me during this Master
Degree, for always pushing me forward and telling me the right words right when I
needed to hear them. To my dearest and smartest friend Carocha, a big big thank you for
all her support, patience, kindness and priceless advice.
To my loving and irreplaceable family goes my biggest thank you. I thank my parents
for being my enormous inspiration and for making all of this possible. I am fortunate to
say that I have the best parents in the world who always encouraged me to dream big.
To my sisters, Marta and Teresa, who know me better than anyone in the world, for
always being the first ones helping me when I really need. Lastly, I thank my special
aunt Isabelinha and my truly friend Milá for all the caring and encouragement.
I would also like to say “thank you” to my precious friends, Cris, Chloé, Pipa and Nocas, who helped me not only to stay concentrated when I was writing this thesis, but
also to relax during the stressful moments.
Last but not least, a special thank you to my dream team, Carol and Greta, for making
this competition an unforgettable six month experience and for teaching me the
importance of a team spirit. I am lucky enough to say that besides all the knowledge that
4
Table of Contents
1. Introduction 5
2. Literature Review 5
2.1 Duty Free Shopping 5
2.2 Shopping motivations in an airport environment 6
2.3 Tourist Shopping Satisfaction 7
2.4 Research Objective and Research Question 8
3. Methodology 8
3.1. Sample 8
3.2. Research Design 9
4. Findings and Results 9
4.1. Sample characterization (exhibit 2) 9
4.2. What do young adults value? What do they prefer? 11
4.2.1. Reasons to enter a duty free store 11
4.2.2. Which products do young adults buy? 13
4.2.3. What do young adults value? 14
4.2.4. What do young adults want? 15
4.3. How satisfied are young adults? 18
5. Conclusions and Recommendations 20
6. Limitations and Further Research 22
5
1. Introduction
Shopping is nowadays perceived as an important leisure activity. As malls and shopping
centres keep on adding services, comforts and providing customers with access to
different facilities, shopping has undoubtedly become much more focused on leisure
and the difference between both is becoming blurred (Timothy and Butler, 1995).
As an important leisure activity shopping plays an important role in tourism, being
considered a central tourist activity in several destinations. As a matter of fact, some
researchers have concluded that for numerous travellers a trip is not over before having
spent some time shopping (Geuens, Vantomme and Brengman, 2003).
Due to this relation between tourism and shopping, the transportation of passengers is
no longer accepted as the exclusively role of an airport. Actually, airport legislators
have in mind that airports might be a key destination and can work as a leisure
attraction. As a result, airport shopping can be recognized as a particular form of
in-store shopping, where different products are sold and different experiences are available
to the shopper, triggering different motivations (Geuens, Vantomme and Brengman,
2003). Having this in mind, both brand and retail operators can benefit from learning
travellers’ behaviour and by understanding the needs of the shopper. Therefore, the goal of this research is to study the consumer behaviour of young adults in duty free stores in
order to evaluate their preferences and level of satisfactions towards this market and,
ultimately, to give recommendations on how to best satisfy the needs of this segment.
2. Literature Review
2.1 Duty Free Shopping
Duty-free retail is defined as the sale of all products by businesses to consumers that
6
delimited travel zones. It does not comprise sales prior to security or sales from
consumer foodservice outlets (Euromonitor International, 2012).
A “duty” refers to a tax or fee charged on goods by government entities (Dutyfree.com, 2015). As so, “Duty Free” means that no excise duty needs to be paid to the
Government on the appropriate items purchased. This is only valid for products like
cigarettes, tobacco and selected spirits, all other items are classified as tax free items
(World Duty Free, 2015). The amount of duty free savings depends on the products a
person buys and on the country a person is.
2.2 Shopping motivations in an airport environment
By identifying the different motivations for shopping, retailers might easily recognize
the reasons why passengers shop and, contrariwise, why they do not (Stasiulevicuis,
2012).
When compared with daily shopping routines and environments, an airport environment
might induce many different motivations over different stimuli and situations, being
these motivations functional, experiential, airport-infrastructure-related motivation and
airport-atmosphere-related motivation (Geuens, Vantomme and Brengman, 2003).
Firstly, an airport can prompt numerous functional motivations such as a good price,
convenience, product range and quality shopping. In fact, the vast majority of products
at airports are still low-priced when compared with regular shops. Hence, airport
shoppers might be price driven (Geuens, Vantomme and Brengman, 2003).
Additionally, convenience might also be an important motivator since the existence of
shops at airports enables the travellers to buy food or products needed for their trips at
any moment, and thus satisfy their immediate needs.
Furthermore, experiential motivations such as promotions and purchasing to indulge
7
studies, the atmosphere and surrounding can have a direct effect on consumer spending,
often being more responsible for the purchase decision than the product itself (Turley
and Milliman, 2000) which reveals the importance of experiential motivations.
Airport shopping might also prompt travel-related motivations. Many authors believe
that the shopping and buying behaviours of a tourist frequently differs significantly
from his/her pattern at home (Timothy and Butler, 1995). For instance, travellers who
have to wait for their flights might shop because they are bored and try to search for
entertainment in shopping. Additionally, the tradition of purchasing souvenirs and gifts
as well as the offer of exclusive packaging from travel retail and convenient travel sets
also encourages travellers to shop (Geuens, Vantomme and Brengman, 2003).
Finally, airport-infrastructure-related motivation such as the excellent staff skills and
service provided at airport is also recognized as an important motivator (Geuens,
Vantomme and Brengman, 2003).
2.3 . Tourist Shopping Satisfaction
There are three important components when assessing tourist shopping satisfaction:
product, service quality and shopping environment (Lin and Chen, 2013).
Attributes like price, quality, variety of goods offered, packaging, and exclusivity can
help measuring shopping satisfaction. Moreover, in-store environment and atmosphere,
product variety and store planning and design, have also an impact into shoppers’
feelings, insights, behaviours and satisfaction (Lin and Chen, 2013).
As a final point, according to some authors, culture strongly influences the perceptions
of the service received. In fact, according to Lee and Kacen (2008), there are important
fundamental differences between consumers in Western individualist and Eastern
collectivist cultures. Also, factors such as language skills of staff, staff knowledge of
8
store and location or store’s atmosphere can also help measuring shopping satisfaction
(Lin and Chen, 2013).
2.4 . Research Objective and Research Question
According to Herrmann (1970) each generation is moulded by its own unique
experiences and, in a fast-changing world, the experiences of one generation and the
next might diverge significantly. He believes that these differences in generational
experiences are clearly enlightened when we compare the experiences of young adults
with those of their parents. As a result of the differences of what they have experienced
throughout their lives, it is not shocking that both the attitudes and the behaviour of the
two generations differ. One aspect of behaviour which seems particularly likely to differ
between the two generations is their behaviour as consumers.
Since age is one of the passengers’ attributes that influence their shopping choices (Perng et al., 2010), the purpose of this research is twofold. Firstly, one intends to
understand 1) what young adults’ duty free shoppers (18-26 years old) want and are
getting from travel retail shopping on airports environments. Secondly, 2) their
satisfaction level with regard to products, service quality and shopping in duty free
shops will be empirically explored. The aim is to find what can be done to best serve
this new generation.
3. Methodology
3.1. Sample
Young adults’ duty free shoppers were considered as the target population, no matter
their nationality. According to Herrmann (1970) young adults corresponds to the 18-24
age group. Still, since the majority of the respondents were Portuguese, for the purpose
of this research the upper limit was increased to twenty-six years old as that was the
9
Within the week dedicated to data collection, 240 surveys were entirely completed.
From these completed questionnaires, 20 respondents did not meet the age requirements
and 32 were not duty free shoppers. As a consequence, those answers were eliminated
from the sample. Therefore, the total sample considered for data analysis is constituted
by 188 participants.
3.2. Research Design
The research tool used in this study was an online survey (exhibit 1), using the software
Qualtrics. The survey was shared with the potential respondents essentially via e-mail
and Facebook.
The questionnaire used open-ended questions, multiple choice questions and
non-comparative scales measures. Considering the non-non-comparative scale measures, Likert
Scales were used in order to classify the respondents’ degree of agreement or disagreement with a range of statements that were presented.
The survey was conducted in English and respondents took on average 10 min to fill out
the questionnaire. It was first pre-tested within a small group of 15 respondents in order
to ensure respondents’ comprehension of all questions.
4. Findings and Results
14.1. Sample characterization (exhibit 2)
With the purpose of obtaining an accurate portrayal of the final sample and to create
different profiles of the respondents, some demographic characteristics as well as travel
and consumer behaviour aspects were analysed.
More women than men (Q2) completed the questionnaire (67.6% females and 32.4%
male). The large majority of respondents (Q3) live in Portugal (64.9%) and, for that
1
For the sake of clarity and easiness of reading the results, the number of the specific question from the survey is indicated in parenthesis.
10
reason, the specific country of residence parameter will not be taken into account since
it is not representative and, instead, we distinguished between respondents that are
currently living in Portugal and respondents that are not living Portugal. Nevertheless,
there were no significant differences except for the frequency of traveller.
When asked about the purpose of the trip (Q6), respondents were allowed to answer
only the major purpose - business, leisure or both. The majority of the respondents
reported “leisure” as the main purpose of their trips (76.1%) whilst only 3.2% of the respondents affirmed that the main reason of their trips was for business, and 20.7% of
the respondents disclosed that they travelled for both business and leisure.
In order to assess how often the respondents travelled by plane (Q5), a 7-point likert
scale question was asked. Subsequently, a new variable was created “frequency of
traveller” and respondents were allocated into two different groups “heavy travellers” – those who travel once in 3 months or more frequently and “light travellers” – those who
travel less than once in 3 months”. According to this criterion, 66% of the respondents
were classified as “light travellers” and 34% as “heavy travellers”. As referred above, 79% of “light travellers” live in Portugal while 62.5% of heavy travellers do not live in Portugal (exhibit 3).
In terms of shopping behaviour, the preferred location of purchases (Q11), the
frequency of shopping (Q10) and the time spent (Q12) were also assessed. The large
majority of the respondents (79.3%) claimed that usually buy on departure duty free
stores while 13.8% buy both on departure and arrival duty free stores and only 6.9%
admitted that usually buy on arrival duty free stores. In what concerns the frequency of
shopping (Q10), a 4-point likert scale was used and later recoded into a new variable
“frequency of shopping”. In this case, respondents were divided into two groups “light buyers” – those who affirmed that buy rarely or only when they have plenty of time- and “heavy buyers”- those who admitted to buy every time or almost every time they
11
are at an airport. The majority of the respondents were “light buyers” (68.6%) and only 31.4% were “heavy buyers”. Accordingly, 38.3% of the respondents affirmed that they
usually spend half (or more) of the time they have available shopping on a duty free
store, while 61.7% admitted that they spent less than half of the time they have.
4.2. What do young adults value? What do they prefer? 4.2.1. Reasons to enter a duty free store
With the intention of evaluating the reason why the respondents visit a duty free store, a
question in the form of a ranking was asked where 1 stood for the most important
reason and 6 for the less important one (Q13). The average mean as well as the mode obtained for each and every item are shown in table 1. It is also important to mention
that the order of the answers obtained is not the same as the one presented in the
questionnaire.
Purpose on visiting a Duty free store Mean Mode
To browse the store and pass time 2,27 1
To take advantage of airport prices/offers 3,16 2
To buy a gift 3,23 2
Someone asked me to buy an item 3,98 3
To treat myself 4,05 5
To buy products to use during my trip 4,35 6
Table 1: Purpose on visiting a Duty free store
Furthermore, one decided to assess whether there were significant differences between
gender, trip reason, frequency of shopping, frequency of traveller and time of purchase.
To do so, one reduced the values of each variable to two dimensions: Important – those
who ranked the variable on the first or second place- and Not So Important - those who
ranked the variable on the third, fourth, fifth or sixth place. Finally, as all the variables
were categorical, cross tabulation with the associated qui-square tests were applied.
The results indicated a statistically significant difference between light travellers and
heavy travellers with respect to the reason To buy a gift (p =0.043). In fact, 45.5% of the light travellers considered it as an important reason while only 30.2% of heavy
12
travellers ranked it as the first or second motive (exhibit 4). Additionally, it was also
found a significant difference between light travellers and heavy travellers with respect
to the reason To take advantage of airport offers/prices (p=0.001). In this case, while
62.9% of the heavy travellers considered it as an important reason only 37.4% of the
light travellers ranked it on the top 2 motives (table 2 and exhibit 5).
Important reason
Purpose on visiting a Duty free store Heavy travellers Light travellers p-value
To buy a gift 30.2% 45.5% 0.043
To take advantage of airport prices/offers 62.9% 37.4% 0.001
Table 2: Heavy travellers & Light travellers vs Reasons to enter a Duty free store
The results also showed a statistically significant relationship between the time of the
purchase – arrival/departure/both duty free store- and the reason To browse the store
and pass time (p= 0.033). It is not surprising that 68.7% of the respondents who claim to buy on departure duty free stores consider it as an important reason while only 46.2%
who buy on the arrival and on both stores ranked it as a relevant motive (exhibit 6). The
same happened with the relationship between the frequency of shopping and the reason
To browse the store and pass time (p = 0.000) with 74.8% of the light buyers ranking it as an important reason and only 40.7% of the heavy buyers thinking the same way
(table 3 exhibit 7).
Departure vs Arrival Frequency of shopping
To browse the store and pass time
Departure Arrival Both Heavy buyer Light buyer
Important reason 68.7% 46.2% 46.2% 40.7% 74.8%
Table 3: Reason to browse the store and pass time vs time of the purchase & frequency of shopping
With respect to the motive To take advantage of airport offers/prices, airport offers and
prices appeal more to heavy buyers (66.1%) than light buyers (36.5%), attracting them
to enter a duty free store (table 4 and exhibit 8).
Table 4: To take advantage of airport offers/prices vs frequency of shopping
Frequency of shopping
To take advantage of airport offers/prices
Heavy buyer Light buyer
Important
13
4.2.2. Which products do young adults buy?
Regarding the different type of products that the respondents usually buy (Q15), on
average the candy and chocolates are the products that are mostly bought by all
respondents followed by the category of perfumes and cosmetics. Jewerelly is the
category that less appeals to young adults (exhibit 9).
Moreover, a new variable was created Number of categories bought with two
dimensions: less than three different categories and three or more different categories.
Once again, as the variables were categorical, the qui-square test was applied in order to
take valid conclusions.
An obvious result was that customers that bought more than 3 different categories of
products were more prone to be buyers of all the categories. In terms of wine, spirits
and beers, it represents 41.9% of buyers who usually buy three or more categories and
19.3% who buy less than three categories (p= 0.01) (exhibit 10). The same happens
with perfumes and cosmetics, with percentages of, respectively, 72.4% against 47% (p=
0.000) (exhibit 11), with tobacco (respectively 33,3% and 13,3%, p= 0.001)(exhibit
12), and food shoppers (respectively 62% and 25.3%, p= 0.000) (exhibit 13).
Other interesting fact is that some categories present gender differences. Around 46% of
men buy products within the wine, spirits and beer category against 25.2% of women
(p=0.004) (exhibit 14). This difference is also noticeable within the perfumes/cosmetics
(p=0.003) and electronics categories (p=0.048) with 68.5% of women buying
perfumes/cosmetics whereas only 45.9% of men are purchasers (exhibit 15). Contrarily,
11.5% of men are buyers of electronics while only 3.9% of female respondents admitted
to purchase these products (exhibit 16).
Additionally, it was also found a relationship between the frequency of shopping and
14
around 73% of heavy buyers are purchasers within this category against 56% of light
buyers (exhibit 17).
Finally, one decided to assess whether there was a difference between the frequency of
travellers within the different categories. According to the results, there is a statistically
significant difference between heavy and light travellers within the category of wine,
spirits and beer and candy and chocolates. In the first case, 56.3% of heavy travellers
buy items from the category against 19.4% of the light travellers (p=0.000) (exhibit 18)
On the other hand, 79% of light travellers buy chocolates and candies while only around
55% of heavy travellers do the same (p= 0.001) (exhibit 19).
4.2.3. What do young adults value?
With the goal to understanding what this target really values, several aspects about the
way the respondents choose an item - item price, item brand and item characteristics-
were examined (Q16).
Regarding the item price, not surprisingly, the large majority (69%) admitted to opt for
the convenience price. Additionally, 64 % of the respondents select the brands they 130
120
21
45 56 53 55
84
15
already know, 11% pick new brands and 24% choose prestigious brands. Lastly,
concerning the item characteristics, 30% of the respondents value travel exclusive
products, 28% look for novelties, 29% of the respondents choose products with a nice
packaging and 44.7% choose products they really need for their trip.
The results indicated that there is a statistically significant relationship between the
gender and the item price with 59% of men opting for the convenience price against
74% of women (p= 0,037) (exhibit 20). Likewise, it was found that 33.9% of heavy
shoppers select the prestigious brands while only 19.4% of light buyers do the same (p=
0,030) (exhibit 21) and that 75% of heavy travellers against 59% of light travellers
select brands they already know (p= 0,029) (table 5 and exhibit 22)
Male Female p-value
Convenience price 59% 74% 0,037
Heavy shopper Light shopper p-value
Select prestigious brands 33.9% 19.4% 0,030
Heavy travellers Light travellers p-value
Select brands they already know 75% 59% 0.029
Table 5: Gender, frequency of shopping & frequency of traveller vs preferences
4.2.4. What do young adults want?
The second main objective of this study is to understand what young adults want from
duty free stores in order to give some recommendations on how to best serve this target.
To do so, three questions were asked regarding the type of promotions and services the
respondents would be interested and most likely to use (Q20, Q21 and Q22).
On the subject of promotions (Q21), the majority of the respondents would be mostly
motivated to buy a product if they had a promotion associated with a price reduction
(see graph 2).
16
Additionally, results suggested that there is a statistically significant relationship
between the type of promotions and gender (p= 0,016) (exhibit 23). In truth, 47.5% of
men would prefer to have a Best price guaranteed promotion while only 26% of women
think the same way. Moreover, 58.3% of female respondents against 42.6% of male
respondents would prefer to have a price reduction promotion. Regarding the gift with
purchase promotion only 3.3% of men against 10.2% of women would like to have that opportunity (table 6).
Gender
Type of promotion Male Female p-value
Best price guaranteed 47.5% 26% 0.016
Price reduction promotion 42.6% 58.3% 0.016
Gift with purchase 3.3% 10.2% 0.016
Table 6: Gender vs type of promotions
Furthermore, a Likert scale question (from 1 “Not interested at all” to 7 “Totally
interested”) that aimed to measure if the respondents would like to have a dedicated area for different categories proposed was asked. Six options were given: (1) Special
offers and promotions, (2) new products, (3) duty free exclusive products, (4) ideas for
gifts, (5) top 10 bestsellers per category and (6) super luxury goods (Q20). The mean
values were computed for each item and are shown in the table 7. On average,
respondents would prefer to have a special area dedicated for special offers and
promotions within the duty free shops.
Variable Mean
Special offers/promotions 5,77 Duty free exclusive products 5,39
Ideas for gifts 5,06
New products 4,95
Top 10 bestsellers per category 4,59
Super luxury goods 3,20
Table 7: Mean for the different categories
In order to understand if there was a difference in preferences according to the
frequency of traveller, frequency of shopping and gender, one conducted an
17
were some significant differences regarding the frequency of traveller and frequency of
shopping. Concerning the frequency of shopping, the means between the heavy
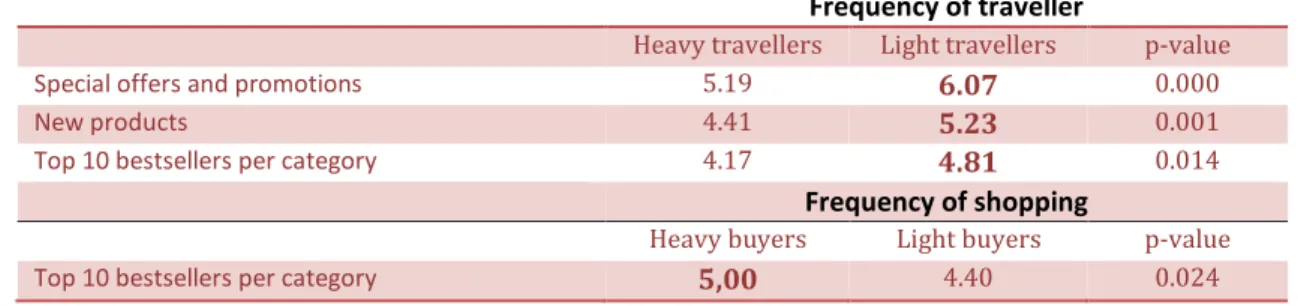
travellers and light travellers were statistically significant for the variables Special offers
and promotions (µ=6,07 for light travellers and µ=5,19 for heavy travellers), New products (µ=5,23 for light travellers and µ=4,41 for heavy travellers) and Top 10 bestsellers per category (µ=4,81 for light travellers and µ=4,17 for heavy travellers). Regarding the frequency of shopping, the mean between heavy buyers and light buyers
was only statistically significant for the variable Top 10 bestsellers per category
(µ=4,40 for light buyers and µ=5,00 for heavy buyers) (table 8, exhibit 24 and 25).
Frequency of traveller
Heavy travellers Light travellers p-value
Special offers and promotions 5.19 6.07 0.000
New products 4.41 5.23 0.001
Top 10 bestsellers per category 4.17 4.81 0.014
Frequency of shopping
Heavy buyers Light buyers p-value
Top 10 bestsellers per category 5,00 4.40 0.024
Table 8: Different categories vs Frequency of traveller & frequency of shopping
Lastly, five suggestions of services were given and respondents were asked to rank
them according to their level of interest, being 1 the most important reason and 5 the
less important one (Q22). The average means as well as the mode obtained for each and every item are shown in table 9. Once again, it is important to denote that the answers
obtained are not in the default order that was presented on the questionnaire.
Services respondents would be interested and most likely to use Mean Mode
Pick-up the product on the return 2,32 1
Pre-order opportunity via internet 2,72 1
Gift wrapping service 3,09 3
Loyalty program 3,28 4
Personal shopping consultant 3,77 5
Table 9: Services respondents would be interested in – mean & mode
According to these results, respondents seem to be more interested and most likely to
pre-18
ordering the product via internet. In addition, one could not find any statistically
significant relationship between the variables presented and the gender of the
respondents, frequency of travellers, frequency of shopping and time spent on duty free
store.
4.3. How satisfied are young adults?
In order to measure the respondents’ degree of satisfaction towards the overall service on duty free shops, a Likert Scale was used from 1 “Very Dissatisfied” to 7 “Very
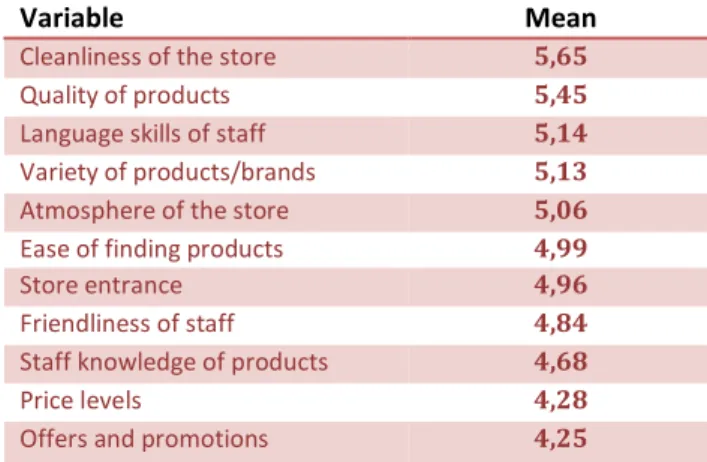
Satisfied” (Q19). On average, the respondents admitted to be somewhat satisfied with the overall service, with a mean value of 5,05. Additionally, the level of satisfaction
towards eleven aspects of Duty Free stores was accessed. Again, a 7 point Likert Scale
with the same measurement level was used. The mean values were computed for each
item and are shown in the table 10.
Variable Mean
Cleanliness of the store 5,65
Quality of products 5,45
Language skills of staff 5,14 Variety of products/brands 5,13
Atmosphere of the store 5,06
Ease of finding products 4,99
Store entrance 4,96
Friendliness of staff 4,84
Staff knowledge of products 4,68
Price levels 4,28
Offers and promotions 4,25
Table 10: Satisfaction level - mean
In order to better understand which of those factors affected the satisfaction towards
service, a linear regression was performed using the overall satisfaction towards the
service (question 18 of the questionnaire) as the dependent variable, and all the others
(store entrance, atmosphere of the store, cleanliness of the store, ease of finding
products, friendliness of the staff, staff knowledge of products, language skills of the
staff, variety of products/brands, quality of products, price levels and offer and
19
was considered significant (sig. 0,000). Still, the coefficients only indicated as
significant the variables quality of products (p=0,001) and price levels (p=0,034).
(exhibit 26.1)
Furthermore, with the purpose of reducing the dimensions considered, a factor analysis
was done (exhibit 26.2). In the factor analysis, one got a KMO of 0,755, which means
that correlations between pairs of variables can be explained by other variables,
meaning that factor analysis was a good choice. Moreover, having a sig. of 0,000, one
rejected the hypothesis of the variables not being correlated.
By analysing the total variance explained, it is perceptible that the components with
Eigen Value lower than 1 were excluded from the analysis and it is possible to explain
around 59% of the variance only using the first three components. As a final point,
through the rotated component matrix, one defined three different labels for the three
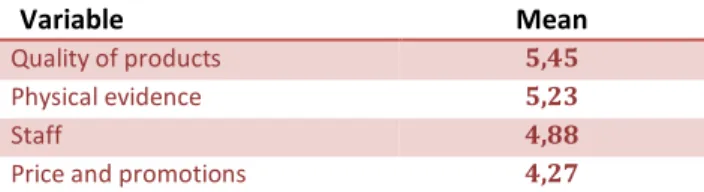
different categories. The first one was called as “Physical evidence of the stores”, the second one as “Staff” and the third one as “Price and promotions”. Still, since the variable “Quality of products” did not fit in any of these categories, it was preserved as an individual variable.
Variable Mean
Quality of products 5,45
Physical evidence 5,23
Staff 4,88
Price and promotions 4,27
Table 11: Satisfaction level – mean (after factor analysis)
Finally, considering these four independent variables, one ran, once again, a regression
analysis. All the independent variables became statistically significant – Physical
evidence of the stores (sig. 0,001), Staff (sig. 0,002), Price and Promotions (sig. 0,004)
and Quality of products (sig. 0,000). With an adjusted R squared equal to 0.364, one
concluded that the 36.4% of the overall satisfaction towards the service on duty free
20
Moreover, with respect to price levels and offers and promotions, heavy buyers seem to
be more satisfied than light buyers (p=0,000). (table 12 and exhibit 27)
Satisfaction towards… Light buyers Heavy buyers P-Value
Price levels 4,02 4,86 0,000
Offers and promotions 4,02 4,75 0,000
Table 12: Price levels & Offers and promotions vs frequency of shopping
5. Conclusions and Recommendations
In a fast growing market as is the case of the duty-free channel, young adults are
perceived as an important target. Hence, it is vital for managers, retailers and marketers
to identify and comprehend the reasons why this target buys at these stores, what it
values the most and what the perceptions and satisfaction levels of this segment towards
service are.
In order to know how to best serve this target, managers should start by shaping the
profile of this range of duty free shoppers. Results suggest that a large part of young
adults travel less than once in 3 months, mostly for leisure and that the majority of them
are not heavy buyers. Furthermore, results revealed that the categories of
candy/chocolates and perfumes/cosmetics are the ones that most appeal to this segment
and that the majority of the consumers within the category of perfumes and cosmetics
also buy products from three or more categories.
This research provided two main insights. The first conclusion concerns the fact that
young adults seem to be price driven, considering the reason “To take advantage of
airport prices/offers” as an important reason to enter a duty free store and giving emphasis to the importance of promotions associated with price reductions. This
suggests that they would strongly respond to price-off promotions on their usual
21
they tend to select the brands they already know and look for products needed for their
trips.
Additionally, the overall satisfaction rate towards the service on duty free stores was 5.5
on a scale of 1-7 which suggests that there is a fairly overall contentment with it. The
good news is that young adults seem to be pleased with the physical evidence of the
stores, appreciating the efforts retailers are putting on the store planning and design. As
a matter of fact, having a good store design and atmosphere can help creating an
environment that attracts customers, inviting them in and encouraging them to buy
products. Additionally, the quality of the products presents the highest satisfaction rate
which suggests that this parameter is highly rated.
Nevertheless, while they seem to be satisfied with the quality of the products, the same
does not happen with the price levels and promotions. As mentioned above, the
consumers within this segment are price driven, opting for the convenient price and
looking for promotions. Therefore, managers should try to improve their shopping
experience by offering special offers and promotions on the categories that appeal to
this segment.
As a final point, managers should take into account the existing opportunities in this
market, starting by considering the niches that are not yet properly exploited like the
case of the products needed for young adults’ trips. As a result, retailers and brands
could create a dedicated area for it with special promotions associated with young
adults’ favourite products. In addition, this target seems to be interested on a “pick-up the product on the return” service and on having the opportunity of pre-ordering the
product via internet. Given so, managers should try to meet these consumers’ expectations by providing those services.
22
6. Limitations and Further Research
This study faced three main limitations. Firstly, given the limited time, the number of
respondents was not too high. With a higher number of responses more accurate
conclusions could have been taken. Secondly, the purchasing power of the respondents
was not assessed. Therefore, in future research, a socio-economic analysis could be
done in order to better evaluate the buying behaviour of this segment. Thirdly, since the
large majority of respondents live in Portugal (64.9%), comparisons in term of country
of residence and nationality were not representative and we did not find any significant
differences between those who live in Portugal and those who do not. In future research,
a larger and wider nationality diversity sample should be explored and researchers need
to be aware of cultural differences when extending research findings to consumers in
other countries. Given so, to identify young adults’ preferences and concerns on a
global level, the next research step could be a cross-cultural study in order to find the
way culture affects their choices and satisfaction levels.
Finally, in order to make sure that the right people are being targeted, a complementary
23
7. References
Albuquerque, P. (2008), The Elderly and the Extended Household in Portugal: An Age-Period-Cohort Analysis. Population Research and Policy Review
Ambler, T. (1992), The Role of Duty Free in Global Marketing. Business Strategy Review Crawford, G. & Melewar, T.C. (2003), The importance of impulse purchasing behaviour in the
international airport atmosphere. Journal of Consumer Behaviour
DutyFree.Com (2015) What is Duty Free? Available at: http://www.dutyfree.com/What-Is-Duty-Free/Default.aspx (Access on 16 March 2015)
Euromonitor International, (2005), The Global Duty Free Market: Opportunities and Threats to 2010. Euromonitor International: Strategy Briefing
Euromonitor International, (2006), Beauty Brands to Fly High on Duty Free Sales. Euromonitor International
Euromonitor International, (2012), The Evolution of Duty-free Retailing: Past, Present and Future. Euromonitor International: Global Briefing
Filipović, V., Jovanović, D. & Kostić, S. (2013), Attracting Tourists to a Shopping Centre. Journal for Theory and Practice Management
Geuens, M., Vantomme, D., & Brengman, M., (2003), Developing a typology of airport Shoppers. Ghent University
Herrmann, R. (1970), Today’s Young Adults as Consumers. Journal of Consumer Affairs Kolter, P. (2000) Marketing Management: The Millennium Edition. International Edition. New
Jersey: Prentice-Hall, Inc.
Kotler, P. & Keller, K. (2012), Marketing Management 14th edition
Lee, J..& Kacen, J. (2008). Cultural influences on consumer satisfaction with impulse. Journal of Business Research, 61, 265–272.
Lin, W. & Chen, C. (2013) Shopping Satisfaction at Airport Duty-Free Stores: A Cross-Cultural Comparison, Journal of Hospitality Marketing & Management, 22:1, 47-66
Mohn, P. (2012), Travel Retail Survey: Middle East Airport Shopping Behaviour. Available at:http://www.tfwa.com/duty_free/fileadmin/user_upload/medfa/presentations_2012/Peter_ Mohn.pdf (Access on 25 March 2015)
Perng, S., Chow, C., & Liao, W. (2010). Analysis of shopping preference and satisfaction with airport retailing products. Journal of Air Transport Management, 16(5), 279-283
Stasiulevicuis, G.(2012) Revealing shopper truths in travel retail. Journal of Airport Management Vol 6, No. 3, 217-224
Timothy, D. & Butler, R. (1995), Cross-border shopping: a North American perspective. Annals of Tourism Research 22, 16-34.
Turley, L.W. & Milliman, R. (2000). Atmospheric effects on shopping behaviour: A review of the experimental evidence. Journal of Business Research, 49, 193–211.
World Duty Free. (2015) Tax and Duty Free Shopping. Available at: http://www.worlddutyfree.com/information/tax-and-duty-free-shopping.html (Access on 12 February 2015)