Serum fetuin-A levels are associated with serum
triglycerides before and 6 months after bariatric surgery
Christos G. Verras,
1Georgios A. Christou,
2Yannis V. Simos,
2George D. Ayiomamitis,
3Andreas J. Melidonis,
1Dimitrios N. Kiortsis
21Diabetes Center, Tzanio General Hospital, Piraeus, Greece, 2Laboratory of Physiology, Medical School, University of Ioannina, Ioannina, Greece, 32nd Department of Surgery, Tzanion General Hospital, Piraeus, Greece
ABSTRACT
OBJECTIVE: The elucidation of the changes of fetuin-A in the context of bariatric surgery.
DESIGN: Twenty obese patients (8 males, 12 females; body mass index = 42.5±3.4 kg/m2) were
studied at baseline and 6 months after bariatric surgery. RESULTS: Serum fetuin-A levels did not differ with regard to the presence of each individual component of the Metabolic Syndrome (MetS) at baseline, except for hypertriglyceridaemia [increased serum fetuin-A levels (p=0.011)]. Circulating fetuin-A was positively correlated with serum triglycerides (TG) (r=0.461, p=0.047) and negatively correlated with serum globulins (r=-0.477, p=0.033) and C-reactive protein (CRP) (r=-0.604, p=0.010), while it independently predicted TG at baseline. Circulating fetuin-A did not change during the 6 months either in the whole population or in the subgroups of patients who were positive for each individual component of MetS at baseline and negative for this component at 6 months of follow-up, except for hypertriglyceridaemia [reduction of serum fetuin-A levels (p=0.046)]. The subgroup of patients with a decrease in circulating fetuin-A during the 6 months was characterized by a smaller reduction of serum globulins (p=0.003) and CRP (p=0.049). The change in serum fetuin-A levels over the 6 months was positively cor-related with the change in TG (r=0.592, p=0.006) and negatively corcor-related with the change in serum globulins (r=-0.523, p=0.018) and CRP (r=-.494, p=0.037). CONCLUSIONS: Circulat-ing fetuin-A predicted serum triglycerides before as well as 6 months after bariatric surgery. Key words: Metabolic syndrome, Obesity, Weight loss
Address for correspondence:
Dimitrios N. Kiortsis, MD, PhD, Professor of Physiology, Laboratory of Physiology, Medical School, University of Ioannina, 45110 Ioannina, Greece; Tel.: +30 2651007551, Fax: +30 2651007850, E-mail: [email protected]
Received: 25-06-2017, Accepted: 02-08-2017
Research paper
INTRODUCTION
Fetuin-A, a plasma glycoprotein, is a negative acute phase reactant that is secreted predominantly by the
liver in adults.1 Fetuin-A regulates calcium
metabo-lism, being an important inhibitor of calcification in various tissues, including the vascular wall.2 Another
reported function of fetuin-A is the induction of insulin resistance through the inhibition of insulin receptor tyrosine kinase.3 Serum fetuin-A levels have been
shown to be increased in patients with type 2 diabetes mellitus (T2DM) or metabolic syndrome (MetS), as well as in the presence of some individual components
of MetS.4-6 However, there is an inconsistency in the
results of the studies investigating the association of circulating fetuin-A with each individual component of MetS. regarding the relationship of circulating fetuin-A with body weight status, although most of the studies have found a positive association between circulating fetuin-A and body mass index (BMI) and a reduction of serum fetuin-A levels after weight loss, some studies reported conflicting results.6-16
Bariatric surgery is a weight loss intervention achieved via an alteration not only of the passage of food through the gastrointestinal tract, but also of the secretion of gut hormones regulating appetite.17
Moreo-ver, among weight loss interventions the magnitude of weight reduction after bariatric surgery is by far the greatest. Two studies that evaluated the changes in circulating fetuin-A after bariatric surgery found a decrease in serum fetuin-A levels, with one of the studies showing no change in circulating fetuin-A, though the exact metabolic role of fetuin-A in this context remains to be investigated.14,15,18 The
relation-ship of the changes in circulating fetuin-A with the changes in body composition after bariatric surgery has not been previously investigated. Although body weight (BW) decreases progressively during the 12 months’ period following bariatric surgery, loss of lean body mass (LBM) and reduction of basal meta-bolic rate (BMr) occur only up until completion of the first 6 months without any further decrease in the later period.19,20 Therefore, the first 6-month period
following bariatric surgery represents the period of acute change in substrate utilization. The present study is a detailed analysis of body composition and a full assessment of glycaemic and lipoprotein parameters in obese patients undergoing bariatric surgery carried out to elucidate the relationship of the changes in circulating fetuin-A with the changes in metabolic parameters 6 months after bariatric surgery.
MATERIALS AND METHODS
Subjects
The study was conducted by the Laboratory of Physiology of the Medical School of Ioannina Uni-versity in collaboration with the Obesity Clinic of the Diabetic Center and the Second Surgical Clinic of Tzaneio General Hospital. The study participants
were recruited from April 2012 to April 2013. Twenty obese subjects (8 men and 12 women) participated in the study. They were admitted to the surgical clinic to undergo a scheduled bariatric surgery. All patients were subjected to laparoscopic sleeve gastrectomy. Inclusion criteria for the study were BMI ≥40 kg/ m2 or BMI = 35-40 kg/m2 with obesity-related
co-morbidities. Exclusion criteria were kidney disease, liver disease, gastrointestinal disease, neurological or psychiatric disorder, hypothyroidism, hyperthy-roidism, malignancy, use of psychoactive substances and history of drug dependence. Lansoprazole 30 mg once daily was prescribed to all patients following surgery. There were 5 patients with T2DM and stable glycaemic control during follow-up who were taking the following antidiabetic medications: insulin (2), metformin (3), sulfonylureas (1), gliptins (1), thia-zolidinediones (1), exenatide (1). Six patients had arterial hypertension and were taking the following antihypertensive medications: angiotensin II recep-tor antagonists (4), calcium channel blockers (1), diuretics (3), beta blockers (1). Five patients were under statin treatment. All patients provided written informed consent to participate in the study before the surgery. The study was approved by the Ethics Committee of the Tzaneio General Hospital.
Anthropometric measurements, body fat assess-ment and collection of venous blood samples after an overnight fast of at least 12 h were performed at baseline and 6 months after bariatric surgery. Serum samples were stored at -80 °C until analysis.
Body fat measurement
Body composition was assessed by Bioelectrical Impedance (BIA). The device used was the tetrapo-lar scale Tanita BC 418 MA (Tanita Corporation, Japan) which provided the BW and a complete body composition analysis. The Tanita BC 418 MA is a monofrequency BIA analyser which uses the frequency of 50 kHz and 8 electrodes integrated in the handles and the stepping platform for transmission of a weak electrical current through the body. The Tanita BC-418 MA can show separate body mass readings for each upper and lower limb and the trunk with the use of 8 polar electrodes. The Tanita formula takes into account gender, age, height, BW and distinguishes between “athlete” and “non-athlete”. This instrument
can provide a complete body composition profile in-cluding Body Fat Percentage (BF%), Body Fat Mass (BFM), BMI, LBM, Estimated Muscle Mass, Total Body Water and BMr. All the measurements were performed in the morning before breakfast and after evacuation of the bladder. Patients were instructed to abstain from exercise, alcohol and caffeine during the day preceding the measurement of body composition. All the measurements were performed before bariatric surgery as well as 6 months after surgery.
Fetuin-A measurement
Serum fetuin-A levels were measured using an enzyme-linked immunosorbent assay (ELISA) kit (BioVendor research and Diagnostic products, Brno, Czech republic) with intra-assay CV 2.2-3.6 % and inter-assay CV 3.1-6.3 %.
Routine biochemical measurements and calculations
Fasting blood samples were analyzed for total cholesterol (TC), triglycerides (TG), high-density lipoprotecholesterol (HDL-C), glucose (Glc), in-sulin (Ins), glycated haemoglobin (HbA1c), uric acid, creatinine (Cre), total proteins (TPr), albu-min, fibrinogen, C-reactive protein (CrP), thyroid-stimulating hormone (TSH), free thyroxine (FT4) and
triiodothyronine (T3), using the standard procedures
of the biochemistry laboratory of our Hospital. Ho-meostatic model assessment (HOMA)-index was calculated using the formula [fasting insulin (µU/ mL) × fasting glucose (mg/dL)]/405. The quantita-tive insulin sensitivity check index (QUICKI) was calculated using the formula 1 / [log fasting insulin (µU/mL) + log fasting glucose (mg/dL)]. Low-density lipoprotein cholesterol (LDL-C) was calculated using the Friedewald equation [LDL-C = TC - (HDL-C + TRG/5)]. Non-HDL-cholesterol (non-HDL-C) was calculated as TC - HDL-C. Serum levels of globulins were calculated as TPr - serum albumin.
Statistical analysis
All statistical analyses were performed using the IBM SPSS Statistics 23.0. The Kolmogorov-Smirnov test was used to verify the normality of the distribu-tions of the parameters. All the studied parameters were normally distributed and were expressed as means ± SD. The paired t-test, independent t-test
and Pearson’s correlation analysis were performed for normally distributed parameters. The Analysis of Variance (ANOVA) test was applied to determine whether circulating fetuin-A changed with the num-ber of factors of MetS at baseline. Linear regression analysis was used to identify the independent pre-dictors of TG at baseline. A two-tailed p <0.05 was considered significant.
RESULTS
The characteristics of the patients at baseline and after 6 months following bariatric surgery are shown in Table 1. The reduction of BW (24.9 ± 9.1%) dur-ing the 6 months followdur-ing bariatric surgery was ac-companied by reduction of BFM, LBM and of both systolic blood pressure (SBP) and diastolic blood pressure (DBP), as well as by improvement of the lipid profile, as indicated by the decrease in TC, TG, LDL-C and the increase in HDL-C. Moreover, there was a reduction of insulin resistance following bariatric surgery, as indicated by the decrease in HOMA-index and the increase in QUICKI. TPr decreased during this period due to a reduction in serum globulins. The number of study participants who had MetS was 15 at baseline and 6 at 6 months of follow-up.
Comparisons at baseline
Serum fetuin-A levels did not differ between sub-jects with MetS and those without MetS (p=0.622) and did not change with the number of factors of MetS (p=0.673) at baseline. Serum fetuin-A levels did not differ with regard to the presence of each individual component of MetS at baseline, except for hypertriglyceridaemia, where increased serum fetuin-A levels were found in the presence of this component (p=0.011).
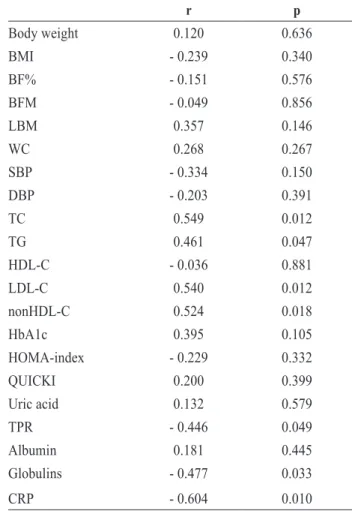
Correlation analysis at baseline
The relationship between serum fetuin-A levels and various parameters at baseline is shown in Table 2. Serum fetuin-A levels were positively correlated with TC, TG, LDL-C and non-HDL-C and negatively cor-related with CrP, TPr and serum globulins at baseline. The association of circulating fetuin-A with globulins disappeared after adjustment for CrP. The relationship between circulating fetuin-A and lipid parameters did not change when a subgroup analysis was performed
Table 1. The characteristics of the patients (n = 20) at baseline and
after 6 months of bariatric surgery
Baseline 6 months p (6 months vs baseline) Body weight (Kg) 126.1 ± 21.1 94.8 ± 20.8 <0.001 BMI (Kg/m2) 42.5 ± 3.4 32.0 ± 4.8 <0.001 BF% (%) 44.0 ± 6.9 34.7 ± 9.7 <0.001 BFM (Kg) 54.4 ± 10.6 34.7 ± 13.2 <0.001 LBM (Kg) 71.7 ± 16.9 60.1 ± 14.0 <0.001 WC (cm) 125.7 ± 14.2 104.5 ± 17.8 <0.001 SBP (mmHg) 138 ± 14 126 ± 11 <0.001 DBP (mmHg) 87 ± 11 77 ± 8 <0.001 TC (mg/dL) 220 ± 46 189 ± 33 0.010 TG (mg/dL) 132 ± 39 91 ± 29 <0.001 HDL-C (mg/dL) 40 ± 10 47 ± 15 0.045 LDL-C (mg/dL) 137 ± 34 126 ± 22 0.185 nonHDL-C (mg/dL) 180 ± 49 143 ± 22 0.003 Glc (mg/dL) 114 ± 41 98 ± 24 0.039 Ins (μU/mL) 19.3 ± 7.4 12.0 ± 4.7 <0.001 HbA1c (%) 6.5 ± 1.4 5.6 ± 0.9 0.001 HOMA-index 5.6 ± 3.3 3.0 ± 1.8 <0.001 QUICKI 0.305 ± 0.022 0.332 ± 0.024 <0.001 Uric acid (mg/dL) 6.5 ± 1.0 5.3 ± 1.1 <0.001 TPR (mg/dL) 7.3 ± 0.4 6.8 ± 0.5 0.002 Albumin (mg/dL) 4.3 ± 0.3 4.2 ± 0.3 0.392 Globulins (mg/dL) 2.9 ± 0.4 2.6 ± 0.4 0.001 CRP (mg/L) 13.3 ± 8.2 6.5 ± 4.3 <0.001 Fetuin-A (μg/mL) 268.1 ± 53.1 263.8 ± 68.4 0.808 Data are mean ± standard deviation for normally distributed variables. The p value refers to the comparison between baseline values and those 6 months after bariatric surgery.
Abbreviations: BFM: Body fat mass; BF%: Body fat percentage;
BMI: Body Mass Index; CrP: C-reactive protein; DBP: Diastolic blood pressure; eGFr: Estimated glomerular filtration rate; FT4:
Free thyroxine; HbA1c: Glycated haemoglobin; HDL-C: High-density lipoprotein-cholesterol; HOMA-index: Ηomeostasis model assessment insulin resistance index; LBM: Lean body mass; LDL-C: Low-density lipoprotein-cholesterol; non-HDL-C: Non-HDL-cholesterol; QUICKI: Quantitative insulin sensitivity check index; Cre: Serum creatinine; Glc: Serum glucose levels; Ins: Serum insulin levels; TPr: Serum levels of total proteins; SBP: Systolic blood pressure; TSH: Thyroid-stimulating hormone; TC: Total cholesterol; TG: Triglycerides; T3: Τriiodothyronine;
WC: Waist Circumference.
Table 2. The relationship between serum fetuin-A levels and various
parameters at baseline r p Body weight 0.120 0.636 BMI - 0.239 0.340 BF% - 0.151 0.576 BFM - 0.049 0.856 LBM 0.357 0.146 WC 0.268 0.267 SBP - 0.334 0.150 DBP - 0.203 0.391 TC 0.549 0.012 TG 0.461 0.047 HDL-C - 0.036 0.881 LDL-C 0.540 0.012 nonHDL-C 0.524 0.018 HbA1c 0.395 0.105 HOMA-index - 0.229 0.332 QUICKI 0.200 0.399 Uric acid 0.132 0.579 TPr - 0.446 0.049 Albumin 0.181 0.445 Globulins - 0.477 0.033 CrP - 0.604 0.010
Abbreviations: BFM: Body fat mass; BF%: Body fat
percent-age; BMI: Body Mass Index; CrP: C-reactive protein; DBP: Diastolic blood pressure; eGFr: Estimated glomerular filtra-tion rate; FT4: Free thyroxine; HbA1c: Glycated haemoglobin;
HDL-C: High-density lipoprotein-cholesterol; HOMA-index: Ηomeostasis model assessment insulin resistance index; LBM: Lean body mass; LDL-C: Low-density lipoprotein-cholesterol; non-HDL-C: Non-HDL-cholesterol; QUICKI: Quantitative in-sulin sensitivity check index; Glc: Serum glucose levels; Ins: Serum insulin levels; TPr: Serum levels of total proteins; SBP: Systolic blood pressure; TSH: Thyroid-stimulating hormone; TC: Total cholesterol; TG: Triglycerides; T3: Τriiodothyronine;
WC: Waist Circumference.
excluding those taking lipid-lowering drugs. TG was positively correlated with WC (r=0.480, p=0.038) and tended to be correlated with Glc (r=0.408, p=0.074) at baseline, while there was no correlation with BW, BMI, BF%, Ins, HOMA-index and QUICKI. We performed multiple linear regression analysis to predict TG at baseline using as independent variables serum
fetuin-A levels (β=0.455, p=0.042), WC (β 0.274, p=0.207) and Glc (β=0.348, p=0.108). In this model (adjusted r2=0.348, p=0.024) serum fetuin-A levels were the
only variables that independently predicted TG.
Change in circulating fetuin-A after 6 months of follow-up
Serum fetuin-A levels did not change during the first 6 months following bariatric surgery in the whole population (Figure 1). Circulating fetuin-A did not change in the subgroup of patients who had MetS at baseline and no MetS at 6 months of follow-up (p=0.194), nor in the subgroup of patients whose number of components of MetS decreased during the period of 6 months (p=0.506). Serum fetuin-A levels did not change during this period in the subgroups of patients who were positive for each individual component of MetS at baseline and negative for this component at 6 months of follow-up, except for hypertriglyceridaemia, where there was a decrease in serum fetuin-A levels (p=0.046). A smaller re-duction of both serum globulins (p=0.003) and CrP (p=0.049) was found in the subgroup of patients with a decrease in circulating fetuin-A at 6 months follow-up compared with those who did not have a decrease in circulating fetuin-A.
Correlation analysis during the 6 months of follow-up
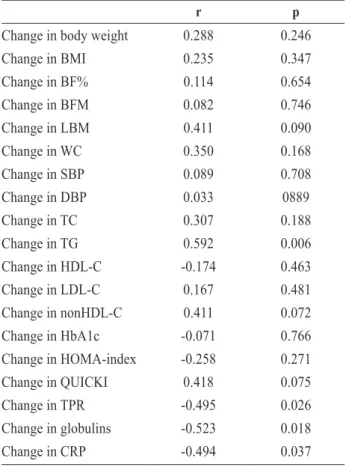
The relationships between the change in serum
fetuin-A levels and the changes in various parameters after 6 months’ follow-up are shown in Table 3. The change in serum fetuin-A levels over this period was positively correlated with the change in TG and negatively correlated with the change in CrP, TPr and serum globulins, while there was a tendency for a positive relationship with the change in LBM and non-HDL-C. The relationship between the change in circulating fetuin-A and the change in TG persisted
Figure 1. A box plot showing serum fetuin-A levels at baseline
and 6 months following bariatric surgery. The difference in cir-culating fetuin-A between these time points was not significant.
Table 3. The relationship between the change in serum fetuin-A levels
and the changes in various parameters 6 months after bariatric surgery.
r p
Change in body weight 0.288 0.246 Change in BMI 0.235 0.347 Change in BF% 0.114 0.654 Change in BFM 0.082 0.746 Change in LBM 0.411 0.090 Change in WC 0.350 0.168 Change in SBP 0.089 0.708 Change in DBP 0.033 0889 Change in TC 0.307 0.188 Change in TG 0.592 0.006 Change in HDL-C -0.174 0.463 Change in LDL-C 0.167 0.481 Change in nonHDL-C 0.411 0.072 Change in HbA1c -0.071 0.766 Change in HOMA-index -0.258 0.271 Change in QUICKI 0.418 0.075 Change in TPr -0.495 0.026 Change in globulins -0.523 0.018 Change in CrP -0.494 0.037
Abbreviations: BFM: Body fat mass; BFM: Body fat mass; BF%:
Body fat percentage; BMI: Body Mass Index; CrP: C-reactive pro-tein; DBP: Diastolic blood pressure; eGFr: Estimated glomerular filtration rate; FT4: Free thyroxine; HbA1c: Glycated haemoglobin;
HDL-C: High-density lipoprotein-cholesterol; HOMA-index: Ηomeostasis model assessment insulin resistance index; LBM: Lean body mass; LDL-C: Low-density lipoprotein-cholesterol; non-HDL-C: Non-HDL-cholesterol; QUICKI: Quantitative in-sulin sensitivity check index; Glc: Serum glucose levels; Ins: Serum insulin levels; TPr: Serum levels of total proteins; SBP: Systolic blood pressure; TSH: Thyroid-stimulating hormone; TC: Total cholesterol; TG: Triglycerides; T3: Τriiodothyronine;
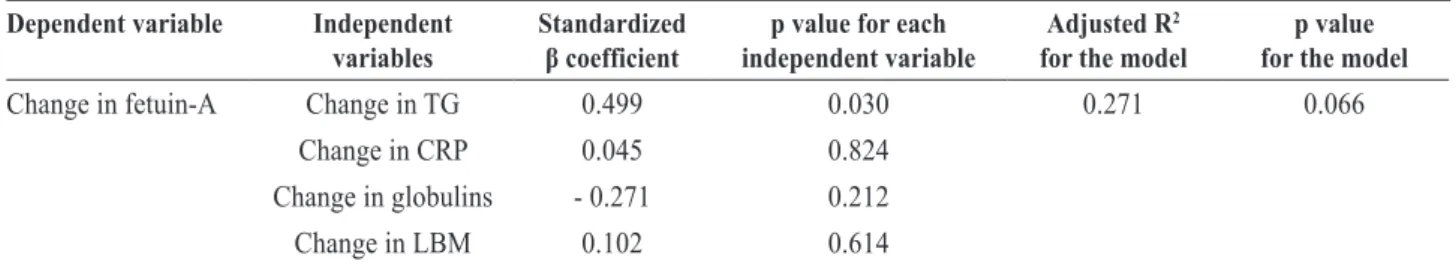
when a subgroup analysis was performed, excluding those taking lipid-lowering drugs. After performing multiple linear regression analysis, with the change in circulating fetuin-A as a dependent variable and the changes in TG, CrP, serum globulins and LBM as independent variables, only the change in TG was significantly correlated with the change in circulating fetuin-A (Table 4). The change in TG over 6 months after bariatric surgery was not correlated with changes in BW, BMI, WC, BF%, Glc, Ins, HOMA-index and QUICKI.
DISCUSSION
The present study found that although serum fetuin-A levels did not change 6 months after bariatric surgery, a reduction of circulating fetuin-A occurred more frequently in individuals with smaller reduction of globulins and CrP. Circulating fetuin-A independently predicted serum TG levels in a steady metabolic state, as well as 6 months after bariatric surgery.
We demonstrated no relationship of serum fetuin-A levels with BMI at baseline. The previously reported positive association of circulating fetuin-A with BMI referred to populations with a wide range of BMI, including not only obese patients, but also lean or overweight individuals.6-9 Thus, the fact that our study
only evaluated subjects with BMI ≥35 kg/m2 may
have limited the potential for detection of significant associations between circulating fetuin-A and indices of obesity across the relatively narrow range of BMI of our study. Similarly, Himmetoglu et al found that although circulating fetuin-A was higher in morbidly obese patients compared with lean or overweight con-trols, it was not correlated with BMI in the subgroup of morbidly obese individuals.21 Moreover, the small
number and the heterogeneity of the participants of our study may have further contributed to the absence of any association between circulating fetuin-A and indices of obesity. The positive association of circulat-ing fetuin-A with BMI has been reported in studies with at least an 8 times greater number of participants compared with our study. The previously reported positive association of circulating fetuin-A levels with BMI is possibly causal, as indicated by the fact that mice null for the fetuin-A gene had lower BW and were more resistant to weight gain after a high-fat diet compared with wild type mice.22,23
The present study showed that serum fetuin-A levels did not change after 6 months of weight loss following bariatric surgery. This finding is consistent with the results of the study of Kahraman et al.18 Two other
studies evaluated the changes in circulating fetuin-A at least 12 months after bariatric surgery.14,15 These
studies found a decrease in serum fetuin-A levels at least 12 months after bariatric surgery.14,15 However, the
abovementioned 3 studies did not perform an analysis of body composition. Interestingly, the change in circulating fetuin-A tended to be positively correlated with the change in LBM in our study, implying that a more negative nitrogen balance associated with a greater loss of LBM may downregulate the production of glycoprotein fetuin-A by the liver. Furthermore, the present study found that serum fetuin-A levels were negatively correlated with both serum globulins and CrP at baseline as well as 6 months after bariatric surgery. Weight loss is known to reduce CrP, pos-sibly indicating a decrease in adipose tissue-induced inflammation.24 In this context, the downregulation of
positive acute phase reactants after weight reduction is expected to be accompanied by an upregulation of circulating fetuin-A, which, as mentioned above,
Table 4. Multiple linear regression analysis with the change in circulating fetuin-A as dependent variable Dependent variable Independent
variables Standardized β coefficient independent variablep value for each Adjusted R 2
for the model for the modelp value
Change in fetuin-A Change in TG 0.499 0.030 0.271 0.066 Change in CrP 0.045 0.824
Change in globulins - 0.271 0.212 Change in LBM 0.102 0.614
is a negative acute phase reactant.1 Consistently,
a smaller reduction of both serum globulins and CrP after bariatric surgery predicted a decrease in circulating fetuin-A in our study. The serum levels of globulins in our study possibly reflect the obesity-related low-grade inflammation, as indicated by the value of CrP. Hence, the property of fetuin-A as a negative acute phase reactant may have hindered the demonstration of a decrease in circulating fetuin-A after bariatric surgery in our study. This furnishes a plausible explanation for the absence of a decrease in circulating fetuin-A in the whole population of the present study. These considerations should be taken into account in the design of future studies investigat-ing the metabolic role of fetuin-A, as well as in the interpretation of their results.
We found that among patients with BMI ≥35 kg/ m2 serum fetuin-A levels did not differ between those
with MetS and those without MetS. The majority of studies have shown circulating fetuin-A to be upregu-lated in the presence of MetS among individuals with a wide range of BMI.6,9,25,26 However, the comparison
between individuals with MetS and no MetS appears to be influenced by obesity.27 Indeed, patients with BMI
≥35 kg/m2 always fulfill the WC criteria of MetS, as
demonstrated in our study.27,28 The latter individuals
need to fulfill only 2 criteria of the remaining 4 to be diagnosed with MetS, lowering the threshold for the diagnosis of MetS in these patients and thus limiting the differences between the subjects with MetS and patients without MetS.27 In this context, circulating
fetuin-A may not have enough power to discrimi-nate between MetS and non-MetS in patients with BMI ≥35 kg/m2. Importantly, increased TG was the
only component of MetS that was determined in our study by circulating fetuin-A at baseline, as well as 6 months after bariatric surgery. Indeed, increased TG appears to be the component of MetS with the most consistent association with serum fetuin-A levels in a steady metabolic state.6,29
Our study demonstrated a positive relationship between serum levels of fetuin-A and TG at baseline as well as 6 months after bariatric surgery. Likewise, in the majority of studies serum TG levels have been reported to increase with increasing serum fetuin-A levels in a steady metabolic state.6,30-32 Furthermore,
a fall in serum fetuin-A levels has been shown after
administration of TG-lowering medications, such as fenofibrate, n-3 polyunsaturated fatty acids and niacin.33-35 Kaushik et al reported that the
niacin-induced change in circulating fetuin-A was positively correlated with the change in TG.35 However, the
relationship of the change in circulating fetuin-A with the change in TG during a weight loss intervention has not been previously investigated. The relation-ship between fetuin-A and TG is possibly causal, as indicated by the reported acceleration of exogenous fatty acid incorporation into cellular TG by fetuin-A.36
Further studies are needed to confirm the presumed fetuin-A-induced upregulation of TG and elucidate the specific underlying mechanisms. Importantly, our study found for the first time that circulating fetuin-A was the only independent predictor of serum TG at baseline, implying a possible important role of fetuin-A in upregulating serum TG independently of all the traditional metabolic factors.
The current study found that circulating fetuin-A was positively correlated with non-HDL-C at baseline and the change in circulating fetuin-A tended to be positively correlated with the change in non-HDL-C after 6 months of follow-up. With regard to the relationship between serum levels of fetuin-A and LDL-C, a positive association was demonstrated only at baseline, but not during the 6 months of follow-up. The fact that a few patients were taking statins may have contributed to these negative results. A positive relationship of serum fetuin-A levels with both LDL-C and non-HDL-LDL-C has previously been shown in a steady metabolic state.6,30,31,37 However, the evaluation
of the associations between the change in circulating fetuin-A and the changes in LDL-C and non-HDL-C during an intervention has not been performed before. The data of our study indicate the possible existence of a link between fetuin-A and the metabolism of ApoB-containing lipoproteins. This issue requires further investigation.
The results of our study should be interpreted in light of some limitations. Firstly, the small number of patients will have decreased the possibility of de-tecting significant changes in serum fetuin-A levels during follow-up, as well as significant associations of serum fetuin-A levels with metabolic parameters. This was true especially regarding subgroup analysis. Secondly, the study population was heterogeneous,
Am J Epidemiol 185: 54-64.
6. Xu Y, Xu M, Bi Y, et al, 2011 Serum fetuin-A is cor-related with metabolic syndrome in middle-aged and elderly Chinese. Atherosclerosis 216: 180-186. 7. Yin L, Cai WJ, Chang XY, et al, 2014 Association
be-tween fetuin-A levels with insulin resistance and carotid intima-media thickness in patients with new-onset type 2 diabetes mellitus. Biomed rep 2: 839-842.
8. Ou HY, Yang YC, Wu HT, Wu JS, Lu FH, Chang CJ, 2012 Increased fetuin-A concentrations in impaired glucose tolerance with or without nonalcoholic fatty liver disease, but not impaired fasting glucose. J Clin Endocrinol Metab 97: 4717-4723.
9. Ismail NA, ragab S, El Dayem SM, et al, 2012 Fetuin-A levels in obesity: differences in relation to metabolic syndrome and correlation with clinical and laboratory variables. Arch Med Sci 8: 826-833.
10. Choi KM, Han KA, Ahn HJ, et al, 2013 The effects of caloric restriction on fetuin-A and cardiovascular risk factors in rats and humans: a randomized controlled trial. Clin Endocrinol (Oxf) 79: 356-363.
11. Blüher M, rudich A, Klöting N, et al, 2012 Two pat-terns of adipokine and other biomarker dynamics in a long-term weight loss intervention. Diabetes Care 35: 342-349.
12. Chan DC, Watts GF, Gan SK, Ooi EM, Barrett PH, 2010 Effect of ezetimibe on hepatic fat, inflammatory markers, and apolipoprotein B-100 kinetics in insulin-resistant obese subjects on a weight loss diet. Diabetes Care 33: 1134-1139.
13. reinehr T, roth CL, 2008 Fetuin-A and its relation to metabolic syndrome and fatty liver disease in obese children before and after weight loss. J Clin Endocrinol Metab 93: 4479-4485.
14. Brix JM, Stingl H, Höllerl F, Schernthaner GH, Kopp HP, Schernthaner G, 2010 Elevated Fetuin-A concentra-tions in morbid obesity decrease after dramatic weight loss. J Clin Endocrinol Metab 95: 4877-4881.
15. Yang PJ, Ser KH, Lin MT, et al, 2015 Diabetes As-sociated Markers After Bariatric Surgery: Fetuin-A, but Not Matrix Metalloproteinase-7, Is reduced. Obes Surg 25: 2328-2334.
16. König D, Zdzieblik D, Deibert P, Berg A, Gollhofer A, Büchert M, 2015 Internal Fat and Cardiometabolic risk Factors Following a Meal-replacement regimen vs Comprehensive Lifestyle Changes in Obese Subjects. Nutrients 7: 9825-9833.
17. Pournaras DJ, Le roux CW, 2009 The effect of bariatric surgery on gut hormones that alter appetite. Diabetes Metab 35(6 Pt 2): 508-512.
18. Kahraman A, Sowa JP, Schlattjan M, et al, 2013 Fetuin-A mrNA expression is elevated in NASH compared with NAFL patients. Clin Sci (Lond) 125: 391-400. 19. Tamboli rA, Hossain HA, Marks PA, et al, 2010 Body
composition and energy metabolism following roux-en-Y gastric bypass surgery. Obesity (Silver Spring)
including patients with diabetes taking antidiabetic medications, individuals with arterial hypertension and patients taking lipid-lowering drugs, all these being situations that may have influenced serum fetuin-A levels. However, these relationships did not change when a subgroup analysis was performed exclud-ing those takexclud-ing lipid-lowerexclud-ing drugs. Thirdly, the BIA that was used to measure parameters of body composition, though an acceptable method, is not the gold standard. Moreover, we did not assess liver histology to determine if there was a relationship of fetuin-A with nonalcoholic liver disease. Fifthly, our study did not include a control group of healthy lean individuals to compare fetuin-A between the obese patients and the control group.
CONCLUSIONS
The current study found that serum fetuin-A levels independently predicted serum triglycerides before as well as during the first 6 months following bariatric surgery. Further well-designed studies are needed to confirm these results and investigate whether the relationship between fetuin-A and triglyceride me-tabolism is causal in humans.
CONFLICT OF INTEREST STATEMENT
The authors declare that they have no conflict of interest.
REFERENCES
1. Dabrowska AM, Tarach JS, Wojtysiak-Duma B, Duma D, 2015 Fetuin-A (AHSG) and its usefulness in clinical practice. review of the literature. Biomed Pap Med Fac Univ Palacky Olomouc Czech repub 159: 352-359. 2. Maréchal C, Schlieper G, Nguyen P, et al, 2011 Serum
fetuin-A levels are associated with vascular calcifications and predict cardiovascular events in renal transplant recipients. Clin J Am Soc Nephrol 6: 974-985. 3. Mathews ST, Srinivas Pr, Leon MA, Grunberger G,
1997 Bovine fetuin is an inhibitor of insulin receptor tyrosine kinase. Life Sci. 61: 1583-1592.
4. Song A, Xu M, Bi Y, et al, 2011 Serum fetuin-A as-sociates with type 2 diabetes and insulin resistance in Chinese adults. PLoS One 6: e19228.
5. Aroner SA, Mukamal KJ, St-Jules DE, et al, 2017 Fetuin-A and risk of Diabetes Independent of Liver Fat Content: The Multi-Ethnic Study of Atherosclerosis.
18: 1718-1724.
20. Carey DG, Pliego GJ, raymond rL, 2006 Body composi-tion and metabolic changes following bariatric surgery: effects on fat mass, lean mass and basal metabolic rate: six months to one-year follow-up. Obes Surg 16: 1602-1608.
21. Himmetoglu S, Teksoz S, Zengin K, Yesim T, Taskın M, Dincer Y, 2013 Serum levels of fetuin A and 8-hy-droxydeoxyguanosine in morbidly obese subjects. Exp Clin Endocrinol Diabetes 121: 505-508.
22. Mathews ST, rakhade S, Zhou X, Parker GC, Coscina DV, Grunberger G, 2006 Fetuin-null mice are protected against obesity and insulin resistance associated with aging. Biochem Biophys res Commun 350: 437-443. 23. Mathews ST, Singh GP, ranalletta M, et al, 2002 Im-proved insulin sensitivity and resistance to weight gain in mice null for the Ahsg gene. Diabetes 51: 2450-2458. 24. Selvin E, Paynter NP, Erlinger TP, 2007 The effect of
weight loss on C-reactive protein: a systematic review. Arch Intern Med 167: 31-39.
25. Obuchi A, Adachi H, Enomoto M, et al, 2014 High plasma fetuin-A levels are associated with metabolic syndrome among males but not females in a Japanese general population. Diabetes res Clin Pract 106: 128-135.
26. Kaess BM, Enserro DM, McManus DD, et al, 2012 Cardiometabolic correlates and heritability of fetuin-A, retinol-binding protein 4, and fatty-acid binding protein 4 in the Framingham Heart Study. J Clin Endocrinol Metab 97: E 1943-1947.
27. Tinahones FJ, Garrido-Sánchez L, Murri M, García-Fuentes E, Cardona F, 2013 Particular characteristics of the metabolic syndrome in patients with morbid obesity. Endocrinol Nutr 60: 127-135.
28. Jensen MD, ryan DH, Apovian CM, et al, 2014 2013 AHA/ACC/TOS guideline for the management of over-weight and obesity in adults: a report of the American College of Cardiology/American Heart Association Task
Force on Practice Guidelines and The Obesity Society. Circulation 129: 25 Suppl 2: 102-138.
29. roos M, von Eynatten M, Heemann U, rothenbacher D, Brenner H, Breitling LP, 2010 Serum fetuin-A, car-diovascular risk factors, and six-year follow-up outcome in patients with coronary heart disease. Am J Cardiol 105: 1666-1672.
30. Yin L, Cai WJ, Zhu LY, et al, 2015 Association of plasma Fetuin-A and clinical characteristics in patients with new-onset type 2 diabetes mellitus. Int J Clin Exp Med 8: 991-999.
31. Ix JH, Shlipak MG, Brandenburg VM, Ali S, Ketteler M, Whooley MA, 2006 Association between human fetuin-A and the metabolic syndrome: data from the Heart and Soul Study. Circulation. 113: 1760-1677. 32. Liu A, Lamendola C, Ariel D, et al, 2015 Usefulness
of fetuin-A to predict risk for cardiovascular disease among patients with obstructive sleep apnea. Am J Cardiol 116: 219-224.
33. Noureldein MH, Abd El-razek rS, El-Hefnawy MH, El-Mesallamy HO, 2015 Fenofibrate reduces inflam-mation in obese patients with or without type 2 diabetes mellitus via sirtuin 1/fetuin A axis. Diabetes Res Clin Pract 109: 513-520.
34. Ozyazgan S, Karaoglu K, Kurt A, et al, 2013 Effects of omega-3 polyunsaturated fatty acid supplementation on serum fetuin-A levels in type 2 diabetic patients. Minerva Med 104: 287-293.
35. Kaushik SV, Plaisance EP, Kim T, et al, 2009 Extended-release niacin decreases serum fetuin-A concentrations in individuals with metabolic syndrome. Diabetes Metab res rev 25: 427-434.
36. Cayatte AJ, Kumbla L, Subbiah MT, 1990 Marked accel-eration of exogenous fatty acid incorporation into cellular triglycerides by fetuin. J Biol Chem 265: 5883-5888. 37. Ishibashi A, Ikeda Y, Ohguro T, et al, 2010 Serum
fetuin-A is an independent marker of insulin resistance in Japanese men. J Atheroscler Thromb 17: 925-933.