1. INTRODUCTION
Current European and American specifications for low tem-perature cracking resistance of asphalt binders are based on empirical tests (e. g. FRAASS test) or tests involving linear viscoelasticity (e. g. creep or complex modulus). However, although these standard criteria to differentiate low tem-perature cracking behavior may work for pure asphalt, they cannot be applied to all asphalt binders. For example, add-ing polymer (which has good compatibility with asphalt) gives a strong increase in binder’s low temperature proper-ties reproduced in field conditions, yet there is still poor variation in binder stiffness obtained by the Bending Beam Rheometer (BBR) tests in accordance with AASHTO T 313-02.
In this context, the standard criteria (temperature at which the material’s secant modulus – S – equals 300 MPa or temperature at which the creep rate – m – equals 0.3) cannot differentiate pure and modified asphalt binders,
1 Lucas Feitosa de A. L. Babadopulos, Centre de Recherche de Solaize de TOTAL, France. (e-mail: [email protected]).
2 Malo Le Guern, Laboratoire Central des Ponts et Chaussées, France. (e-mail: [email protected]).
3 Emmanuel Chailleux, Laboratoire Central des Ponts et Chaussées, Fran-ce. (e-mail: [email protected]).
4 Sylvia Dreessen, Centre de Recherche de Solaize de TOTAL, France. (e-mail: [email protected]).
Manuscrito recebido em 25/4/2011 e aprovado para publicação em 26/7/2011. Este artigo é parte de TRANSPORTES v.19, n.2, 2011. ISSN: 2237-1346
(online).
prompting analysts to turn to a test based on the principles of fracture mechanics. For that, a fracture strength test (three points bending test – TPBT), which allows to work in localized large deformations, was adapted to asphalt binders and developed by Lee and Hesp (1994), Morrison et al. (1994) and Ponniah and Hesp (1996). Research by those authors shows that it is possible to better describe the cracking resistance of asphalt binders by obtaining intrinsic characteristics such as fracture toughness (KIC) or critical strain energy release rate (GIC). These researches have used linear elastic fracture mechanics principles, where the as-phalt, at low temperature, is considered as a brittle, elastic material. However, while this assumption may well appear valid at very low temperatures (under -20°C), it is impor-tant to take into account asphalt viscoelasticity when higher temperatures (near 0°C) are involved, especially during ductile-to-brittle transition.
The study reported here proposes to simulate BBR tests using data from complex modulus to obtain BBR critical temperatures using the theory of linear viscoelasticity. Al-so, this papers aims to introduce the concept of viscoelas-ticity in the analysis of TPBT by distinguishing stress in-tensity (K) and crack opening (Kε) factors. A procedure based on the finite element method is used to determine these two material properties obtained using the fracture mechanics theory and using data from TPBT on pre-notched asphalt beams. In order to test the hypothesis that BBR critical temperatures can be obtained theoretically from complex modulus data and to compare BBR specifica-tions with the proposed fracture mechanics criteria,
differ-Low temperature specifications for asphalt binders:
tests and simulation
Lucas Feitosa de A. L. Babadopulos1, Malo Le Guern2, Emmanuel Chailleux3 e Sylvia Dreessen4
Resumo: Este trabalho apresenta uma comparação entre dois métodos de determinação de desempenho quanto à fissuração a baixa temperatura para asfaltos: 1) Bending Beam Rheometer (BBR), baseado na reologia do ligante e 2) alternativa baseada na mecânica da fratura utilizando-se um ensaio de flexão três pontos (F3P). A relação teórica entre elas foi analisada e testes foram simulados com o auxílio da teoria da viscoelasticidade linear. Dados de módulo complexo foram utilizados para se determinar uma série de Prony repre-sentando o comportamento mecânico dos materiais. Oito diferentes ligantes asfálticos e os materiais resultantes de envelhecimento em laboratório foram testados. O coeficiente de determinação (R2) entre as temperaturas limite BBR simuladas e experimentais se situa en-tre 0,82 e 0,92. Por meio do ensaio de F3P, calculou-se a tenacidade dos materiais e um segundo parâmetro, baseado no campo de de-formação, foi proposto. Os critérios de ruptura puderam diferenciar o comportamento de fissuração a frio dos asfaltos. As classifica-ções obtidas através dos dois métodos foram comparadas, de forma que o critério reológico e o baseado no ensaio de fratura ordenam ligantes diferentemente.
Palavras-chave: fissuração a baixa temperatura, viscoelasticidade linear, Bending Beam Rheometer, ensaio de flexão três pontos.
Abstract: This paper presents a comparison between two methods to determine low temperature crack performance for asphalt bind-ers: 1) the Bending Beam Rheometer (BBR), which is a rheology-based method, and 2) alternative fracture mechanics-based criteria obtained using a three points bending test (TPBT). The theoretical relation between them was analyzed and tests were simulated using the theory of linear viscoelasticity. Complex modulus data were used to determine Prony series representing materials’ mechanical be-havior. Eight different asphalt binders and the materials resulting from their aging process in laboratory were tested. The determination coefficient (R2) between the simulated BBR limit temperatures and the experimental ones was between 0.82 and 0.92. For the TPBT the fracture toughness was determined and a deformation intensity factor was proposed. The fracture criteria could differentiate binder performance. The ranking obtained for the two methods was compared. The rheology-based and the fracture mechanics-based criteria rank asphalt binders differently.
ent asphalt binders were tested in three points bending at temperatures between -5°C and -15°C and compared to the critical temperatures obtained for BBR tests.
2. EXPERIMENTAL DESIGN
2.1. Asphalt Binders
Eight different asphalt binders were used in this study. These asphalts were selected according to the origin of the crude petroleum, the manufacturing process, and the type of modifiers used. Three direct-distilled asphalts of different origins (B1, B2 and B3) and a semi-blown asphalt (B4) with the same 35/50 penetration (standard NF EN 12591) were used. B1 asphalt was modified using four types of additives: Sasobit® paraffin wax (B
M1), polyphosphoric acid at 105-118% (BM2), crosslinker-free SBS polymer (BM3) and crosslinked SBS polymer (BM4).
Aged materials were obtained from the eight previously presented asphalt binders by a process idealized by Migliori and Corté (1998). Those authors have shown that the com-monly used laboratory procedures to induce aging (1h in rolling thin film oven test - RTFOT - and 20h in paving ag-ing vessel - PAV) produce physical effects, e. g. increase in asphaltenes content and in the rigidity obtained in BBR and complex modulus tests, equivalent to those obtained when conducting aging for 25h in PAV. So, aging process used in this work was to maintain materials at 100°C and 2.1MPa during 24h.
2.2. Measurement of complex modulus
Asphalt is a viscoelastic material, so its properties are de-pendent on its thermal and loading histories. The complex modulus test determines intrinsic characteristics of asphalt materials under small deformation conditions (complex modulus, phase difference). The complex modulus tests were performed applying a controlled strain ε*(t,ω,θ) (time, frequency, temperature) to a test specimen and recording the stress response σ*(t,ω,θ) under different temperatures and frequencies. Depending on the temperature, the test is performed in tensile–compression (≤ 20°C) or annular shear (≥ 20°C).
2.3. Bending Beam Rheometer
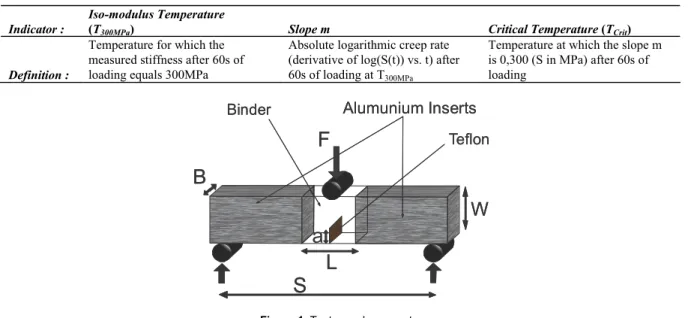
The Bending Beam Rheometer (BBR) is a tool to perform low-temperature creep tests. Tests are carried out at differ-ent temperatures (-24, -18 and -12°C) (AASHTO T 313-02). Asphalt beams are prepared in an aluminum mold with 24 hours of storage for each sample. The beams are im-mersed in a cold bath. After one hour at the test tempera-ture, a constant load equivalent to 100 g is applied for 240 seconds to the prismatic beam supported at both ends by stainless steel cylinders (set 102 mm apart). Center point deflection is measured continuously. By using a linear in-terpolation, these tests give a measure of creep stiffness at any moment and any temperature. Different parameters can be calculated with BBR results and their definition is indi-cated in Table 1.
2.4. Three Points Bending Test (TPBT)
For this research the TPBT on pre-notched asphalt beam was adapted to bituminous binders. The test specimen was a piece of pre-notched asphalt extended by two aluminum extender inserts (Figure 1). The aluminum inserts were em-ployed to reduce the quantity of asphalt and make the bot-tom supports less sensitive to the indentation phenomenon (Chailleux et al., 2008). The same authors have shown that the inserts presence may influence the mechanical fields at the pit of the notch, but for L longer than 40mm, the alumi-num extenders had no mechanical influence around the crack.
The test samples were produced by molding at 150°C around two 25 µm-thick Teflon sheets bonded with mineral grease to form a reproducible pre-notch. Before adding the asphalt, the film is tightened to produce a pre-notch as straight as possible and thus trigger mode I fracture (open-ing).
The test was conducted with a rate displacement of 0.6mm/min. A Zwick tensile–compression tester machine was used. The test was conducted in a potassium acetate bath able to carry the test temperature down to -30°C. Indicator : (T300MPa) Slope m Critical Temperature (TCrit) Definition :
Temperature for which the measured stiffness after 60s of loading equals 300MPa
Absolute logarithmic creep rate (derivative of log(S(t)) vs. t) after 60s of loading at T300MPa
Temperature at which the slope m is 0,300 (S in MPa) after 60s of loading
F
Alumunium Inserts
BinderB
W
S
L
TeflonF
Alumunium Inserts
BinderB
W
S
L
Teflona
3. NOTIONS OF FRACTURE MECHANICS AND LINEAR VISCOELASTICITY
3.1. Determination of S(t) for BBR tests
To simulate BBR tests, one needs to obtain analytical ex-pressions representing linear viscoelastic mechanical be-havior. This can be done by using mechanical models fitted to experimental data. The model used in this paper is the classic generalized Maxwell model. The relaxation curve obtained for this model can be mathematically expressed in Prony series terms:
n i t ie i E E t t E 1 ) / ( 0 . ) ( ) ( , for t > 0 (1)The Maxwell model parameters were obtained using a non-linear optimization of the Cost function (square differ-ences between model prediction and test result) defined for the Complex Modulus master curve as described by Ham-moum et al. (2009). The computation of Maxwell model prediction is done by Equations 2 and 3.
n i i i i E E E 2 2 0 ) ( 1 ) ( 1 (2)
n i i i i E E 2 ) ( 1 ) ( 2 (3)Knowing the relaxation curve makes it possible to dis-tinguish stress history from strain history using the viscoe-lastic constitutive law described by the convolution inte-gral:
t du u u t E t 0 ) ( ) ( (4)Equation 2 is calculated numerically running a discretiz-ing step with respect to the time considered, i.e. t = [t1,… tk …,tN] , (t)=[ 1(t1),…k(tk)…N(tN)] and (t) = [ 1(t1), …k(tk)…N(tN)]. Equation 4, discretized in time steps ti, gives an approximation in the following form:
ik k i i k i t t k i k E t u u a t i i
1 1 1 ) ( ) ( (5)in which the aik values are calculated as follows:
i i i i t t t t m j j k j k ik u u t E E u u t E a 1 1 ) ) ) ( exp( ( ) ( 1 0 (6) )) exp( ) (exp( ) ( 1 1 1 0 j k i j k i m j j j i i ik t t t t E t t E a
(7)It is then necessary to verify that this new numerical im-plementation fits the measured values from which the model was derived (see Figure 2).
In order to obtain the strain history from the stresses, the following recursive principle is used:
11 1 1 a (8) kk k i ik i k k a a
1 1 . (9) k k k k k t t 1 ( 1 ) (10)Then, one can obtain the numerically calculated secant modulus: k k k S (11)
3.2. Determination of stress and crack opening intensity factors
Given that the three points bending fracture test is con-ducted in mode I (opening), the equations and calculations used in this paper are only valid for mode-I cracking.
3.2.1. Key principles in fracture mechanics
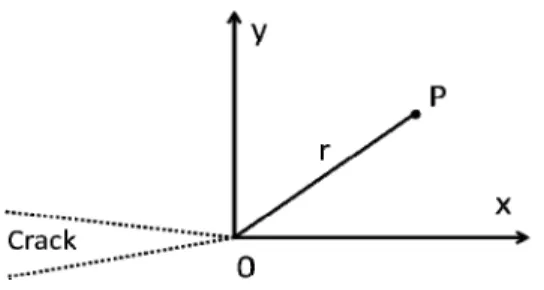
In the context of linear elastic fracture mechanics, the stress and displacement fields at the crack tip in elastic media can be described by a single parameter that is intrinsic to the material: the stress intensity factor (equations 12 and 13).
Figure 3 illustrates a planar coordinate system used to de-scribe stress and displacement fields around a crack tip. The stress intensity factor can be calculated from either the crack opening or the stress field at the crack tip. The next section proposes an application of this theory to a viscoe-lastic material. 2 3 sin 2 sin 1 2 cos 2 r K yy (12) 2 cos 2 1 2 sin 2 ) 1 ( 2 r E K uy (13) where,
yy: crack opening stress;
y
u : crack opening strain; : Poisson’s ratio;
E: Young’s modulus;
34 in planar deformation and
) 1 /( ) 3 ( in planar stress.
3.2.2. Stress intensity factor in viscoelasticity
In this section, the expression of the stress intensity factor Kσ(t) is determined for a linear viscoelastic material at con-stant Poisson’s ratio under force F(t) and displacement d(t). Ke is the stress intensity factor and Re is the geometric stiffness of an elastic material at unit displacement de=1 and unit Young’s modulus Ee=1. The stress and displacement fields in the vicinity of the crack under these conditions are written: e(x)fgén(x)Ke (14) e e x g x K u ( ) gén( ) (15) where,
fgen: ‘generic form’ functions of the stress; e
ggen: displacement distributions at the crack base.
The stress and displacement fields in the vicinity of the crack under identical geometry but for a viscoelastic mate-rial can be written:
e e R t F x t x, ) ( ) () ( (16) ) ( ) ( ) , (xt u x d t u e (17)
Introducing secant modulus, S(t)=(t)/ε(t), it gives:
) ( ) ( ) (t R S t d t F e (18)
This leads to:
e e R t F K x f t x gén ) ( ) ( ) , ( (19) ) ( ) ( ) ( ) , ( t S R t F K x g t x u e e gén (20)
The expression of the stress and displacement fields in the vicinity of a crack in a viscoelastic material is therefore:
) ( ) ( ) , (x t fgén x K t (21) ) ( ) ( ) ( ) , ( t S t K x g t x u gén (22) ) ( ) ( ) ( ) ( Ft K S td t R K t K e e e (23)
It thus appears that Kσ(t) can be calculated from K eσ and the resulting force, as well as from Keε and the displace-ment, although in the latter case, the secant modulus S(t) has to be known. Section 3.2.4 describes a finite elements calculation method for determining Ke.
3.2.3. Crack opening intensity factor (Kε)
Viscoelastic materials do not present direct proportionality between force applied and form of the crack front. In addi-tion to describing the stress field at the crack base, K(t), it is also useful to find a purely geometric criterion describing crack form. Therefore, the idea of crack opening intensity factor Kε(t), as previously proposed in Chazal and Dubois (2001) and Dubois and Petit (2005), is used (equation 24). These authors assert that it is possible to determine the strain energy release rate, G(t), of a viscoelastic material (equation 25) from K and Kε.
) ( 2 ) (t r K t uy (24) 8 ) ( ) ( ) (t K t K t G (25)
As the test is conducted at set rate displacement speed, the crack form is known at every moment. This means that Kε(t) can be calculated from d(t) according to equation 26.
) ( )
(t K d t
K e (26)
3.2.4. Finite element method for determining intensity fac-tors Ke and Keε
Equations 12 and 13 are only the first term of a Taylor se-ries. The displacement fields can more generally be written as in equations 27 and 28.
r g r E K r uy y 1 2 ) 1 ( ) ( (27)
r K r r uy 2 ) ( (28)Consequently, the term ( r) has to be integrated as soon as the displacement field is calculated far from the crack tip. Therefore, a calculation integrating a larger zone around the crack tip needs to include the first order term. For a calculation running along the crack plane (θ = π), this gives equations 29 and 30 (Chailleux et al., 2006).
2 / 3 2 2 2 ) ( x A x E K x uy (29) 2 / 3 3 2 2 ) (x K x A x uy (30)
Working with a finite elements method numerical simu-lation of the TPBT, displacement uy of the crack mouth is calculated theoretically for a deflection d=1m and a mod-ulus E=1Pa. It thus becomes apparent that equations 29 and 30 are equivalent and that Ke and Keε are equal. This
means that only one of these two parameters, i.e. Keσ, needs to be determined by finite elements calculus. Then, the Keσ coefficient can thus be reverse-analyzed by deducing the adjustment to the analytical formula for uy on the numerical calculation of this same displacement field.
3.2.4.1.Numerical simulation of the three points bending test
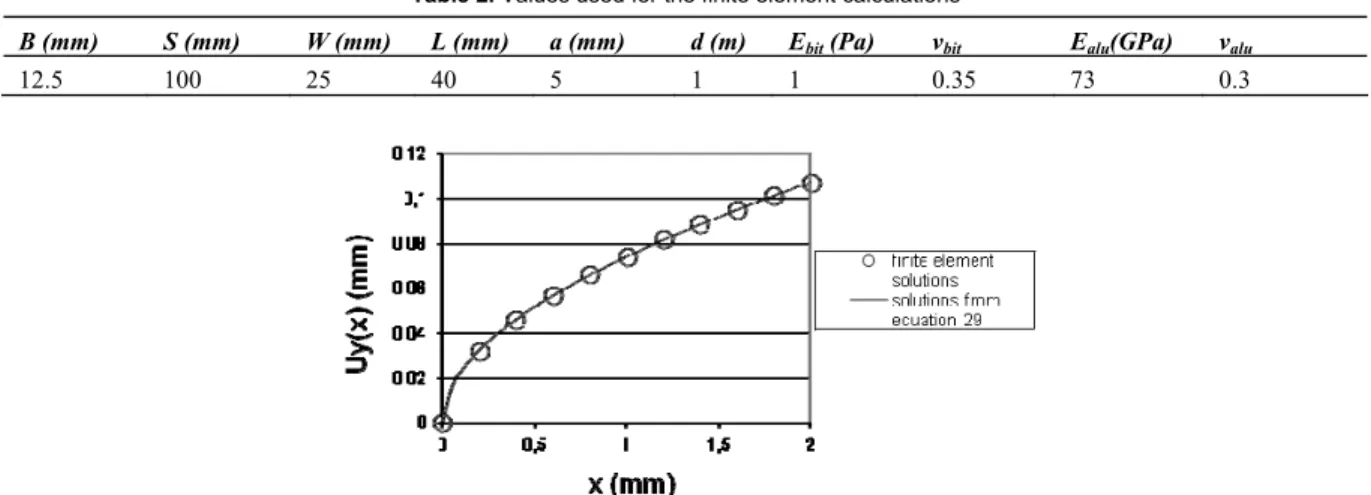
This study used two finite element codes: CESAR-LCPC and Cast3M. Given that the structure is symmetrical, only half the test specimen was modeled. The calculations are performed in planar stress conditions. The sample matrix is finer-grained around the crack (and different for the two codes). Boundary conditions are simulated by barring hori-zontal displacement of nodes situated along the axial sym-metries above the crack and barring vertical displacement of the node corresponding to the sample support surface. Top-die displacement is modeled via a set displacement value on the node situated under the die. The properties of the two materials used for the finite element calculation are given in Table 2.
3.2.4.2.Determination of Keσ by reverse analysis
Kσ and A
2 in equation 29 are determined by adjusting the analytical formulation of the finite-elements numerical re-sults. This is achieved by selecting a 2mm zone leading from the crack tip and determining the parameters via an optimization procedure based on the least squares method. As illustrated in Figure 4, the analytical solution matches the solution obtained by finite element analysis. Then it be-comes possible to determine the Re parameter of equation 23 (Table 3).
4. RESULTS
Finite elements modeling was used to determine the mathe-matical expression of stress intensity and crack opening in-tensity factors for a viscoelastic material under set rate forced displacement conditions. The results obtained (stress at fracture, elongation at fracture) make it possible to
calcu-Table 2. Values used for the finite element calculations
B (mm) S (mm) W (mm) L (mm) a (mm) d (m) Ebit (Pa) νbit Ealu(GPa) νalu
12.5 100 25 40 5 1 1 0.35 73 0.3
Figure 4. Displacement of the crack mouth under loading. Analytical solution (equation 29) and numerical solution (CESAR–LCPC)
Table 3. Values obtained for the finite element calculations
CESAR–LCPC Cast3m (SIF modulus)
Keσ (m-0.5) 1.4426 1.4570 Re (m) 0.635 10-3 0.640 10-3
tors are means of three tests of three points bending. 4.1. BBR Modeling and Comparison to Experimental
Results
By the method described in section 3.1, it is possible to si-mulate BBR tests and to calculate the sisi-mulated indicators described in section 2.3. based on the Maxwell model fit to complex modulus data. Experimental and modeled results for all asphalt binders and their aged products are shown in Figures 5 and 6. Despite the mean difference between model prediction and experimental results (2.6°C for T300MPa and 1.1°C for TCrit), the determination coefficients obtained between them were high, as it can be seen in
Fig-4.2. Results of the Three Points Bending Test
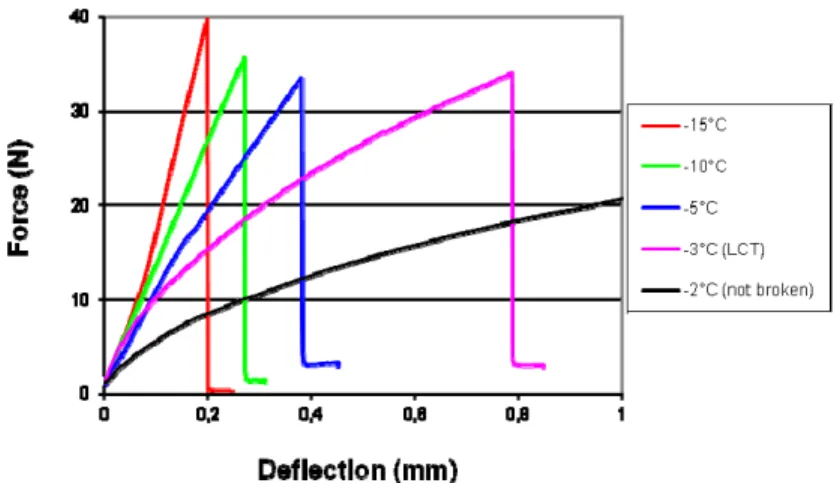
For all asphalts of the study, their behavior (stress, elonga-tion) changes between -15°C and -3°C. As an example, the time course of the Force = f(displacement) curve according to different temperatures for BM2 is plotted on Figure 7. It is to be noted that, for every asphalt binder, there is a limit cracking temperature (LCT). This implies that after a cer-tain temperature, which depends on the asphalt binder, there is no more cracking. This temperature is determined with an accuracy of 1°C. So, critical stress intensity factor, critical crack opening intensity factor and critical strain en-ergy release rate are determined between -15°C and their LCT.
Figure 5. Correlation between experimental and simulated BBR limit temperatures
Figure 6. Correlation between experimental and simulated BBR slope m
4.3. Calculation of the Critical Stress Intensity Factor (KC)
The critical stress intensity factor is first calculated from force at fracture (Figure 8). When temperature is close to -5°C, KC remains the same, regardless of asphalt type, al-though at the temperature of -15°C, this critical stress in-tensity factor appears to be highly dependent on the type of asphalt. It has to be noted that B4 and BM4 have the lowest LCTs (-8°C) and seem to have a cracking behavior differ-ent from the others.
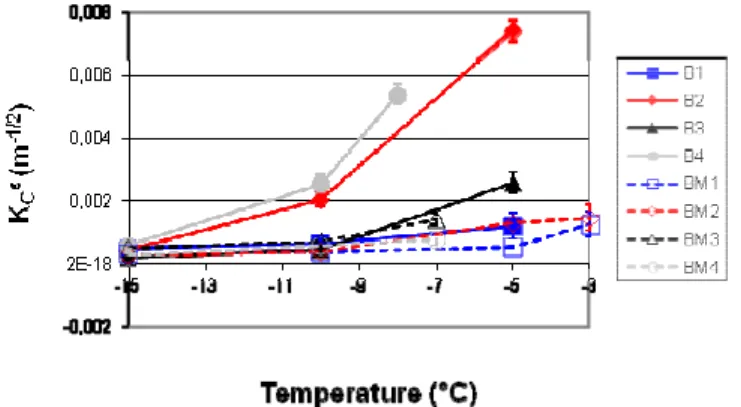
4.4. Calculation of the Critical Crack Opening Intensity Factor (KCε)
Figure 9 illustrates the KCε curves according to the tempera-ture for the asphalts studied. As temperatempera-ture increases, the critical crack opening intensity factor also increases. Note that in contrast to what happens to KC, KCε evolutions are monotonic regardless of the temperature. B4 and B3 have the highest KCε. No link can be found between KCε and LCT. Indeed, LCT values for BM3 and BM4 are between B4 and B3 whereas their KCε are lower than B4 and B3. 4.5. Calculation of Critical Strain Energy Release Rate
(GIC)
The critical strain energy release rate is calculated with equation 25 when time assumes the instant of rupture. Fig-ure 10 shows that GIC curves according to temperature fol-low the same pattern as KCε curves. This would appear logi-cal, given that the KCσ values for the test asphalts are
simi-lar within the temperature range studied.
5. DISCUSSION AND COMPARISON WITH BBR
LCT and GIC will be used together and compared to BBR critical temperature and Iso-modulus (300MPa) tempera-ture. The LCT will be considered as the main cracking characteristic obtained by three points bending. However, if some samples have the same limit cracking temperature, we will use GIC values in order to establish a ranking between asphalts.
Results from three points bending and bending beam rheometer are presented in Table 4. Ranking of asphalts binder are not similar for TPBT and BBR. Polymers modi-fied asphalts have a lower LCT than B2 with TPBT results but have a higher iso-modulus temperature and critical tem-perature than B2. Moreover, the crosslinked polymer modi-fied asphalt has a lower LCT than crosslinker-free contrary to results from BBR. It seems more logical that the use of a crosslinker improves asphalt resistance properties.
6. CONCLUSIONS
This study has established a framework for applying ture mechanics-based criteria to a three points bending frac-ture test on asphalt binders. The results show that stress and crack opening criteria are discriminatory factors across dif-ferent temperature ranges, regardless of the asphalts tested. BBR critical temperatures were almost the same (between
-Figure 8. Asphalt toughness curves according to temperature calculated via stress at fracture
16°C and -17°C) for the modified binders (BM2, BM3 and BM4) and for the original conventional one (BM1). Only BM1 had significantly different critical temperature, presenting, according to BBR, lower performance At low temperature, when the material is in a quasi-elastic state, the critical crack opening factor is constant (KCε2.10-4m-1/2). On the other hand, at a higher temperature, the critical crack open-ing factor runs from 2.10-4m-1/2 to 8.10-3m-1/2. In contrast, the critical stress intensity factor does not appear to depend on the asphalt type at high temperatures (KC8.104N.m -3/2), except for B4, and at low temperatures it runs from 6.104N.m-3/2 to 16.104N.m-3/2. The greater variability of K
Cε compared to KC means that the critical strain energy re-lease rates calculated using the Dubois formula (Dubois and Petit, 2005) appear to be discriminant at high tempera-tures. Moreover, a new criterion is introduced: the LCT which corresponds to the last temperature where there is crack propagation using the presented TPBT.
With the modeling procedure presented in this paper, BBR indicators (T300MPa, m-value and TCrit) can be obtained from complex modulus data (master curve) assuming a lin-ear viscoelastic model. Asphalt binders can be ranked using these criteria only simulating BBR tests with a model fitted to complex modulus data instead of performing those tests. This agrees with the results obtained by Olard (2009), who obtained creep compliance from complex modulus through empirical formulae.
BBR tests allow the estimation of low temperature speci-fications, but they are only based on materials’ linear vis-coelastic properties. Higher stiffness induces higher stresses in the material under loading, but this is not the only factor determining crack growth. This phenomenon is associated to material toughness. Concerning cracking re-sistance ranking, three points bending tests and bending beam rheometer give different results. Results with asphalt modified by crosslinked SBS and crosslinker-free SBS seem to show that limit cracking temperature is a reliable
property of low temperature asphalt cracking. ACKNOWLEDGEMENTS
The authors would like to thank the enterprise Total and the LCPC for their researching support and cooperation.
REFERENCES
AASHTO T 303 (2002) Standard test method for determining the flexural creep stiffness of asphalt binder using the Bending Beam Rheometer (BBR), T 313-02, American Association of State Highway and Transportation Officials, AASHTO, Washington D. C.
NF EN 12591 (1999) Bitumen and bituminous binders - Specifications for paving grade bitumen. European Standard. Bruxels.
Chailleux E.; D. Hamon and V. Mouillet (2006) Determination of the low temperature bitumen cracking properties: fracture mechanics principle applied to a three points bending test using a non-homogeneous Geometry, 10th International Conference on As-phalt Pavements, Québec, Canada, v. 1, p. 419–428.
Chailleux, E.; G. Ramond; C. Such and de la Roche, C. (2006) A mathe-matical-based master-curve construction method applied to com-plex modulus of bituminous materials. Road Materials and Pavement Design. EATA, p 75–92.
Chailleux E.; V. Mouillet; E. Scholten; T. Blomberg and S. Dreessen (2008) Evaluation of the three-point bending test as a tool to qual-ify the low-temperature behaviour of bituminous binder. Euras-phalt & Eurobitume congress, Copenhagen, Danemark. Chazal C. and F. Dubois (2001) A new incremental formulation in the time
domain of crack initiation in an orthotropic linearly viscoelastic solid, Mechanics of Time-Dependent Materials, v. 5, p. 3–21. Dubois F. and C. Petit (2005) Modeling of the crack growth initiation in
viscoelastic media by the Gθv-integral. Engineering Fracture Mechanics, v. 72, n. 18, p. 2821–2836.
Hammoum, F.; E. Chailleux; H-N. Nguyen; A. Erhlacher; J-M Piau and D. Bodin (2009) Experimental and Numerical Analysis of Crack Ini-tiation and Growth in Thin Film. Road Materials and Pavement Design. EATA, p. 39–61.
Lee N. K. and S. A. M. Hesp (1994) Low-temperature fracture toughness of polyethylene-modified asphalt binders. Transportation Re-search Record, v.1436, p. 54–59.
Migliori, F. and J-F Corté (1998) Comparative study of RTFOT and PAV Aging Simulation Laboratory Tests. Annual Meeting of the
Trans-Table 4. Comparison between three points bending and BBR results
Limit cracking temperature (°C) GIC (J.m-2) Iso-modulus (300MPa) temperature (°C) Critical temperature (°C)
B1 -5 9.9 -15.9 -16.2 B2 -5 81.6 -20.9 -20.8 B3 -5 25.0 -16.0 -17.3 B4 -8 99.7 -21.1 -18.3 BM1 -3 12.5 -13.9 -13.4 BM2 -3 12.8 -16.2 -16.5 BM3 -7 18.0 -17.7 -16.6 BM4 -8 8.4 -17.0 -16.5
portation Research Board No 77, Washington D. C., n. 1638, p. 56–63.
Morrison G. R., N. K. Lee and S. A. M. Hesp (1994) Chlorinated polyole-fins for asphalt binder modification. Journal of Applied Polymer Science, v. 54, p. 231–240.
Olard, F. (2009) Prédiction des résultats des tests de fluage BBR à partir des résultats de module complexe. Bulletin des Laboratoires des Ponts et Chaussées. n. 252-53, p. 3–15.
Ponniah J. E. and S. A. M. Hesp (1996) Use of fracture energy in perform-ance-based specifications of asphalt binders. Proceedings, Cana-dian Technical Asphalt Association, v. 41, p. 127–144.