43
Validation of the Hospitality Culture Scale in the context of hotel industry
Validação da Escala da Cultura da Hospitalidade no contexto da indústria da hotelaria
Adriana FernandesBusiness School of the ISCTE-IUL, Av. Das Forças Armadas, 1649-026, Lisboa, Portugal, [email protected]
Bráulio Alturas
Business School of the ISCTE-IUL, Av. Das Forças Armadas, 1649-026, Lisboa, Portugal, [email protected]
Raul Laureano
Business School of the ISCTE-IUL, Av. Das Forças Armadas, 1649-026, Lisboa, Portugal, [email protected]
Abstract
This study aims to validate the final factors for the Organizational Culture of the Hospitality Culture Scale which consists of the following four dimensions: management principles, customer relationships, job variety, and job satisfaction in the context of hotel industry organizations both in Brazil and Portugal. To this end, a confirmatory factor analysis (CFA) was performed, where two hundred and fifty-nine hotel industry professionals were rated. The presented results support a structure with three factors and eighteen items. It was concluded that the factor "job satisfaction" does not contribute to the formation of the Organizational Culture construct. It is understood that an appropriate Organizational Culture to the hospitality environment can make employees feel valued, which can impact job satisfaction, but job satisfaction cannot be considered part of the values shared by members of an organization.
Keywords: Organizational culture, hospitality culture, hotel industry,
confirmatory factor analysis.
Resumo
Este estudo tem como objetivo validar os fatores finais da Escala da Cultura da Hospitalidade, referente a Cultura Organizacional, composta pelas seguintes dimensões: princípios de gestão, relacionamento com clientes, variedade no trabalho e satisfação no trabalho, no contexto das organizações da indústria da hotelaria no Brasil e em Portugal. Para tal foi realizada uma Análise Fatorial Confirmatória (AFC) com duzentos e cinquenta e nove profissionais dessa indústria. Os resultados apresentados apoiam uma estrutura de com três fatores e dezoito itens. Concluiu-se que o fator “satisfação no trabalho” não contribui para a formação do construto Cultura Organizacional. Entende-se que uma Cultura Organizacional adequada ao ambiente da hospitalidade pode fazer com que os profissionais se sintam valorizados, o que pode impactar a satisfação no trabalho, entretanto a satisfação no trabalho não pode ser considerada parte dos valores compartilhados pelos membros de uma organização.
Palavras-chave: Cultura organizacional, cultura da hospitalidade,
indústria da hotelaria, análise fatorial confirmatória.
1. Introduction
The hospitality industry could be seen as the heart of the tourism industry (Claver-Cortés, Molina-Azorín, & Pereira-Moliner, 2006; Rogerson & Kotze, 2011; Kokt & Ramarumo, 2015). It consists of a wide range of service industries including hotels, food service, casinos, clubs and corporate events and tourism (Brotherton & Wood, 2008). In countries like Brazil and Portugal it represents a significant share of Gross Domestic Product (GDP), and contributes to creating jobs and stimulating the economy (Deng, 2011; Kokt & Ramarumo, 2015).
This industry has a unique and specific Organizational Culture (OC) that has been little studied in literature Dawson et al. (2011). It is well documented that a favourable OC creates an environment where employees feel valued and appreciated, moreover, it is what allows individuals to understand the behaviour patterns suitable and acceptable to the organization. In the hospitality industry, values and cultural characteristics also define how the employee delivers the principal product of this industry, hospitality, and it is this behaviour that will determine customer satisfaction (Dawson & Abbott, 2011). In this sense, studying, understanding and adapting the OC becomes essential to stimulate the appropriate employee behaviour, leading to improvement in their responsiveness
which in turn has a favourable impact on the organization's results (Asree, Zain, & Razalli, 2010; Kokt & Ramarumo, 2015). In addition, the study of the OC is associated with the establishment of competitive advantage, innovation, organizational performance, improvement of the organizational learning process and to facilitate the implementation of new technologies (Blomme, Van Rheede, & Tromp, 2010; Wang & Chen; 2013; Kokt & Ramarumo, 2015). But, to understand the relationship between the OC and the organizational results it is essential to study the instruments that measure these relationships and understand whether the instruments are actually able to measure the constructs and their relationships (Heritage, Pollock, & Roberts, 2014). Thus, the present study examines the validity of the OC measurement model proposed for Hospitality Culture Scale (HCS), developed by Dawson et al. (2011), in order to measure the characteristics and values of OC in the hospitality companies. The scale has not been validated in other studies and further study and development of the survey dimensions and items that make up the scale are necessary. Furthermore, Dawson et al. (2011) did not realize the construct validity, which is the attempt to reflect to what extent a measurement behaves in the same way as the target concept, compared with existing
44
measurements for other concepts (Hair, Black, Babin, & Anderson, 2010). In this study the convergent validity and discriminant validity are going to operationalize construct validity. As stated by Kokt and Ramarumo (2015), and as the authors of the scale suggest, more investigations are needed in the design and validation of a robust measure to gauge OC in the hospitality industry.In summary, this paper aims to deliver two main contributions to the literature on OC in hospitality industry. First a valid scale that reflects the theoretical complexity of the concept of OC, and second, a valid Portuguese version of the scale. Another important aspect of this study is the fact that it was operated in hotels in Brazil and Portugal, therefore offering evidence of a different scenario from the usual Anglo-American. Bellou (2010) points out that globalization widened our need to study and understand important organizational phenomena in other countries simply because changes are likely to exist. It argues that more data from various national contexts is needed before safely building general theoretical models.
2. Organizational Culture and Hospitality Culture
The OC has been recognized as an influential factor in organizational analysis in various contexts. Studies on the importance of this factor to establish competitive advantages (Barney, 1986; Cameron & Quinn, 1999) and its impact on organizational performance (Wilkins & Ouchi, 1983; Gordon & DiTomaso, 1992) have been widely discussed in the last three decades and they form an important part of the literature regarding the OC (Heritage et al., 2014).
The interest in the OC’s conceptual understanding emerged in the 1980s, in a time when productivity and competitiveness of North American companies were declining while Japanese companies experienced a rise, and received more attention from management scholars for being seen as a determinant factor of business success (Ornelas & Nogueira, 2014). Since then it has been used to explain issues such as performance differences, the globalization of markets, and the behaviour of organizational members, among others (Hofstede, Neuijen, Ohayv, & Sanders, 1990). Moreover, OC is regarded as one of the most significant factors in achieving organizational change and providing better service levels (Kloot & Martin, 2007; Kokt & Ramarumo, 2015). Despite the many studies already carried out, and the efforts by researchers, there is still no clear consensus regarding the OC’s definition (Gregory, Harris, Armenakis, & Shook, 2009; Dawson et al., 2011). However, there is a strong consensus on the fact that the OC affects people who make up an organization, regarding both the health of employees as well as their productivity (Baltieri & Peçanha, 2011).
In this study we adopt a functionalist perspective, and assume that the OC is a set of basic assumptions that certain groups have created, discovered or developed to deal with their problems of external adaptation and internal integration, transferring them to new members as being the correct way of
perceiving, thinking and feeling in relation to these problems (Schein, 1996).
Several studies, such as Hofstede et al. (1990), Calori and Sarnin (1991), and Cameron and Quinn (1999), established quantitative models for measuring OC, however, just as there is no consensus on the definition, there is no consensus on the most appropriate methodology to be used in research that aims to identify or measure OC.
Gordon and DiTomaso (1992) argue that the OC is strongly influenced by the characteristics of the industry in which the company operates. The authors believe that within industries, certain cultural characteristics are shared between the organizations, and these are likely to be quite different from those found in other industries.
The OC of the hospitality industry, named only Hospitality Culture, is a fairly recent issue (Dawson et al., 2011; Kokt & Ramarumo, 2015). It is considered quite peculiar, because the product "hospitality" is not a physical product, it’s the way in which the employee renders the hospitality service that is critical to overall customer satisfaction with the "experience" that is being purchased. Thus, the performance of front-line employees will drastically affect the quality of service and customer satisfaction (Dawson et al., 2011).
The main characteristics of this industry are defined by a sense of well-being, of making the guest feel happy, feel "at home", of exceeding expectations, rewarding innovation, putting the guest’s needs first, it’s in the spirit of serving others, and was characterized as "the Smile Factory" in studies by Kemp and Dwyer (2001). At the same time, low wages, low job security, long working hours, limited development opportunities and seasonality characterize this industry (Dawson et al., 2011). These issues lead to high staff turnover and therefore difficulty in hiring and retaining employees who can assimilate hospitality culture and provide the "experience" desired by customers. Some attempts have been made to develop scales for accurately measuring the OC of this industry, such as Hospitality Industry Culture Profile (HICP) of Tepeci & Bartlett (2002) that assesses organizational culture (perceived culture) and individual values (preferred culture), and the Hospitality Culture Scale (HCS) of Dawson et al. (2011), the latter being the object of our study.
3. The original Hospitality Culture Scale
The Hospitality Culture Scale proposed by Dawson et al. (2011), was built from studies done on the hospitality industry companies (e.g. Marriot and Ritz Carlton) and from the literature regarding the attributes of hospitality managers, e.g. Hospitality Industry Culture Profile (HICP) of Tepeci and Bartlett (2002). The scale has two parts. The first related to the unique attributes of hospitality organizations, e.g. the culture of hospitality, and a second part identifies the characteristics and values of a person who would be successful in a work environment that exhibited this culture.
45
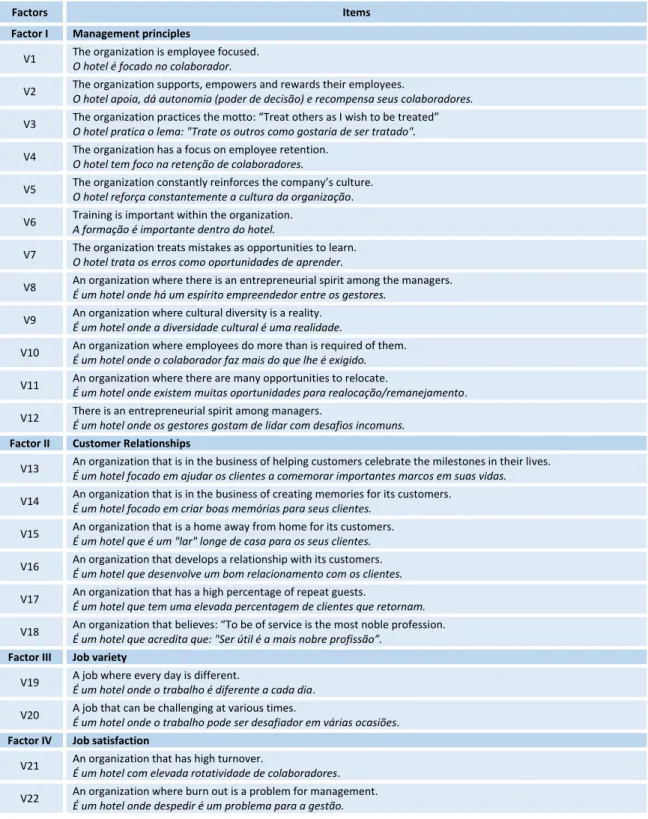
The proposal of the authors was to create a quantitative measure that the human resource personnel could use as a recruitment, selection, and training tool in order to make a potential employee suitable for the organizational culture of the hospitality industry companies. However, this study refers only to the part of the instrument that measures the OC of hospitality organizations, and that will be called Hospitality Culture Scale here, in order to provide researchers and managers with tools for the analysis of the hospitality culture and its relationship with other organizational variables.This scale has a structure of four factors and 22 items, as follows: Factor I, management principles, with 12 items, associated with the principles relating to the management of employees. Factor II, customer relationship, with 6 items related to the employee's conduct towards the hotel customer, the service and hospitality. Factor III, job variety, with 2 items related to the changes in the employee's work routine. And Factor IV, job satisfaction, with 2 items, presents aspects of work that are usually negatively associated with the hospitality industry such as high turnover and burn out. The 22 items are shown in Table 1.
Table 1 - Organizational Culture Factors of the HCS, developed by Dawson et al. (2011) and Portuguese version.
Factors Items
Factor I Management principles
V1 The organization is employee focused.
O hotel é focado no colaborador.
V2 The organization supports, empowers and rewards their employees.
O hotel apoia, dá autonomia (poder de decisão) e recompensa seus colaboradores.
V3 The organization practices the motto: “Treat others as I wish to be treated”
O hotel pratica o lema: "Trate os outros como gostaria de ser tratado".
V4 The organization has a focus on employee retention.
O hotel tem foco na retenção de colaboradores.
V5 The organization constantly reinforces the company’s culture.
O hotel reforça constantemente a cultura da organização.
V6 Training is important within the organization.
A formação é importante dentro do hotel.
V7 The organization treats mistakes as opportunities to learn.
O hotel trata os erros como oportunidades de aprender.
V8 An organization where there is an entrepreneurial spirit among the managers.
É um hotel onde há um espírito empreendedor entre os gestores.
V9 An organization where cultural diversity is a reality.
É um hotel onde a diversidade cultural é uma realidade.
V10 An organization where employees do more than is required of them.
É um hotel onde o colaborador faz mais do que lhe é exigido.
V11 An organization where there are many opportunities to relocate.
É um hotel onde existem muitas oportunidades para realocação/remanejamento.
V12 There is an entrepreneurial spirit among managers.
É um hotel onde os gestores gostam de lidar com desafios incomuns.
Factor II Customer Relationships
V13 An organization that is in the business of helping customers celebrate the milestones in their lives.
É um hotel focado em ajudar os clientes a comemorar importantes marcos em suas vidas.
V14 An organization that is in the business of creating memories for its customers.
É um hotel focado em criar boas memórias para seus clientes.
V15 An organization that is a home away from home for its customers.
É um hotel que é um "lar" longe de casa para os seus clientes.
V16 An organization that develops a relationship with its customers.
É um hotel que desenvolve um bom relacionamento com os clientes.
V17 An organization that has a high percentage of repeat guests.
É um hotel que tem uma elevada percentagem de clientes que retornam.
V18 An organization that believes: “To be of service is the most noble profession.
É um hotel que acredita que: "Ser útil é a mais nobre profissão”.
Factor III Job variety
V19 A job where every day is different.
É um hotel onde o trabalho é diferente a cada dia.
V20 A job that can be challenging at various times.
É um hotel onde o trabalho pode ser desafiador em várias ocasiões.
Factor IV Job satisfaction
V21 An organization that has high turnover.
É um hotel com elevada rotatividade de colaboradores.
V22 An organization where burn out is a problem for management.
46
The factor’s loads of this solution ranged from 0.41 to 0.82, indicating great consistency of factors extracted from the analysis procedure. Regarding the reliability indexes (Cronbach's alpha), all the factors obtained an alpha greater than 0.60, which is the minimum considered acceptable for instruments under development, with the exception of Factor IV, job satisfaction, which obtained an Alpha of 0.536. This factor was maintained by researchers that consider that "high turnover" and "burn-out" are negative features, but also striking in the hospitality industry, and important in the construction of the hospitality culture concept (Dawson et al., 2011).However, several authors, such as Bellou (2010) and Kokt and Ramarumo (2015), do not understand job satisfaction as part of the OC, but as a construct affected by it. Consequently, OC is seen as a predictor of job satisfaction. The types of OC or dimensions that comprise it are influential factors in job satisfaction. Bellou (2010) points out in her study that employees recognize certain cultural traits (i.e. equity, opportunities for growth, enthusiasm for work and good reputation) as satisfaction amplifiers at work. Moreover, there are cultural characteristics (i.e. aggressiveness) that seem to confine job satisfaction. These questions can, somehow, explain the low value of the Cronbach’s Alpha for the job satisfaction factor.
Dawson et al. (2011), with the 22 statements that describes the components of hospitality culture, developed an on-line survey instrument. The statements were classified in a Likert scale with seven points, varying from (1) “Strongly disagree” to (7) “Strongly agree”. The 22 items are positively drafted (i.e. " The hotel is employee focused”). The HCS creates a baseline to indicate if the OC is suitable for the hospitality industry’s context and shows that organizations with a score of 5,23 and higher are adequate for the context.
After a bibliographic review, it was concluded that there were no studies that performed a validation of the measurement model or tested this scale in other contexts. Regarding limitations, the study does not analyse the construct’s reliability when referring to the consistency of property and reproducibility of measurement (Hair et al., 2010) or the construct’s validity in relation to the instrument’s property to measure or to operationalize the construct or the latent variable to be assessed (Hair et al., 2010). These are issues to be analysed in this study.
4. Methodology
This study was divided into two phases. At first, the instrument was translated into Portuguese and its content was validated. In the second phase, we held a Confirmatory Factor Analysis (CFA) to confirm the structural patterns and assess the validity of the proposed measurement models.
4.1 Development of the Validation Version
In the first phase of the study, special attention was given to translating the original version of the scale into Portuguese to capture their linguistic nuances (Beaton, Bombardier,
Guillemin, & Ferraz, 2000). Three different translators, officially proficient in English, firstly translated the scale into Portuguese. Then the contents of the translations were analysed and compared by the researchers (two Portuguese and one Brazilian) and from that, a single consensus version in Portuguese was produced that was the closest to the original content, semantically.
A fourth translator who did not know the scale translated this version back into the original language. The back-translation was then compared with the original scale in English by one of the authors and a professional expert in linguistics in order to ascertain that the meaning of the questions was kept. This analysis led to several fixes related to linguistic and semantic equivalence. Subsequently, the scale was adapted to the context of the hotel industry taking the first version of HCS scale in Portuguese to this industry.
This version of the scale underwent a content validation regarding hotel industry. It was analysed by a director of a Portuguese hotel group, a hospitality industry consultant in Brazil, a manager of the Associação Brasileira da Indústria de Hotéis (ABIH) and a manager of the Associação da Hotelaria, Restauração e Similares de Portugal (AHRESP). The aim was to ensure that the scale items were relevant and generalizable to all hotel industries, so after some adjustments, the second version of the HCS scale was obtained.
Once the content’s validation was accomplished, the needed steps were taken to create a pilot study with employees from 10 hotels in order to assess the language and the form of the instrument’s content. Once again, the items of the scale suffered adjustments so that all individuals were able to fully understand the statements that made up the scale.
The final item pool was therefore used to make the validation of the survey instrument that also consisted of 22 items distributed in the 4 cultural dimensions – management principles, customer relationships, job variety and job satisfaction – as proposed in the original scale. Responses were also classified in a Likert scale of seven points ranging from (1) "Strongly disagree" to (7) "Strongly agree".
4.2 Sample and data collection
With respect to the sample selection criteria the study considered hotels with 3 stars or more, according to the Brazilian (Portaria no100, de 16 de junho 2011 do Ministério do Turismo, 2011) and Portuguese (Portaria n.o 309/2015 de 25 de setembro do Ministérios da Economia e do Ambiente, Ordenamento do Território e Energia, 2015) classification. The list of hotels was provided by ABIH in Brazil and by Associação da Hotelaria de Portugal (AHP) in Portugal. The managers of the hotels were contacted by telephone and later an email was sent with a request for authorization for the study and the questionnaire. After receiving the afore-mentioned authorization, a meeting was scheduled to explain the purpose of the study and what procedures would be followed.
47
The questionnaires were administered to 855 employees and managers. The online questionnaires were sent to professionals through a link after the acceptance from the general managers of the hotels to provide the employee's emails. Of the 855 questionnaires sent, only 321 were filled. Of these, 53 questionnaires were excluded from the sample for inadequacy or incomplete filling. Thus the effective sample size was 268participants. During the CFA, data was purified again and the final sample size was 259 participants. This sample satisfied the minimum requirement of power by at least 5 to 10 times the amount indicated in the CFA model (MacCallum, Browne, & Sugawara, 1996; Heritage et al., 2014). The demographic characteristics of the sample are shown in Table 2.
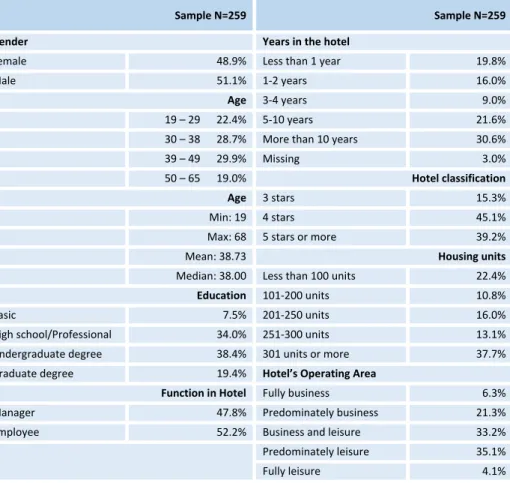
Table 2 - Demographic characteristics of the sample
Sample N=259 Sample N=259
Gender Years in the hotel
Female 48.9% Less than 1 year 19.8%
Male 51.1% 1-2 years 16.0%
Age 3-4 years 9.0%
19 – 29 22.4% 5-10 years 21.6%
30 – 38 28.7% More than 10 years 30.6%
39 – 49 29.9% Missing 3.0%
50 – 65 19.0% Hotel classification
Age 3 stars 15.3%
Min: 19 4 stars 45.1%
Max: 68 5 stars or more 39.2%
Mean: 38.73 Housing units
Median: 38.00 Less than 100 units 22.4%
Education 101-200 units 10.8%
Basic 7.5% 201-250 units 16.0%
High school/Professional 34.0% 251-300 units 13.1%
Undergraduate degree 38.4% 301 units or more 37.7%
Graduate degree 19.4% Hotel’s Operating Area
Function in Hotel Fully business 6.3%
Manager 47.8% Predominately business 21.3%
Employee 52.2% Business and leisure 33.2%
Predominately leisure 35.1%
Fully leisure 4.1%
The sample is mainly composed of employees (52.2%), of the male gender (51.1%) with a mean age of 38.73 years and with some kind of university degree (57.8%). Moreover, it is important to note that 52.2% of the sample has more than five years of work in the hotels, an important factor for assimilation of the OC of these companies, and 81.3% have some kind of contact with customers, a factor that characterizes the OC of the hospitality industry’s companies.
Regarding the characteristics of the studied hotels, the sample is mainly formed by hotels that operate predominantly in the leisure activities (39.2%) have 4 stars or more (84.3%), with more than 251 housing units (50.8 %), which feature large hotels. These statistical analyses were performed with the statistical package software SPSS version 23.0 for windows.
5. Confirmatory Factor Analysis
Seeking not only to confirm the factor’s structure of HCS, but also to show evidence of the construct’s validity, a confirmatory factor analysis (CFA) was conducted (Heritage et al., 2014). This
analysis aims to refine the results derived from exploratory factor analysis (EFA), performed by Dawson et al. (2011), and provide an appropriate parameter to allow comparisons between different predefined models and between the data collected. This analysis was performed using AMOS version 23.0 for windows.
Initially, the existence of multivariate outliers was visible using the Mahalanobis distance (Byrne, 2010). In total, nine outlier cases were therefore removed from the upcoming analysis due to the possibility of compromising the internal consistency of the scale and the fact that having no outliers is a basic prerequisite for the use of the CFA. The normality of the variables was evaluated by the uni- and multivariate asymmetry (Sk) and kurtosis (Ku) coefficients. No variable showed Sk and Ku values that indicated a severe violation of the normal distribution | Sk | <3 and | Ku | <10 (Finney & DiStefano, 2006). Three models were examined. Model 1 tested the structure proposed by Dawson et al. (2011) with four factors and twenty-two items. Model 2 tested the scale without factor IV,
48
considering that in the original scale this factor presented reliability problems (Cronbach’s Alpha α = 0.536), although the authors consider that this factor characterizes the hospitality industry’s organizations. Model 3 showed a structure of a single factor for HCS, the OC, with 22 items. The model’s adjustments were made from the modification indexes (greater than 11; p <0.001) produced by AMOS 23.0 and based on theoretical considerations.Due to the fact that there is no other accepted universal index besides chi-square test to evaluate the goodness of fit of each
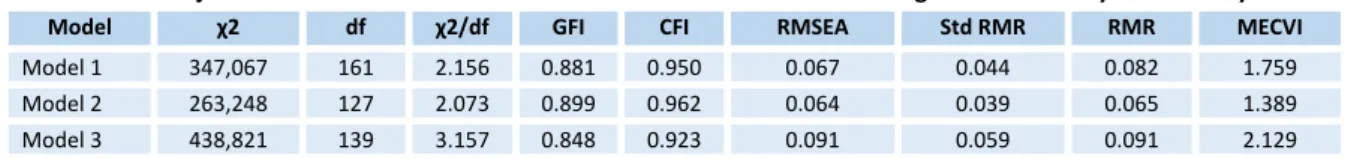
model, the following measures of model-data fit, with the minimum recommended values in parentheses, were used: χ2 / df (p> 0.05), Comparative Fit Index (CFI> 0.90), Goodness of Fit Index (GFI> 0.90), Root Mean Square Error of Approximation (RMSEA <= 0.05 or <0 08 acceptable), Modified Expected Cross-Validation Index (MECVI the lower the better), Standard Resting Metabolic Rate (StdRMR <0.05) and Resting Metabolic Rate (RMR <0.05) (Byrne, 2010). Table 3 shows adjustment indexes produced by the CFA on the three models.
Table 3 - Adjustment indexes for the four HCS factor models tested according to confirmatory factor analysis. Model χ2 df χ2/df GFI CFI RMSEA Std RMR RMR MECVI
Model 1 347,067 161 2.156 0.881 0.950 0.067 0.044 0.082 1.759
Model 2 263,248 127 2.073 0.899 0.962 0.064 0.039 0.065 1.389
Model 3 438,821 139 3.157 0.848 0.923 0.091 0.059 0.091 2.129
Model 1 tested the structure originally proposed by Dawson et al. (2011). The RMSEA, Std RMR and CFI indexes fit the data poorly, and the AMOS adjustment indexes suggested the removal of item 10 ("An organization where employees do more than is required of them") of factor I, because when assessing the individual reliability of the items through the weights of the factor’s loads, it was found that all the items saturated in their respective factors with a magnitude greater than 0.50 (p <0.001), except the aforementioned item that had a factor load of 0.21. The problem with this item was not assigned to translation problems because the translation process has been rigorously conducted to ensure equivalence between languages. Alternatively, it is believed that this may be a result of this item not being representative of the hotel industry.
Item 12 (There is an entrepreneurial spirit among managers) was also removed from the analysis for saturating at different factors from those suggested in the original version, factor III, according to the modification indexes. In addition, item 12 and item 20 (The job can be challenging at various times) have very similar contents, when thought about in terms of facing challenges, which may be the cause of this cross saturation. This item should be further investigated in studies with different samples. After this, measurement errors of items 1, 2, 7, 8, 9 and 11 of factor I and 13 and 14 of factor II were correlated, and the revised model was re-evaluated, with an acceptable adjustment of the indexes.
Model 2 tested a structure with three factors. In assessing the reliability of individual items, it was proven one more time that all items saturated in their respective factors with a magnitude greater than 0.50 (p <0.001), with the exception of item 10, which presented factor loads of 0.22, and was, again, removed from the analysis. Item 12 was also removed once more for saturating a factor different from the one suggested in the original version. After correlating the measurement errors of items 1, 2, 3, 4, 5 and 7 of factor I and 13 and 14 of factor II, suggested by the modification indexes, a good adjustment was obtained, with visible improvements when compared to the
original model. The Std RMR, RMR, RMSEA and MECVI showed decreasing values compared to other models and GFI and CFI showed higher values, demonstrating a better adaptation of the model.
In the third model, the structure of a single factor HCS was tested, with 22 items. On evaluating the reliability of individual items, it was found that the items 10, 21 and 22 had a factor load of 0.235, -0.056 and -0.031, respectively, and for this reason were removed from the analysis. After correlating the measurement errors of the items 1, 2, 11, 12, 13, 14, 19 and 20, the adjustment model obtained was still considered poor. In view of these results, it was considered necessary to use the chi-square test to evaluate the difference between the first (four factors) and second (three factors) models. The third model was not considered because, as can be observed, this model fit the data poorly.
The chi-square test was highly significant. The chi-square difference between the first and second model was statistically different (Δχ2 = 83.819, Δdf = 34; p <0.05), proving that model 2 is better than model 1, leading to the rejection of the null hypothesis that the models have the same quality adjustment. Moreover, it is important to note that the second model simplified shows a small MECVI, indicating that this model fits the data better.
Upon having demonstrated the suitability of the factor’s structure proposed on the sample under study, it is necessary to evaluate the composite reliability (CR), which according to Fornell and Larcker (1981) is a measure that estimates the internal consistency of the reflective factor items, indicating the extent to which these items are consistent manifestations of the latent factor (CF> = 0.7). The CR of factors proved to be adequate. The values are 0.935 for factor I (Management Principles), 0.937 for factor II (Customer Relationships) and 0.732 for factor III (Job Variety).
The scale’s construct validity was also verified to check if it actually measured or operationalized the assessed construct.
49
This was measured through the convergent and discriminant validity of the constructs (Fornell & Larcker, 1981; Garver & Mentzer, 1999), Table 4.Table 4 - Reliability properties and convergent and discriminant validity
Factors CR AVE MSV ASV Factor 1 0.935 0.706 0.552 0.460
Factor 2 0.937 0.597 0.552 0.532
Factor 3 0.732 0.581 0.511 0.439
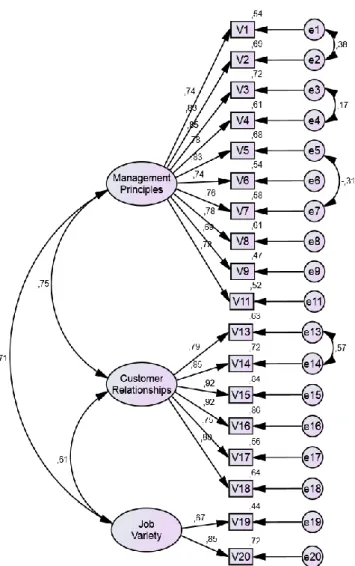
The convergent validity assesses the level of correlation between two items that reflect the same factor. To evaluate the validity, the analysis of extracted variance average (AVE) was used, so that values above 0.50 were considered suitable convergent validity indicators (Hair et al., 2010). The AVE proved to be suitable for all factors (factor I = 0.706, factor II = 0.597 and factor III = 0.581). Figure 1 presents the standardized values of the factor’s weights and the individual reliability of each of the items for model 3 which is considered superior.
Note: Satisfactory indications by Fornell and Larker (1981) and Garver and Mentzer (1999): CR > 0.7; AVE > 0.5; CR > AVE; MSV < AVE e ASV < AVE.
Figure 1 - HCS model fit a sample of 259 professionals of the hotel industry
The discriminant validity of factors, which occurs when the construct under study is not correlated with constructs that operationalize latent variables different from the one operationalized by the construct under study (Anderson & Gerbing, 1988), was evaluated by comparing the AVE with the Maximum Shared Squared Variance (MSV) and Average Shared Square Variance (ASV). We can then say that there is discriminant validity for all the factors, given that the MSV and ASV of the analysed factors are smaller than the AVE of each factor.
Subsequently, the configurational invariance of the structure and of the scale parameters between Brazil and Portugal were analysed, which is to ask: to what extent is the structure of the scale plausible for all groups that are being analysed by multi-group analysis (Sass, 2011). This factor model was evaluated with adequacy ratios setting patterns to AFC (χ2 / df = 2.057; CFI = 0.927; TLI = 0.912; NFI = 0.868, RMSEA = 0.064; SRMR = 0.051), showing good adjustment in Brazil and Portugal simultaneously, therefore evidencing configurational invariance.
50
The condition of configurational invariance was assessed in both groups by comparing the free model with a constrained model where the factor’s weights and the variance / covariance were determined for the two groups. The statistical significance of the difference of the two models was made with the chi-square test (Brown, 2006; Hair et al., 2010). The constricted model showed an adjustment significantly worse than the model with free parameters (Δχ2λ (15) = 22.139, p <0.104; Δχ2i (18) = 117.367; p <0.000; Δχ2cov (6) = 17.164; p <0.009). Only the factor’s weights did not differ significantly between Brazil and Portugal, so it is assumed that the model has a weak invariance measure.6. Conclusions 6.1 Discussion
This study represents the first evaluation of HCS measurement model in the context of hotel industry in Brazil and Portugal. The results brought some disagreement regarding the original scale. Initially, the translation of the instrument into the Portuguese language and adaptation to the hotel industry was performed. The content of the instrument was validated by experts and through a pilot study with employees from 10 hotels. The resulting instrument was composed of 22 items distributed in 4 dimensions - principles of management, customer relationship, work variety and job satisfaction - as proposed in the original scale.
Following the study, in order to confirm the factor structure of HSC a CFA was performed. The analysis was conducted with 259 professionals from the hotel industry. Three models were tested and the results presented according to model 2 had the best fit, in addition presented good convergent and divergent validity, and adequate composite reliability.
This model consisted of three factors and eighteen items, as follows: Factor I, Principles of Management, with ten items; Factor II, Customer Relationships with six items; and Factor III, Job Variety, with two items. In this solution, factor IV, Job satisfaction, was removed, for two reasons: the first being the solution originally produced by Dawson et al. (2011) presenting a value for Cronbach's alpha (α = 0.536) too low for this factor, which encouraged future researchers to test the model without it, and the second being that in test model 1 that factor had a low correlation with the rest of the scale.
The results showed that, when models were compared, the model with three factors was significantly more appropriate for the four-factors model originally proposed, which can lead to the conclusion that factor IV does not contribute significantly to the construction of organizational culture of the hospitality industry. It is believed that, despite this factor being composed of important items to the underlying theory of this industry, job satisfaction is not part of the OC, but is affected by it, as proposed by Bellou (2010) and Kokt and Ramarumo (2015). The OC, by developing a common way of thinking and understanding, can influence the interpretation of reality by
creating an organizational environment that makes employees feel valued, which can impact job satisfaction. However, job satisfaction cannot be considered part of the values shared by members of an organization, because it is linked to each individual employee's belief regarding working conditions. The configurational invariance of the structure and of the scale parameters between Brazil and Portugal was also verified for the three-factor model. The constrained model showed significantly worse adjustment than the model with free parameters. Only the factor’s weights did not differ significantly between groups, assuming that the model has a weak invariance measure. This result shows that there are inconsistencies that need to be better tested and understood for the improvement of the scale.
6.2 Implications
In this study the validity of the dimensionality of the HCS, for the hotel industry, is believed to be the main contribution. Another contribution delivered in this study is a valid Portuguese version of the scale. However, future researchers who intend to develop studies on the OC, particularly in the hospitality industry, should pay attention to the factors which measure the OC. Since there are factors that are related to the concept of OC, although they are not part of it, such as job satisfaction, it is a construct affected by OC. In this study OC is seen as a predictor of job satisfaction. The types of OC, or dimensions that comprise it, are influential factors in job satisfaction. They can act as satisfaction amplifiers at work or limiters for job satisfaction.
Moreover, in recent decades the hospitality industry’s companies increased considerable information technology (IT) investments, especially those related to electronic commerce. This lead to an increase in participation, particularly of small and medium enterprises, due to an ease of access, aligned with transparency in transactions, which gave more confidence to the consumer. Numerous studies have also been conducted about the relationship between the OC and the IT (Leidner and Kayworth, 2006) that explain the role of OC in management processes that can, directly or indirectly, influence the success of the implementation and use of IT. However, most of these studies are theoretical. The instrument validated here could provide an operational measure that can be used in future studies to verify the relationship between the OC and IT in the hospitality industry. For professionals that want to create a suitable environment for employees, to reproduce a behaviour that favours delivery of the main product of this industry, "hospitality", determining customer satisfaction, identifying the weak dimensions of OC is necessary. To this end, having a global scale that measures and reflects the dimensions the OC is essential to devising strategies to correct the weak dimensions that interfere with productivity.
6.3 Limitations and Recommendations for Future Research
Although the instrument developed here has been tested in different countries, the achieved results do not point to a
51
general conclusion. Ideally, an investigation of this nature must include other countries in order to provide a generalized model. In addition, the scale has been validated only in the hotel industry, an extensive validation in other organizations of the hospitality industry are necessary for the generalization of the findings in this research. Further analysis of the structure and of wide validity of the measure is encouraged.References
Anderson, J., & Gerbing, D. (1988). Structural equation modeling in practice: a review and recommended two-step approach. Psychological
Bulletin, 103(3), 411–423. Doi: 10.1037/0033-2909.103.3.411
Asree, S., Zain, M., & Razalli, M. R. (2010). Influence of leadership competency and organizational culture on responsiveness and performance of firms. International Journal of Contemporary
Hospitality Management, 22(4), 500–516.
Baltieri, M. A. T., & Peçanha, D. L. (2011). A cultura organizacional em um empreendimento hoteleiro. Bol. Acad. Paulista de Psicologia. São
paulo, Brasil. Retrieved from
http://www.redalyc.org/articulo.oa?id=94622747016
Barney, J. B. (1986). Organizational culture: can it be a source of sustained competitive advantage? Academy of Management Review, 11(3), 656–665. Doi:10.2307/258317
Beaton, D. E., Bombardier, C., Guillemin, F., & Ferraz, M. B. (2000). Guidelines for the process of cross-cultural adaptation of self-report measures. Spine, 25(24), 3186–3191. Doi:10.1097/00007632-200012150-00014
Bellou, V. (2010). Organizational culture as a predictor of job satisfaction: the role of gender and age. Career Development
International, 15(1), 4–19. Doi:10.1108/13620431011020862
Blomme, R. J., Van Rheede, A., & Tromp, D. M. (2010). Work-family conflict as a cause for turnover intentions in the hospitality industry.
Tourism and Hospitality Research, 10(4), 269–285.
Doi:10.1057/thr.2010.15
Brotherton, B., & Wood, R. T. C. (2008). The nature and meanings of “hospitality.” In The Sage Handbook of Hospitality Management (pp. 37 – 62). London, UK: Sage.
Brown, T. A. (2006). Confirmatory factor analysis for applied research. New York, NY: Guilford Press.
Calori, R., & Sarnin, P. (1991). Corporate culture and economic performance: A French study. Organization Studies, 12(1), 049–74. Doi:10.1177/017084069101200104
Cameron, K. S., & Quinn, R. E. (1999). Diagnosing and changing organizational culture (Revised ed.). San Francisco, CA: Jossey-Bass Business & Management Series.
Claver-cortés, E., Molina-Azorín, J. F., & Pereira-Moliner, J. (2006). Strategic groups in the hospitality industry: Intergroup and intragroup performance differences in Alicante, Spain. Tourism Management, 27(6), 1101–1116.
Dawson, M., & Abbott, J. (2011). Hospitality culture and climate: a proposed model for retaining employees and creating competitive advantage. International Journal of Hospitality & Tourism
Administration, 12(4), 289–304. Doi:10.1080/15256480.2011.614533
Dawson, M., Abbott, J., & Shoemaker, S. (2011). The Hospitality culture scale: a measure organizational culture and personal attributes.
International Journal of Hospitality Management, 30(2), 290–300. Doi:
10.1016/j.ijhm.2010.10.002
Deng, W.-J. (2011). Development of the hospitality quality management culture scale: a pilot study. The Business Review, 18, 205–211.
Finney, S. J., & DiStefano, C. (2006). Non-normal and categorical data in structural equation modeling. In C. Müller & R. Ptak (Eds.), Structural equation modeling: A second course (pp. 269–314). Bertrams Print on Demand. Doi:10.1002/car.1158
Fornell, C., & Larcker, D. F. (1981). Evaluating structural equation models with unobservable variables and measurement error. Journal of
Marketing Research, 18(1), 39–50.
Garver, M. S., & Mentzer, J. T. (1999). Logistics research methods: employing structural equation modeling to test for construct validity.
Journal of Business Logistics, 20(1), 33–57.
Gordon, G. G., & DiTomaso, N. (1992). Predicting corporate performance from organizational culture. Journal of Management
Studies, 29(6), 783–798. Doi:10.1111/j.1467-6486.1992.tb00689.x
Gregory, B. T., Harris, S. G., Armenakis, A. A., & Shook, C. L. (2009). Organizational culture and effectiveness: A study of values, attitudes, and organizational outcomes. Journal of Business Research, 62(7), 673– 679.
Hair, J. F., Black, W. C., Babin, B. J. & Anderson, R. E. (2010). Multivariate
data analysis: A global perspective. (7th ed.). Upper Saddle River, NJ:
Pearson.
Heritage, B., Pollock, C., & Roberts, L. (2014). Validation of the organizational culture assessment instrument. PLoS ONE, 9(3), 1–10. Doi: 10.1371/journal.pone.0092879
Hofstede, G., Neuijen, B., Ohayv, D. D., & Sanders, G. (1990). Measuring organizational cultures: a qualitative and quantitative study across twenty cases. Administrative Science Quarterly, 35(2), 286–316. Kemp, S., & Dwyer, L. (2001). An examination of organisational culture - the Regent Hotel, Sydney. International Journal of Hospitality
Management, 20(1), 77–93.
Kloot, L., & Martin, J. (2007). Public sector change, organisational culture and financial information: A study of local government.
Australian Journal of Public Administration, 66(4), 485–497.
Kokt, D., & Ramarumo, R. (2015). Impact of organisational culture on job stress and burnout in graded accommodation establishments in the Free State province, South Africa. International Journal of
Contemporary Hospitality Management, 27(6), 1198–1213.
Leidner, D.E. and Kayworth, T. (2006). Review: A Review of Culture in Information System Research: Toward a Theory of Information Technology Culture Conflict. MIS Quarterly, 30 (2), 357-399.
MacCallum, R. C., Browne, M. W., & Sugawara, H. M. (1996). Power analysis and determination of sample size for covariance structure modeling. Psychological Methods, 1(2), 130–149.
Ornelas, A. L., & Nogueira, H. G. P. (2014). Cultura Organizacional Brasileira: Antigos Dilemas e Novas Perspectivas. In VIII Encontro Nacional de Estudos Organizacionais (pp. 1–16). Gramado: ANPAD. Portaria n.o 309/2015 de 25 de setembro do Ministérios da Economia e do Ambiente, Ordenamento do Território e Energia. Pub. L. No. Diário da República: 1.a série, N.o 188 (2015). Portugal. Retrieved from www.dre.pt
Portaria no100, de 16 de Junho 2011 do Ministério do Turismo. , Pub. L. No. Diário Oficial da União (2011). Brasil. Retrieved from http://www.turismo.gov.br/legislacao/?p=175
Rogerson, J. M., & Kotze, N. (2011). Market segmentation and the changing South African hotel industry (1990 to 2010). African Journal of
Business Management, 5(35), 13523–13533.
Doi:10.5897/AJBMX11.030
Sass, D. A. (2011). Testing measurement invariance and comparing latent factor means within a confirmatory factor analysis framework.
52
Schein, E. H. (1996). Culture: The missing concept in organization studies. Administrative Science Quarterly, 41(2), 229.Tepeci, M., & Bartlett, A. L. B. (2002). The hospitality industry culture profile: a measure of individual values, organizational culture, and person–organization fit as predictors of job satisfaction and behavioral intentions. International Journal of Hospitality Management, 21(2), 151–170. Doi:10.1016/S0278-4319(01)00035-4
Wang, M., & Chen, H. C. (2013). Social presence for different tasks and perceived learning in online hospitality culture exchange. Australasian
Journal of Educational Technology, 29(5), 667–684.
Wilkins, A. L., & Ouchi, W. G. (1983). Efficient Cultures: Exploring the Relationship Between Culture and Organizational Performance.
Administrative Science Quarterly, 28(3), 468–481.
Received: 17 February 2017 Revisions required: 20 April 2017 Accepted: 20 July 2017