Models to support eucalyptus plantations management
under a changing environment
TESE APRESENTADA PARA OBTENÇÃO DO GRAU DE DOUTOR EM
ENGENHARIA FLORESTAL E DOS RECURSOS NATURAIS
Tânia Sofia Moreira de Paiva de Almeida Oliveira
ORIENTADORA: Doutora Maria Margarida Branco de Brito Tavares Tomé
JÚRI:
Presidente: Reitor da Universidade de Lisboa
Vogais: Doutor Daniel José Veja Nieva, Professor, Facultad de Ciencias Forestales, Universidad Juárez del Estado de Durango, México
Doutora Maria Margarida Branco de Brito Tavares Tomé, Professora Catedrática, Instituto Superior de Agronomia, Universidade de Lisboa
Doutora Teresa de Jesus Fidalgo Fonseca, Professora Auxiliar, Escola de Ciências Agrárias e Veterinárias, Universidade de Trás-os-Montes e Alto Douro
Doutor Domingos Manuel Mendes Lopes, Professor Auxiliar, Escola de Ciências Agrárias e Veterinárias, Universidade de Trás-os-Montes e Alto Douro
Doutor Luís Mendes Godinho Milheiriço Fontes, Bolseiro de Investigação, Instituto Superior de Agronomia, Universidade de Lisboa
LISBOA
2015
Contents
Acknowledgements ... iv
Abstract ... v
Resumo ... vi
Thesis structure ... vii
Introduction ...1
I.1. Background ... 1
I.2. State of the art ... 2
I.3. Objectives and outline ... 16
I.4. Data ... 20
References ... 23
Chapter 1 - A system of compatible models to predict and project tree crown ratio and crown length for eucalypt plantations ... 33
Executive summary ... 34
Abstract ... 34
Introduction ... 35
Material and Methods ... 36
II.1. Data ... 36
II.2. Model formulation ... 37
II.3. Model fitting – OLS versus mixed-modelling approach ... 39
II.4. Testing and overcoming violations of the regression assumptions ... 39
II.5. Simultaneous fitting of the final system of equations ... 40
II.6. Model evaluation ... 40
Results ... 41
Discussion ... 48
Conclusion ... 51
References ... 52
Chapter 2 - Modelling the aboveground stand biomass of planted and coppiced Eucalyptus globulus in Portugal ... 54
Executive summary ... 55
Abstract ... 55
Introduction ... 56
Material and methods ... 58
II.2. Methods ... 59
Results and discussion ... 62
Discussion ... 67
Conclusion ... 68
Acknowledgments ... 68
References ... 68
Chapter 3 - Modelling the diameter distribution in planted and coppiced Eucalyptus globulus plantations ... 72 Executive summary ... 73 Abstract ... 73 Introduction ... 74 Methods ... 75 II.1 Data ... 75
II.2 Model selection and fitting ... 76
II.3 Model evaluation ... 79
Results ... 79
III.1 Minimum diameter ... 80
III.2 Average diameter ... 81
III.3 Medium diameter ... 82
III.4 Maximum diameter ... 84
Conclusion ... 87
Acknowledgments ... 87
References ... 87
Appendices ... 90
Chapter 4 - Modelling the 3-PG fertility ratio as a function of available soil water and other soil parameters ... 94 Executive summary ... 95 Abstract ... 95 Introduction ... 97 Data ... 99 Methods ... 103 III.1 FR estimation ... 103 III.2 FR modelling ... 103 Results ... 105
IV.1 FR estimation ... 105 IV.2 FR modelling ... 108 Discussion ... 113 Conclusion ... 114 Acknowledgments ... 115 References ... 115
Chapter 5 - Using stand level allometric equations to hybridize process-based and empirical forest growth models. An application to 3-PG calibrated for eucalypt stands in Portugal ... 118
Executive summary ... 119
Abstract ... 119
Introduction ... 121
Material and methods ... 124
II.1. The hybridization procedure ... 124
II.2. The 3-PG model ... 125
II.3. The GLOBULUS model ... 128
II.4. Data ... 129
II.5. Details on the hybridization / improvement of the 3-PG prediction module ... 130
Results ... 135
III.1. Selection of the allometric models ... 135
III.2. Evaluation of the selected allometric models and 3-PG comparison ... 137
III.3. Fitting and evaluating the final system of equations ... 138
Discussion ... 142 Conclusions ... 144 Acknowledgments ... 145 References ... 145 Appendices ... 150 Final remarks ... 155 References ... 161
Acknowledgements
I take the opportunity to thank the Portuguese Foundation for Science and Technology (FCT) that financed my PhD with grant SFRH / BD / 46594 / 2008.
Permission to use data from the ALTRI and PORTUCEL Portuguese pulp and paper companies is greatly acknowledged as well as the support from our colleagues Clara Araujo and Professor Carlos Arruda Pacheco in the characterization of the soil in the fertilization trials that allowed the model of the fertility ratio as a function of soil characteristics.
To all that helped me get here: thank you!
Lisbon, 31 of March 2014
Abstract
The objective of this work was the development of a tool to support eucalyptus stands management with the capacity of predicting forest development under different management options, thus providing forest managers with useful information in the form of variable outputs with interest for forest management. The tool uses the 3-PG model as the basis for growth predictions so that it can be used under a changing climate.
The first thing to be done was the improvement of the crown ratio equation, taking advantage of the great amount of available data. With more precise equations, new values of biomass where estimated and a new set of aboveground biomass equations was developed. Biomass values are not only an important model output, but also a vital piece in the hybridization of the GLOBULUS growth and yield model and the 3-PG whole stand process based model. The linkage of the models resulted in a hybrid model with more detailed outputs that were further complemented with a diameter distribution model.
The 3-PG fertility ratio is an important parameter of the model, but is estimated in a subjective way. The improvement with an equation that predicts it from soil characteristics is important not also because it is a flaw that is recurrently appointed to the model, but also because it will allow it to be sensible to fertilizations.
Key-words: forest management support, climate change, Eucalyptus globulus, process based models, 3-PG.
Resumo
O objectivo deste trabalho foi produzir uma ferramenta de apoio à gestão de povoamentos de eucalipto capaz de prever o desenvolvimento da floresta sob diferentes opções de gestão, fornecendo aos gestores informação útil sob a forma de outputs com interesse para a gestão florestal. A ferramenta usa o modelo 3-PG como bases das predições de crescimento para poder ser usado em condições de clima variáveis.
O primeiro passo foi o desenvolvimento de novas equações de proporção e profundidade da copa com vista à melhoria das estimativas de biomassa aérea por componentes. Isto permitiu não só o ajustamento de um sistema de equações ao nível do povoamento para as diferentes componentes da biomassa aérea como permitiu também constituir a base de trabalho para a hibridação do modelo empírico GLOBULUS e do modelo de base processual 3-PG. A ligação destes modelos permite obter variáveis de output mais detalhadas que foram posteriormente complementados com um modelo de distribuição de diâmetros.
O parâmetro de fertilidade do 3-PG é um parâmetro importante do modelo, mas é estimado de forma subjectiva. O melhoramento com uma equação que o estime a partir de características do solo é importante não só por esta ser uma falha recorrentemente apontada ao modelo, mas também porque vai permitir que o mesmo seja sensível a fertilizações.
Palavras-chave: apoio à gestão florestal, alterações climáticas, Eucalyptus globulus, modelos de base processual, 3-PG.
Thesis structure
The thesis is presented in the form of articles. Each article will have its goals, methods and conclusions, but all contributing to the overall objective of the thesis, which is organized as follows:
Introduction – in this chapter, the motivation and objectives of the work will be presented, alongside with the framework for each of the papers in the thesis structure and state of the art. Chapter 1 – A system of compatible models to predict and project tree crown ratio and crown length for eucalypt plantations
Chapter 2 - Modelling the aboveground stand biomass of planted and coppiced Eucalyptus globulus in Portugal
Chapter 3 - Prediction of diameter distribution in whole stand process based models. An application to 3-PG calibrated for eucalyptus stands in Portugal
Chapter 4 - Modelling the 3-PG fertility ratio as a function of available soil water and other soil parameters
Chapter 5 - Using stand level allometric equations to hybridize process-based and empirical forest growth models. An application to 3-PG calibrated for eucalypt stands in Portugal Final remarks – summarizes the main results of this work and points out future research need
Introduction I.1. Background
Eucalyptus globulus Labill., an Australian native tree, was introduced in Portugal around 1850.
Initially with only ornamental interest, it soon reached the attention of foresters, not only for the characteristics of its wood, but also due to its rapid growth in a large majority of the country. However, it was not until 1926, with the construction of the first Portuguese - and presumably also the worlds - factory which used eucalyptus as raw material for pulp, that the species began to gain real importance. Since then, we have witnessed a more or less parallel growth of the pulp industry and plantation area, the latter growing from about 70,000 ha in the 1960 ( DGFSA 1966a, 1966b ) up to about 740,000 ha of pure and mixed stands dominated by eucalyptus currently available in the country (AFN, 2010).
It is a fast growing species, mainly used these days by the pulp industry. The trees are planted at final density, as thinning and pruning practices are not usual during the first cutting cycle. The stands are intensively managed as a short rotation coppice system in which the first cycle of planted seedlings (single stem) is followed by 2 or 3 coppiced stands, with an average cutting cycle of 10–12 years (Soares and Tomé, 2001). Pulp and paper industries alone hold the management of about 154,000 ha of eucalyptus stands (CELPA 2011) and the remaining area is privately owned. Forest management of this species is an important issue, since the national production can no longer respond to the industry´s demands, which means that the industry has to rely on wood importation. In 2012, about 23% of the national consumption of the eucalyptus industry was satisfied with imported wood. The production increase can be accomplished through an increase in the forest productivity, not only using genetic improvement, but also improving the silvicultural treatments (Santos et al., 2013).
The global context of today´s world, characterized by constant changes in society demands, increasing needs, soil use changes and, maybe most important than all of that, climate change, have been demanding an extra effort from forest management to adapt in order to accomplish this new demands in a sustainable way. Besides all this pressure, there has been a demand, from the forest management side, of simple, easy to use models that give more complete answers, i.e., that supply a whole group of variables indispensable for forest management and analysis of its sustainability. Until recently, only empirical growth and yield models were available in Portugal for Eucalyptus globulus. Several models were developed (Amaro, 2003; Amaro et al., 1998; Barreiro et al., 2004; Soares and Tomé, 2003; Tomé et al., 2001) prior to the joint effort of University and industry to develop a model that could be used in the whole country, the GLOBULUS model (Tomé and Ribeiro, 2000; Tomé et al., 2001; Tomé et al.,
2006). The GlobLand project improved the existing GLOBULUS 2.1 (Tomé et al., 2001) and developed GLOBULUS 3.0 (Tomé et al., 2006), the model that is currently in use. It is a stand level growth and yield model developed for pure even-aged stands that integrates all the information available on eucalyptus growth and yield in Portugal, representing the combined efforts between industry and universities, which have been involved in several co-operative research projects over the past decades. GLOBULUS 3.0 incorporates climatic information in the equations, but it is still an empirical model that lacks the flexibility and capacity to simulate environmental stresses and conditions beyond those of the data used to develop it.
Over the last years, process-based models have been gaining importance in forest management and in eucalyptus stands in Portugal. For eucalyptus plantations, the 3-PG (Landsberg and Waring, 1997; Sands and Landsberg, 2002) model is becoming more and more relevant. This model was developed as a simple process-based model that uses readily available data as input and it has already been parameterised for E. globulus in Portugal (Fontes et al., 2006), but there is still some room for improvements, namely the lack of forest management interest variables in the outputs and the empirical way of estimating one of the key parameters of the model that deals with soil fertility, a key issue in E. globulus forest management in Portugal.
I.2. State of the art
Forest management has been undergoing an evolution that demands that multiple objectives are addressed aside from the traditional maintenance of wood resources levels. To meet this objective, a wide variety of management techniques and silvicultural systems have been developed, the nature and complexity of which have expanded dramatically in the last 20 years. The traditional even-aged, single-species plantation management is evolving to multi-objective forest management that requires a wide variety of management systems that are developed and selected based on ecosystem characteristics and management objectives. It has been widely accepted from the end of the XX century that although relatively simple growth and yield models remain fundamental for forest management, the global community now demands more sustainable use of multiple values and a more comprehensive understanding of forests and forest products (Vanclay, 1994). However, not much has been accomplished in terms of tools available to support forest managers in this new paradigm of forest management. Models are simplifications of the real systems and are used when it is easier to work with the model than with the real system (Ford, 1999). Forests are complex ecological systems and forest management is a complex social, political, economic and biophysical activity. Multi-value sustainable forest management involves complex planning and the application of knowledge
from several sciences, which makes it one of the most complex human activities. At a basic level, modelling is the simple process of thinking systematically about a problem (Jakeman et
al., 2008) and modelling in forest management involves organization of data, assumptions and
knowledge for a specific purpose. Modelling methodologies continue to evolve as new knowledge, powerful computer technology and advanced statistical techniques are brought to help growth and yield predicting. Levins (1966) argued that modellers of population biology strive to maximize simultaneously three desirable properties of a given model: generality, reality and precision. Generality refers to the applicability to a range of instances; reality might be thought as the conformity of model assumptions and relationships to the real system; precision indicates the degree of exactness in predictions. In any model, Levins asserted, developers may sacrifice one of these desired properties to achieve a higher level of the others. In traditional growth and yield models, generality is sacrificed for increased reality and precision, being the primary focus on precision, something that can be considered a reasonable strategy. On the other hand, in today’s world of rapidly changing conditions, the interest in the generality property of the models has been increasing.
Several authors have classified forest growth models in 3 main types: empirical, process-based or mechanistic and hybrid. In some cases, process-process-based and hybrid models overlap, as the differences between them are not always clearly defined.
Empirical or statistical models use large data bases of measurements and statistical techniques like regression to derive quantitative relationships between growth and several tree and/or stand variables and have no basis on physiological process. They are important for updating forest inventories, comparing forest silvicultural treatments and estimating sustainable levels of harvest. Empirical models are robust, have a long story of development, rely on data that is generally available, the output is geared for operational decisions and can represent a wide range of conditions and sampling schemes. However, the data required has to be of high quality, the extrapolation power is very low and are generally insensitive to climate (Taylor et al. 2009). Since they are site-specific, no new variations in management or in environmental conditions can be considered, which makes it almost impossible for the models to be used outside the area and conditions for which they were developed. They are implemented in tools very commonly used in management and planning, because the information on forest productivity is accurate and reliable (Levy et al., 2004) even if the use is limited to forest management practices for which there are data available (Garcia-Gonzalo et
al., 2007).
A process-based model (PBM) can be defined as a description of the behaviour of a system in terms of a set of functional relationships and their interactions with each other and the system environment. The term mechanistic, also applied to these models, is related to the fact
that the behaviour of the entire system is simulated in terms of a series of sub-models describing the processes/mechanisms that determine that behaviour and the responses of those processes to changes in environmental inputs. Process-based models represent key plant physiological processes like photosynthesis, which are then scaled to the stand-level to estimate growth. They are developed to understand the underlying mechanisms influencing growth, to test hypothesis about plant behaviour and to predict potential forest productivity. The mechanistic models can theoretically extrapolate to novel situations and are sensitive to climate, but depend on several difficult to measure parameters, the input data is not widely available, they have high computational demand and often the output is not enough for operational decisions (Mäkelä et al, 2000; Landsberg, 2003). The driving variables – the independent factors that determine the rates of particular processes – are related to environment. Photosynthesis, often regarded as the primary plant process, is driven by radiant energy; respiration rate is affected by temperature; the rate of nutrient supply to root systems is affected by water movement to the roots and by rates of nutrient diffusion. The change of state of plants with time in terms of these factors may be formally stated as differential equations.
PBMs are useful for long term predictions, especially with climate and silvicultural changes. Landsberg (1986) describes PBMs as mathematical representations of biological systems that incorporate knowledge about physiological and ecological mechanism into prediction algorithms and fundamental scientific tools that enable hypotheses formalization and a structure that synthesizes the available knowledge. However, PBMs are seldom used as tools in forest management because it is considered that they include too many uncertainties and require parameters that are not well known and sometimes difficult to get so that their projections are as reliable in practice as the one´s from empirical models (Mohren and Burkhart, 1994). Furthermore, there is an idea that the conventional approach to statistical modelling of the growth and productivity is far superior.
Empirical and process-based models were initially considered as mutually exclusive, although Korzukhin et al. (1996) stated that there are no pure empirical or PBM, being all models developed using both methodologies. There is currently a great interest in the application of PBMs in forest management, namely the inclusion of process-based elements in management models to make better use of empirical observations (Sharpe, 1990). There are already some experiences of this type of models, including stand level models. Most of PBMs are based on photosynthesis, considering it either as the basic growth process (Bartelink, 2000; Ditzer et al., 2000; Lindner, 2000; Mäkelä et al., 2000a; Raulier et al., 2000; Valentine et al., 2000) or using it as an independent prediction variable (Brunner, 2000; Courbaud, 2000). Other physiological processes, such as water balance and nutrient cycles have received less attention in the
management context (Ågren, 1996; Landsberg and Waring, 1997; Sands et al., 2000), although they are fundamental for the perception of photosynthesis control and the effects of climate change on tree growth (Thornley and Cannell, 1996; Kirschbaum, 2000; Lindner, 2000) as well as regional variations in productivity (Landsberg and Waring, 1997; Coops et al., 1998; Sands et al., 2000).
PBMs are written in terms of mechanisms that rule the growth and respond to environmental changes, so, with the correct parameterization, they can be used in situations outside the ones for which empirical data was available, so they are usually used to answer the “why” or “how” questions, rather them the “what is” or “what if” ones (Leary, 1985). Korzuhkinet al. (1996) compared empirical and PBMs and concluded that PBMs offer significant advantages in forest management. Johnsen et al. (2001) discussed the use of PBMs as tools in research and also in forest management and favoured their use, noting however that its use in forest managing requires some simplifications.
Some important drawbacks to PBMs are that they are often quite complicated with outputs that are of little practical interest and can be difficult to parameterize or even operate due to high input data requirements. Matala et al. (2003) compared a PBM (FinnFor) and a statistical model (Motti) and found out that both gave similar predictions of relative growth rate, but the statistical model was more stable in terms of its predictions and not as sensitive to initial stand conditions and silvicultural treatments. Schmid et al. (2006) suggested that PBMs be preferred for simulations up to 100 years, because they account for changing climatic conditions. On the other hand, they found PBMs to be quite sensitive to uncertainties in model structure, parameter values and input data, which can be difficult to handle in large-scale applications (Schmid et al., 2006). So, the key limitations of PBMs are initialization, parameterization, scale and sensitivity. Use of PBMs in an applied forest management context is limited, but has been increasing in recent years due to the new series of challenging questions that forest management faces (Mäkelä et al., 2000a).
The state of the art in PBMs and their applicability to forest management can be summarized in three points:
1) The carbon balance is a sound basis for forest management applications and is based on estimates of photosynthetic production that is used to derive the growth of trees and stands. 2) The practical implementation of PBMs may be speeded when it is accepted that both models, empirical and process-based, can be improved with this integration.
3) The incorporation of PBM´s into forest management systems requires cooperation between modellers and forest managers (Mäkelä et al. 2000).
Process-based models have a long history in forestry. Several conceptual models of forest productivity were developed in the early 1980´s, but their scope of application was limited (Landsberg, 2003). Although there is good general knowledge of the physiological factors that influence forest production, the development of forest PBMs has been limited due to the lack of knowledge on key tree growth processes, especially the ones occurring below ground; trees are large, complex, multigenic, perennial organisms, and basic research is difficult; computers with enough processing power only recently have become available (Isebrands et al., 1990). The use and application of PBMs has increased in the last years and several technical reviews have been presented (Ryan et al., 1996; Battaglia and Sands, 1998; Mäkelä et al., 2000a; Landsberg, 2003). The use of PBMs in research has increased in recent years not only because of the increased knowledge of biology and forest ecology together with the great technological advances in computers and software (Landsberg et al., 1991), but also due to the need to integrate more complex organic information to answer questions that are at higher scales than those on which the processes are measured (Smith et al., 1998). This integration has been made to assist the interpretation of research activity, to address policy issues and to develop forest management tools. A wide range of issues are being considered, namely: how climate change will affect productivity (McMurtrie and Wang, 1993; Valentine et al., 1997)? How can forest management be improved to increase the productivity of a stand (Sievanen and Burk, 1992)? How to account for the impact of intensive forestry practices on forested watersheds hydrology (Amatya and Skaggs, 2001)?
It is currently not possible to find a model that satisfies all the requirements for assessing the sustainability of a multi-functional forest management, i.e., a model that: uses the available data, such as forest inventories, as input; takes into account the genetics of the plant material; gives good predictions in situations of climate and forest management change and provides information not only in terms of wood production, but also of other forest products and services. A major challenge is the development of methodologies to combine the two types of models in order to gain the benefits from the advantages of both, and in recent years several authors have tried this process, usually known as the hybridization of empirical and process models (Baldwin et al., 2001; Battaglia et al., 1999; Almeida et al., 2003; Robinson and Ek, 2003). Hybrid models attempt to combine the strengths of both process-based and statistical models and are often described as the future of forest growth modelling (Landsberg, 2003). They offer several advantages that make them appealing to a wide audience (Taylor et al., 2009). The primary advantages of hybrid models are that they: increase the flexibility of statistical models to address variability of climate and regional differences; simplify required inputs associated with PBMs and mechanistically represent influences of silvicultural treatments such as thinnings and fertilization. But there are also some disadvantages, they can compound error,
they still require difficult to access data and they bring generally small gain in accuracy when compared to statistical models. There is still a small number of hybrid models in the literature compared to the number of statistical models or PBMs, but their number has been increasing, especially after the advent of the 3-PG framework offered by Landsberg and Waring (1997). Hybrid models are simply the combination of statistical and mechanistic approaches, often with an applied goal (Johnsen et al., 2002). The main objective is to use physiological principles as much as possible while relying on allometrics and other accepted statistical modelling conventions for the rest of the attributes of interest. The scale used is mostly a stand-level and monthly basis, but there are tree-level and daily basis models too. The objectives of these models vary from predicting effects of climate change on tree growth (Baldwin et al., 2001) to the role of silviculture on external log characteristics (Mäkelä and Makinen, 2003). Hybrid models combine statistical and process approaches in an attempt to take advantage of the strengths of both approaches. They are useful for predicting growth using climatic factors and novel forest silvicultural treatments. They are robust, sensitive to climate, can use traditional forest inventory data and minimize the number of required parameters, but the climate and soils input data may not be widely available and the accuracy improvements can be minimal when compared to a purely statistical approach (Monserud, 2003).
Robinson and Ek (2003) point out that the use of established sub-models already identified as important for forest growth and dynamics saves a lot of time. Doing this allows for much of the excellent work already made to be reused and that time is not spent in new sub-models development and programing each time a new model is developed. Asides from that, taking models/sub-models out of their context and using them in new frameworks allows the identification of short-comings that might have been missed in the original context. They concluded that it is reasonable to extract components from different forest growth and dynamics modelling traditions, combine them in a new way and expect to be able to make defensible predictions. Most of the key processes of forest growth have already been modelled in very precise ways and there is no justification for extra work. For example, light interception, photosynthesis and calculation of Gross Primary Production are areas where a lot of work has been done and there are several models ranging from very simple to more complex ones. Several authors (e.g. Korzukin et al., 1996; Johnsen et al., 2001; Landsberg, 2003b) suggest that empirical or statistical models developed from historical observations of forest growth with little representation of ecological processes have limited application as decision-support tools to guide the application of ecosystem-based management. The limitations of such models are even more pronounced when the long-term impact of climate change arte taken into consideration. Process-based models are much more flexible and allow the simulation of changing environmental conditions, but their application as decision-support tools in forest
management has been limited for the difficulty to calibrate very complex models. Hybrid models have been developed in order to capture the flexibility of process-based simulations while maintaining the reliability of the historically based empirical models. Hybrid forest growth models use the knowledge of the growth process in a way that allows the integration of standard forest mensuration inputs and outputs. The link to the mensuration inputs and outputs is often achieved through statistical relationships (Mäkelä et al., 2000). Several authors have attempted a classification of stand-level forest growth models (Korzukhin et al., 1996; Landsberg, 2003b), but Mäkelä (2009) presented a very useful scheme to distinguish the three main hybrid modelling approaches, focusing the method of the hybridization and recognizing the core simulation approach used in the model: hybridized empirical models, hybridized process models and reduced-form process models.
Hybridized empirical models use process elements as sub-models to provide additional inputs, often expressed as modifiers of statistically derived growth functions, to empirical growth models. The sub-models can be simulations of intercepted radiation, gross or net photosynthetic production, soil water status, climate relationships or physical constraints such as growing space. This type of models is typically based on statistical relationships between height and diameter growth and site or environmental variables. It requires large databases to derive the relationships and the resulting models tend to be very site-specific (relationships based on correlations don´t always capture the interactions between process). One of the recognized strengths of this approach is the representation of competition between stems in a stand. Examples of this type of models are SORTIE-BC (Canham et al., 1999) and FVS-BGC (Milner et al., 2003).
Hybridized process models are the ones where potential growth rates, biomass allocation patterns and mortality functions are derived from empirical data and then modified using a complex system of physiological based functions or sub-models. The efficiency of these models depends on how the processes capture the key factors that regulate the growth rates. Examples of this type of models include the FORECAST model (Kimmins et al., 1999) and many of the gap models derived from the work of Botkin et al. (1972) and Botkin (1993). Mäkelä (2009) suggests that this type of models have a good potential to capture the combined strengths of biometrics and process modellers.
The reduced-form process models represent a distinct subset of hybridized process models derived from detailed mechanistic models through an aggregation of growth processes and parameters into core components in order to increase flexibility and make them more user-friendly. The empirical elements not only relate to processes, the allocation of carbon within and between tress, for example, but also to the process of model parameterization and calibration. One of the benefits of this type of models is that the mechanistic foundation
provides insight on the impact of environmental factors on the productivity of different species. Model parameters can be estimated using different approaches, from Monte Carlo techniques (e.g. Mäkelä, 1988) to Bayesian synthesis (e.g. Green et al., 1999; Van Oijen et al., 2005). This type of models relies on empirical sub-models that translate productivity into mensurational output such as height and diameter increments. Examples of this type of models are 3-PG (Lansdberg and Waring, 1997) and Pipestem (Valentine et al., 1997).
3-PG (Physiological Principles in Predicting Growth) is a simple process-based model, developed by Landsberg and Waring (1997) in order to bridge the gap between somehow simplistic empirical models and the more complex models with a physiological basis. The idea was to develop a practical tool, accessible to both scientists and forest managers. Following this idea, simplified description of the biological processes where used and combined with empirical relationships. It is a simple forest growth model developed with the specific aim of obtaining detailed information at the stand level and relevant to forest management (annual change in volume, diameters and biomass, among others). There is a strong correlation between the outputs of the model and empirical measurements (Landsberg et al., 2001, 2003; Law et al., 2001), consistent with forest inventory data obtained periodically during the rotation (Landsberg et al., 2003; Waring and McDowell, 2002). The model has been well received and it is widely used, with currently over 100 peer-reviewed publications. It is based on physiological processes that were considered the most important, it requires a number of parameters and initialization data relatively low and easy to get compared to other PBMs and is implemented in Visual Basic for applications (in Excel environment), which makes it user friendly. 3-PG is available free on the internet, it has been tested and implemented in many countries (different soil and climatic conditions) and various species - Eucalyptus globulus (Sands and Landsberg, 2002; Fontes et al., 2006), Eucalyptus grandis (Almeida et al., 2004; Esprey et al., 2004), Pinus taeda L. (Landsberg et al., 2001), Picea sitchensis (Bong.) Car. (Waring, 2000), among others. All these features make it an excellent choice and ideal for this doctoral work. It is a generalized growth model (i.e., not specific to each site, but that needs to be parameterized for individual species) for even-aged forest stands. It requires few initialization variables to characterize the site and easy to obtain climatic variables. It foresees the development of a stand, the use and available water in the soil over time. It gives as primary response variables the net primary productivity, carbon allocation to leaves, stem and roots, number of trees per hectare, the available soil water and transpiration on a monthly basis. It is a model that deals primarily with the biology and physiology of the growth process, but it has a module that converts the biomass pools (a biological output) into variables with forest management interest, such as leaf area index, basal area, quadratic mean diameter, volume and mean annual increment in volume. The monthly time step allows the model to reflect the
effects of factors that would be masked in yearly time steps, such as water stress and temperature variations, but a month can also be too long a time step for more detailed information such as radiation interception and canopy photosynthesis. The nature of the data used in the model is then determined by the objectives. The input data are divided in three classes: weather data, site-specific factors and stand initialization data:
- Climatic data: monthly mean values of solar radiation, monthly averages of minimum and maximum air temperature, monthly total precipitation and number of days per month with rain and with frost. These values can be the ones that were observed or, if not available, historical data, long-terms averages or scenarios for future climate.
- Site-specific factors: latitude, site fertility rate and the maximum value of water the soil can hold.
- Stand initialization data: initial values for the number of trees per hectare, biomass of foliage, stem and roots and the available soil water in the root zone.
The primary outputs from the model are the state variables: biomass (wood + bark + branches, leaves and roots), the number of trees per hectare and the available water in the soil, asides from some stand-level information that is more relevant for forest management, such as stand basal area, the average diameter, the volume under bark and the mean annual increment in volume. There are also other variables of interest, such as gross primary production, net primary production, stand evapo-transpiration and canopy leaf area index that are determined as part of the updating the state variables.
It is possible to identify five sub-models in 3-PG: the assimilation of carbohydrates, the carbon allocation to leaves, stem and roots, the evolution of the number of trees per hectare, the water balance in the soil and the conversion of biomass into variables with interest for the management (Sands and Landsberg, 2002):
1. Carbohydrates assimilation (net and gross primary productivity)
Calculation of gross primary productivity (GPP) is made using the value of photosynthetically active radiation (PAR), its interception by leaves and quantum efficiency of the canopy, which can be modified by environmental conditions. The GPP is proportional to the radiation absorbed by the canopy, which is determined from the leaf area index (LAI) and PAR through Beer's law. The PAR that falls upon the canopy of the trees is calculated from the total incident solar radiation, being the quantum efficiency of the canopy reduced taking into account various environmental modifiers that are function of the vapour pressure saturation deficit, available water in the soil, air average temperature, number of frosty days per month, fertility and stand
age (Sands and Landsberg, 2002). The net primary productivity (NPP or PN) is a constant fraction γ (= 0.47) of gross primary productivity (Waring et al., 1998).
2. Biomass/carbon allocation
The NPP allocation to the roots is determined by growth conditions that are expressed on the availability of water in the soil, vapour pressure deficit and site fertility, according to well-established principles (Beets, 1996; Landsberg and Gower, 1997). The fraction of NPP allocated to roots increases as soil fertility and/or the availability of water in the soil decrease. The biomass allocation to leaves and trunk with branches varies with growth conditions and depends on the average size of the trees, so that the biomass allocation to leaves decreases and allocation to the trunk and branches increases with the age of the population. Landsberg and Waring (1997) originally determined the value of this allocation ratios considering the average diameter and using the allometric functions for the average biomass of leaves, branches and stem. The ratios of biomass allocation are given considering the minimum and maximum ratio of allocation to roots, the ratio between the allocations to the leaves and woody materials and the effect of fertility on allocation - through the FR parameter.
3. Evolution of the number of trees / mortality
Population mortality may be density independent (random or stress-induced) or density dependent (self-thinning). An age dependent probability of death can be applied monthly and is potentially modified by factors in the long term. Variations in density are also calculated using the self-thinning law of 3/2 to ensure that the average stem biomass does not exceed the maximum allowed for each density value (Sands, 2003). For every tree that dies, a fraction of the average biomass of the total biomass reserve is removed. Since mortality alters both the number of trees and the biomass of each component, it may be necessary to use an iterative application of the self-thinning law to ensure that the law is fulfilled for the new state. When there is tree removal, it is assumed that each trunk removed has 20% of the average stem biomass and that no leaf loss occurs. This simulates the fact that the trees that die are usually the weakest and with very few small leaves (Sands and Landsberg, 2002).
4. Soil water balance
The 3-PG includes a simple soil water balance model that runs on a monthly cycle. To monthly rainfall (plus irrigation) opposes evapo-transpiration, which is calculated by the Penman-Monteith equation (Landsberg and Gower, 1997). The canopy interception is a fixed percentage of rainfall, but it can, from a certain value on, be a function of leaf area index. Excess soil water is lost as runoff. It is assumed that the vapour pressure deficit, available soil water and the age of the stand affect stomatal conductance. The canopy conductance is
determined from a potential stomatal conductance which is adjusted by the age modifier and the lowest of the environmental modifiers and increases with the increase in leaf area index (LAI) to the maximum conductance of the canopy (gCx (s m-1)).
5. Conversion of biomass into variables of interest for management
Starting from biomass values and assumptions about LAI, allocations and wood density, we obtain estimates of density, basal area, volume and other variables. NPP is partitioned in to the different biomass pools (foliage, aboveground woody tissue and roots) according to partition rates that depend on site and growth conditions and stand diameter at breast height. Litter-fall, root-turnover and wood mortality are also taken into account, but dynamic changes in allocation that are observed in thinning or pruning responses are not reproduced because allocation is dependent on tree size. Stem volume is calculated from stem biomass and using wood density while basal area is predicted considering the woody biomass and stand density. The outputs can be monthly or yearly and include biomass values of wood, roots and leaves, soil water, transpiration of the stand, leaf area index, volume, breast height diameter, average annual growth in volume and number of trees per hectare.
The initialization data such as latitude, density or even climatic data are, in principle, easy to obtain. The maximum available water in the soil (ASW) is difficult to obtain, because a correct assessment implies the opening of a profile pit, but if this requirement is met, it is easy to obtain. The fertility rating may pose a challenge, since its value has a high degree of uncertainty (in some applications this parameter has been manually adjusted according to available data, but this procedure cannot be implemented in an operational way or when no data are available). It is difficult to characterize the fertility of a site and data about soil profiles is not always available. However, the fertility and ASW both affect the light-use efficiency of the canopy, canopy conductance and the balance between above and below ground biomass allocation. It is therefore important to have good evaluation of these site variables.
The fertility ratio (FR) is a simple way to take into account the soil fertility. It varies from 0 for the most nutrient limited sites up to 1 for the sites at which nutrients are not limiting growth. The effects of site fertility on net primary production are taken into account by assuming that light use efficiency declines with declining FR, while biomass allocation to roots is assumed to increase with declining FR. Although these simple assumptions lead to realistic simulations of stand growth under a wide range of conditions, no simple objective means for assigning FR on the basis of soil chemistry has been available. So, this is a parameter that should be adjusted based on the soil knowledge, because not only is important in allocation, but Landsberg and Waring (1997) emphasized that although there is evidence to suggest that nutrition affects the amount of carbon allocated to roots, the quantification of this relationship
is difficult. There are statements that suggest that the nutritional status has a significant effect on productivity, having been suggested that the introduction of a sub-soil model could overcome these problems (e.g. Xenakis et al., 2008) Furthermore, intensive forestry has shown that an increase in productivity can be achieved improving soil nutrition, because an increase in fertility increases the leaf area index (LAI).
The assignment of a value of FR to use in the 3-PG model has been widely discussed. Usually a value is assigned in a subjective way considering the soil chemistry and the knowledge of growth in the site or in similar sites. If there is a set of parameters for the species in sites that are not nutrient limited that are reliable, 3-PG can be used to determine the FR for each site by changing its value in the model and finding the one that better approximates the estimated and observed values of stand growth. These values can then be related to soil characteristics and try to see if there are any relations. FR is supposed to characterize site´s fertility, so it must take the same value in a specific site for different species. If different values arise, then there must be some species-specific differences that are not being considered in other model parameters.
There are studies that show the strengths and weaknesses of 3-PG (Sands and Landsberg, 2002; Landsberg et al., 2003, 2005; Stape et al., 2004) and even exploring the internal feedbacks between the parameters and outputs (Almeida et al., 2004; Esprey et al., 2004). Some aspects of the model are criticized, such as the FR and the self-thinning subroutine (Dye, 2001; Landsberg et al., 2001; Whitehead et al., 2002; Landsberg et al., 2003). Landsberg
et al. (2003) suggested the use of soil studies to estimate FR, but this method is not practical
and has many limitations. In the same study it was also suggested the introduction of a dynamic model of soil organic matter to overcome this problem and this suggestion has been followed in several subsequent studies with the integration of 3-PG with models of soil organic matter decomposition (Peng et al., 2002; Hirsch et al., 2004; Paul and Polglase, 2004), although none has achieved an integration that allows the FR to be estimated from representations of soil processes. Although there is a rather limited knowledge of the relationship between the FR and the soil properties (Landsberg et al. 2003), efforts have been made in linking nutrient cycles with 3-PG, as well as advances in the development of local empirical functions between FR and soil characteristics. Stape et al. (2004) made a critical analysis using paired plots in eucalyptus plantations across 40 sites that captured the regional soil and productivity differences. First, 3-PG was parameterized using a complete carbon balance from an irrigated plantation and then validated using growth data from a set of 40 independent paired fertilized and unfertilized plots. The paired plots where of the same age and had similar starting values of woody biomass but one of them was fertilized to eliminate any existing limitation on tree growth. There were two growing seasons considered in the
study, one was normal and the other one was very wet. A fertilizer response (FER, t ha-1) that
measures the response of a site to fertilization was determined from the observed growth data for the wet years. 3-PG was also applied to the paired sites and the value of FR adjusted so that the predicted wood increment matched the observed increment in the wet years. When these values were compared with the observed FER, it was found that FR≈1 for sites with no fertilizer response (FER≈0) and that FR declined with increasing FER. The relationship between FER and soil parameters was also observed and a soil fertilizer response index (SFRI) was built, considering a linear combination of extractable potassium, phosphorus and cation exchange capacity in the upper soil layer that explained 56% of the observed variation in FER, but it is not known if the SFRI relationship is general. The study demonstrated that FR and the manner in which site fertility effects are included in 3-PG, enable it to predict observed responses to site fertility. Almeida et al. (2010) presented a model of FR as a function of soil fertility and available soil water, also considering other factors such as slope and management effects. In the work of Vega-Nieva et al. (2013), several plots were selected on which the soil characteristics were studied, including a full description of the soil profile, texture, pH, organic matter and fertility analysis. For each plot, the value of the available soil water was calculated with the model proposed by Domingo Santos et al. (2006). And the FR that best reproduced the observed growth was selected. A model for predicting the value of FR from the amount of available soil water and other nutrients with significant effects on fertility, in this case phosphorus, potassium, calcium and magnesium, was developed.
Forestry is primarily focused in selecting and applying the best set of silvicultural treatments needed to meet the objectives. So, one of the key uses of forest growth and yield models is projecting the long-term consequences of the various silvicultural decisions. Stand responses to treatment produce both direct and indirect effect (Miller and Tarrant, 1983; Auchmoody, 1985). In the context of fertilization, Opalach and Heath (1988) defined direct effect as “... the part of the response due to improved nutrition...” and the indirect effect as “... the remaining portion of the response due to altered stocking brought on by fertilizer in previous growing seasons.” Ignoring the difference between direct and indirect effects of a treatment can lead to unreliable estimates of the size and duration of the treatments response (Auchmoody, 1985). Likelihood of a fertilization response does vary between stands (Peterson et al., 1986) and it can be difficult to predict. The size of the direct effect response depends on tree species, type and amount of fertilizer, time since applications and the site productivity, with poor-quality sites often having larger relative responses than the most high-quality sites.
Plants require a number of mineral nutrients for their growth and inadequate supplies will affect it. Nitrogen is ultimately derived from atmospheric nitrogen, but all the other nutrients have their origin in the soil material. The macro-nutrients: nitrogen (N), phosphorus (P), sulphur (S),
calcium (Ca), magnesium (Mg), and potassium (K) are required in relatively large quantities. The micro-nutrients or trace elements are boron (B), chlorine (Cl), cobalt (Co), copper (Cu), iron (Fe), manganese (Mn), molybdenum (Mo), nickel (Ni), and zinc (Zn).
The concept of site fertility is complex, it is the outcome of many factors rooted in soil chemistry; it varies both seasonally and throughout the lifetime of a forest stand as a consequence of changing climatic conditions and it is affected by the withdraw of nutrients following litter fall. Models that could fully account for all these various factors would be extremely complex. However, some attempts have been made to avoid these complexities by devising pragmatic fertility indices, such as the 3-PG fertility rating.
Forest site quality is defined as the physical and biological factors that characterize a site´s ability to support tree growth (Skovsgaard and Vanclay, 2008). One of the most common measures of site quality is Site index (S), which is the expected height of the trees at a certain reference age. S has a long story of development and use, as its utility was noted towards the end of the nineteenth century (Batho and García, 2006). Some of the reasons for its widespread use are the relative ease to be estimated from field observations, its proven efficiency in predicting volume growth and yield and the strength of the site-specific relationship between dominant height and age in even-aged forests. Some of the key assumptions behind the use of S as a measure of site quality are:
- dominant height is independent of stand conditions;
- dominant trees that have not experienced any suppression or other damage are easily identified:
- dominant height is an effective integrator of the key biological determinants of growth. Although these assumptions are generally met, there are some significant exceptions, which can limit the utility of S as a productivity measure. For example, several studies found that tree height to be significantly influenced by stand density (Lynch, 1958; Cieszewsky and Bella, 1993; MacFarlane et al., 2000; Flewelling et al., 2001). The severity of the influence is related to species tolerance and site conditions; however, adjustments to ensure unbiased estimates can be made (e.g. Flewelling et al., 2001). To make sure that S is representative of the site quality, only undamaged trees must be selected, but those are usually the dominant trees. S is based on a reference age, which is typically set at some age less than the anticipated rotation age (Goelz and Burk, 1996). S estimates accuracy decreases significantly as stands diverge from the S reference age and Goelz and Burk (1992) found that top height at S age is often underestimated for high quality sites and overestimated for low quality sites. Determination of S requires the measurement of height and age of individual trees, both of
which are subjected to error. Measurement errors bias the S estimates and it can also bias the S equations (Goelz and Burk, 1996).
The ideal measure of site productivity is consistent over time, and for a given stand, S varies due to changes in genetics, climate and management practices. Monserud and Rehfeldt (1990) found that genetic variation explained over 40% of the original variation in S, which suggests that S can change between generations. Environmental conditions also have a significant influence on S estimates, because they affect growth on the short-term and stand genetics in the long-term (Monserud and Rehfeldt, 1990). Some silvicultural treatments like soil bedding can increase site productivity permanently, but other like vegetation control or fertilization just accelerates stand development without changing the final volume (Fox, 2000). When stands are thinned, measures of site productivity based on stand height have reduced ability (Skovsgaard and Vanclay, 2008). Even when the practices have long-term consequences, S is very sensitive to forest management practices. The drawbacks of the S as a site productivity measure give impetus to the use of process-based models that directly use environmental variables to drive tree and stand growth.
I.3. Objectives and outline
The work described here is a continuation of the work that has been being developed by the author in the last years. This work started with the GlobLand project. The work in that project gave the insight not only of the GLOBULUS model, the equations developed and all the knowledge applied in them, but it also gave a good insight of the eucalyptus stands data available. The work developed in the author’s MSc thesis took advantage of that knowledge and a system of equations for total and components above ground biomass of eucalyptus plantations was developed. This work also revealed some bias in the existing crown ratio (cr) equation for young stands, which was the starting point of the work described here.
The purpose of this work is to improve the forest models available to support eucalyptus management – GLOBULUS and 3-PG – and to combine/hybridize them in order to obtain a model to support eucalyptus plantations management under a changing environment. This new model must be of simple use and with multiple outputs; sensible to climate changes; be capable of considering different management alternatives and account for different management options such as fertilizations. After an initial stage of analysis of the existing models, the following partial objectives where defined:
1. Improve biomass estimations (the basis of process-based models development) by: a) Readjusting the crown ratio equations
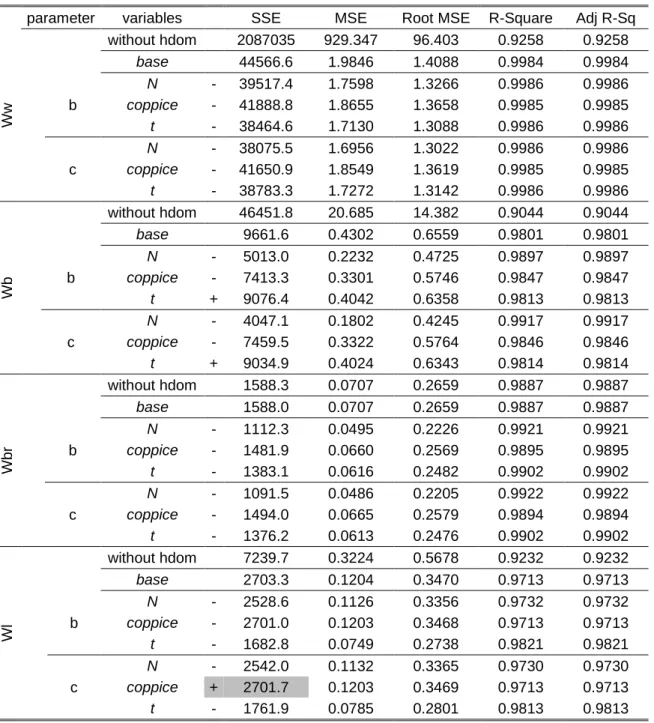
b) Develop a stand level system of equations to estimate total aboveground biomass and biomass per tree components (wood, bark, branches and leaves)
2. Improve the output of the 3-PG model so that it provides the same information as GLOBULUS – hybridization
3. Model diameter distributions
4. Develop a prediction model for the fertility index FR from 3-PG using soil characteristics as regressors
Models have to be accurate to be useful and accuracy can be improved by new data collection, improvement of by the quality of the existing data or the use of more sophisticated modelling techniques to the existing data. The need to readjust the crown ratio equations arose when the available data for eucalyptus stands in Portugal was analysed by Oliveira (2008). This author found that, in smaller trees, the difference between the measured and estimated values for crown length was very significant and the improvement of the equation was suggested at that time.
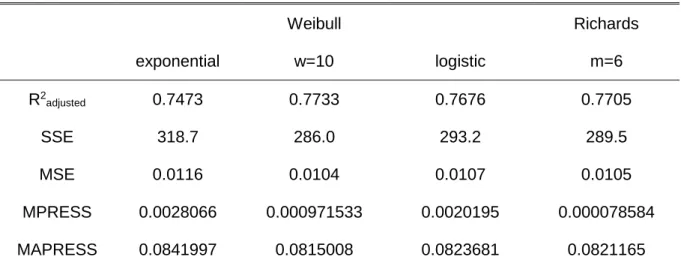
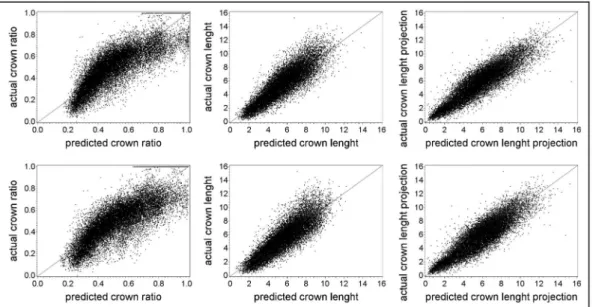
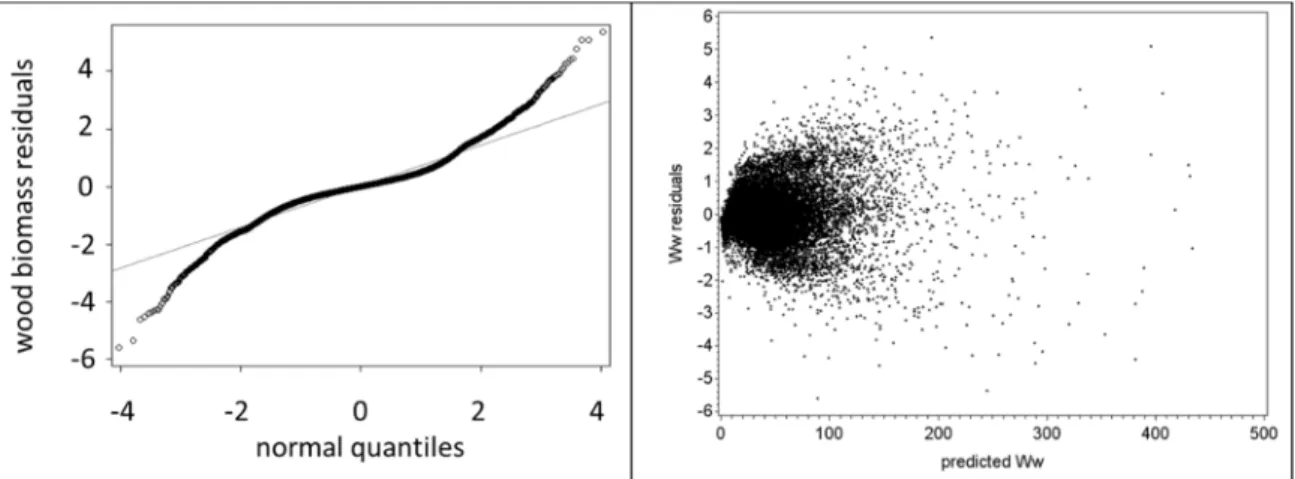
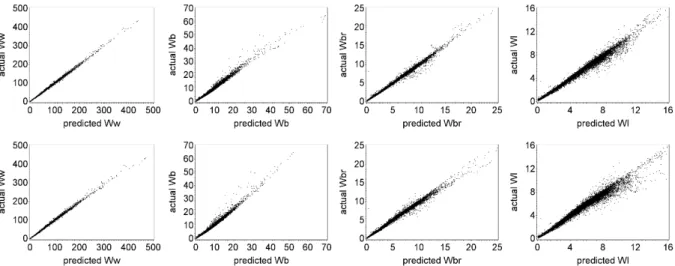
Any improvement to be made in the 3-PG model has to be based on a precise database with information of several variables, namely biomass values. Being the crown ratio a fundamental variable for the biomass estimates, the starting point of this work was the improvement of those equations. The previous equations (Soares and Tomé, 2001) were fitted using the limited data that was available at the time, and they covered only a few age classes and localized areas of Portugal. The eucalyptus database that is currently available has a much higher number of data covering a wide range of ages, locations, and other features of the stand, allowing the development of a better equation. The availability of measurements made in consecutive years allowed the development of an equation for crown length change and also to consider the autocorrelation structure of the data, something that had not been done previously. To overcome compatibility issues, a simultaneous adjustment was also made with a crown length equation. The new equations improved the biomass estimations in the database, especially in terms of leaves and branches biomass, and lead to the need to improve the existing stand level biomass equations. Once the biomass equations were improved, the development of a model to support forest management of eucalyptus plantations in a changing environment, the main objective of this thesis, could take place.
To satisfy the need to respond to climate changes, the growth models used have to be process-based (Lansberg, 2003; Battaglia et al., 2007; Pretzsch et al., 2008). The reasons why the 3-PG (Physiological Principles in Predicting Growth) model (Landsberg and Waring, 1977, Sands and Landsberg, 2002) was chosen where: 3-PG is a process-based model, it had
already been calibrated for eucalyptus stands in Portugal (Fontes et al., 2006) and it is a quite simple and not very demanding model in what concerns site characterization for model initialization, which is an advantage to be considered. In Portugal it had already been complemented with some prediction functions that improve the quality of the model output (Tomé et al., 2004).
3-PG is stand level model that works on a monthly basis (although it has monthly or annual outputs) and that includes empirical and process-based relationships that make the link between growth models based in measurements and process-based carbon balance models. It calls for stand, soil and climate data as initial inputs and supplies dynamic predictions of biomass, stand basal area (G) and density (N), among other variables. The main advantages, regarding other available models, namely empiric ones, is the ability to be used in climate changes situations and to be adapted to different species through parameterization with existing stand level data. Nevertheless, it is not as easy to understand as empirical growth models, not necessarily precise, it needs data that might not be available, and it gives a less detailed level of output and it makes a coarse approach to soil fertility.
The objectives of the hybridization are the improvement of the predictions of stand basal area (G), dominant height (hdom) and biomass and the diversification of outputs. This process is an attempt to combine different types of models, one process-based that can reflect management and climate changes and an empirical model that can give detailed outputs. The 3-PG "information for managers" module has 3 sub-models: stand density, basal area and volume under bark. Stand density is predicted according to the 3/2 power law while basal area and volume under bark are predicted based on woody biomass estimations.
The calculation of the volume under bark is based on the prediction of woody biomass, one of the outputs of 3-PG. The woody biomass (Wwoody = wood biomass + branches biomass + bark biomass) is converted into wood biomass (Ww) through the ratio (Rrc) between branches
and bark and woody biomass which is then multiplied by the wood density (ρ) to give an estimate of the volume under bark (Vu_st):
_ =
Both RRC and ρ are modelled as a function of age.
Basal area estimates takes a few more calculation steps and has several associated problems. First, the woody biomass of the mean tree is predicted dividing the total woody biomass by the stand density; then, the allometric equation for tree woody biomass is “inverted” and used to estimate the quadratic mean diameter (dg) that is used to compute the basal area of the mean
tree (gmed). Basal area is then estimated multiplying the basal area of the mean tree by the stand density: = = ⇒ = ⇒ 4 "100% & ' =
The aim is to improve this module, diversifying the outputs provided by 3-PG by hybridization with the empirical model GLOBULUS to obtain an output with the same level of detail. The connection between the two models is achieved by the allometric relationship that exists between basal area and woody biomass (Tomé et al., 2004). The biomass growth in the period under consideration is calculated by 3-PG and the present value of woody biomass (Wwoodyt2)
is calculated by adding the value of growth to the previous value. The prediction value of basal area (Gt2) is then estimated based on the existing allometric relationship between basal area
and woody biomass expressed as a difference equation (G-link function): ' &= ()) *& ⇒ '&= ' " ()) *()) * %&
with k - constant, a – allometric parameter and t1 and t2 the beginning and end of the growing period.
The dominant height, which is usually used as a regressor for the estimation of volume in growth models, is estimated by an allometric relationship with the total aboveground biomass (Wa) in which the allometric parameter is a function of density (hdom-link):
ℎ ), &= & -. / & / --- ⇒ ℎ ), &= ℎ ), &
-. / & / -. / /
---With the estimates of basal area and dominant height all the GLOBULUS output can be obtained. Diameter distribution is very important in the stand description. All other variables such has height, volume and biomass are correlated with the tree diameter. The diameter distribution simulation is also essential for the initialization of individual tree models (Ek and Monserud, 1979) especially when there is no data available or when there is the need to simulate the transition from a regular to an irregular stand, which implies the use of individual tree models. Besides, it is also essential in the planning of efficient harvesting operations. For the simulation of the diameter distribution, prediction equations for the minimum, average,
median and maximum diameters were developed based on stand level variables such has dominant height, density, site index and quadratic mean diameter. These variables allow the use of the available algorithm that simulates the diameter distribution (Marto et al., 2009) with Johnson's probability density function selected by Mateus and Tomé (2011).
The last objective of this thesis is the improvement of one of the weaknesses already pointed to the 3-PG model, the estimation of the fertility ratio (FR). The FR is one of the inputs of the model and it is a value that varies from 0 to 1 that is assigned in a somehow empirical way according to the site soil characteristics. The idea was to develop a model that predicts the FR value considering soil characteristics and fertility, which would allow the model to respond to fertilization changes. To make this improvement, a model that relates the FR with soil characteristics was developed. This will also allow to find out what are the most limiting nutrients for eucalyptus productivity in Portugal. The work developed by Vega-Nieva et al. (2013) showed good results for Galicia and similar results were expected for Portugal. However, the development of a model to predict FR in Portuguese eucalyptus plantations was not as easy as it seemed to be in Galicia.
I.4. Data
There were 2 different sets of data used in this thesis, one set from the large database available in Portugal for eucalypt plantations and the other one from 5 different fertilization trials belonging to the pulp company ALTRI.
The first set, the large database available in Portugal for eucalypt plantations includes data from permanent plots, continuous forest inventory of the pulp companies, spacing trials, and data from an experiment to study the species potential productivity that includes fertilization and irrigation as treatments. The plots are located throughout the species area of distribution in Portugal (Figure 1) and represent not only the existing ranges of ages, stand densities, sites and management options, but also give information of less usual management options, such as high densities and older trees, since the usual rotation cycle for eucalyptus doesn´t tend to go beyond 11/12 years.
It contains data from first-rotations and coppiced stands, part of it consisting of successive measurements (usually with 1 year interval between them) on the same plots which means that the presence of auto-correlation has to be considered. On each plot every tree had its diameter at breast height (d) measured. In current inventories, usually only trees with d bigger than 5cm are measured, but on permanent plots and trials all trees are measured, which means that there is information on very small trees.
Figure 1. Plots distribution.
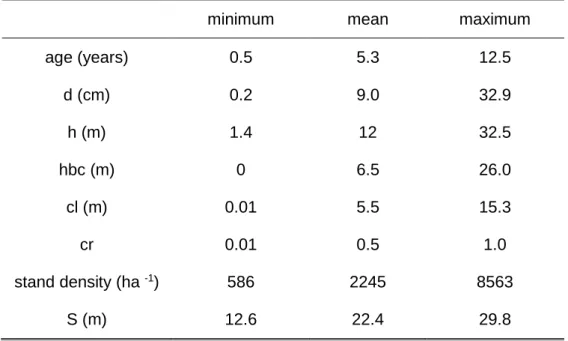
The plot size ranged from 100 to 2464 m2, depending on the source of the data. Continuous forest inventory plot size is usually 400-500 m2, but in permanent plots and trials, plot size varies. Diameter at breast height was measured in every tree and total tree height in dominant, model trees or all the trees, depending on data provenience. Non-existing tree heights were estimated with adequate allometric equations. Different stand volumes – total volume without stump over and under bark, bark volume, merchantable volumes to top diameters between 10 and 5 cm – were computed using the system of volume equations from Tomé et al. (2007). Aboveground biomass and biomass per tree component (stem wood, stem bark, branches and leaves) were estimated using the system of biomass equations developed by António et al. (2007). Crown length, used as regressor in the leaf and branches biomass equations, was estimated with the crown ration and crown length system of equations developed by Oliveira and Tomé (submitted). Site index was estimated with the equation from Tomé et al. (2001). Stand variables for each plot included age (t, years), stand density (N, trees ha-1), basal area (G, m2 ha-1), dominant height (hdom, m), site index (S, m) and total aboveground biomass (Wa) and biomass per tree component (Wi, Mg ha-1, i=w for stem wood, b for stem bark, br for branches and l for leaves).
The second set of data came from 5 different properties belonging to the pulp company ALTRI, scattered along the eucalyptus distribution area in Portugal (Figure 2) and in which fertilization trials are installed. All plots are of first rotation stands of non-clonal Eucalyptus globulus,
planted at 1.8mx4m spacing and were measured between the ages of 2 to 8.8 years. Each plot had an area of 518,4 m2 with a double edge and a number of 12 or 16 useful plants for
height and diameter measurements.