Brown Sugar, how come you taste so good?
The impact of a soda tax on prices and consumption
Judite Gonçalves and João Pereira dos Santos
1Nova School of Business and Economics
Abstract
Increasing obesity-related problems and rising healthcare expenditures have led governments
in developed countries to consider the introduction of soda taxes. We study a recent such tax,
implemented in Portugal in February 2017 —one of the first soda taxes worldwide that
increases with sugar content (0.08 euros per liter for drinks with less than 80 grams of sugar
per liter, and 0.16 euros per liter for drinks with 80 grams or more sugar per liter, plus VAT).
We use extremely detailed panel data from one of the two largest retailers in the country,
covering the period between February 2015 and January 2018. We take advantage of the tax
breakdown by sugar levels to examine how soda prices and quantities purchased reacted. For
identification, we rely on difference-in-differences models with various vectors of fixed effects,
comparing each group of products to water.
For drinks with more than 80 grams of sugar per liter, results indicate almost full price
through to the consumer. For drinks with less than 80 grams of sugar per liter, price
pass-through surpassed 100%. Regarding consumption, our findings suggest stockpiling behavior in
the quarter when the tax was approved and before it was actually implemented. In the
implementation period, there are no significant changes in quantities purchased for most
beverages vis-à-vis water, with the exception of soda drinks with comparatively low levels of
sugar. This suggests that benefits of the soda tax in terms of reducing sugar intake are mainly
due to reformulation, as producers reduced the sugar content of some drinks to fall below the
80 grams per liter threshold.
Keywords: soda tax, sugar-sweetened beverages tax, pass-through, policy evaluation, Portugal
JEL classification: C23, D12, H20, I18, Q18
1 Nova School of Business and Economics, Universidade Nova de Lisboa, Campus de Carcavelos, Rua da Holanda 1, 2775-405 Carcavelos, Portugal.
Email addresses: [email protected], [email protected]
João Pereira dos Santos acknowledges financial support by Fundação para a Ciência e Tecnologia (grant no. PD/BD/128121/2016). The authors are grateful for comments from two anonymous reviewers, Pedro Pita Barros, Judit Vall Castelló, Alexander Coutts, David Cutler, Randall Ellis, Jonathan Gruber, Albert Ma, Martin O’Connell, Jim Poterba, Nigel Rice, Susana Peralta, José Tavares, and participants at a Nova SBE-ISEG seminar, a Nova Health Economics and Management KC meeting, the VIII Taller EvaluAES (Universitat de les Illes Balears), the Workshop on Economics of Taxation & Social Expenditure (Universitat de Barcelona), the XXXIX Jornadas de la Asociación de Economía de la Salud (Albacete), the 13th Annual Meeting of the PEJ (Évora), the International Health Economics Association Congress (Basel), the 2019 EuHEA PhD student-supervisor conference, and the conference of the Portuguese Health Economics
1
Introduction
A growing number of governments around the world are introducing sugar-sweetened beverage (SSB) taxes (or ‘soda taxes’ for short) to change consumer behavior, generate revenue, and incentivize manufacturers to reformulate products. In fact, the World Health Organization’s Global Action Plan for the Prevention and Control of Non-Communicable Diseases 2013-2020 added soda taxes to their list of recommended policies, as there is overwhelming evidence linking SSB consumption to diseases such as obesity and diabetes (see e.g. Malik et al., 2010a and Malik et al., 2010b for a review of the evidence). As of July 2019, more than 40 countries had implemented or were on the verge of implementing SSB taxes, including for example Mexico, France, the UK, Portugal, South Africa, as well as Catalonia in Spain and several cities in the US (e.g. Berkeley, California, Boulder, Colorado, and Philadelphia, Pennsylvania; see Global Food Research Program UNC, 2019).
This study assesses the impacts of the Portuguese soda tax, implemented in February 2017, on soda prices and consumption. We use extremely rich product-store-month-level sales data from a large retailer with 400+ stores. To estimate the causal impacts of the tax, we adopt difference-in-differences and event study designs, using bottled water as the comparison group and controlling for several vectors of fixed effects. We explore the impacts of the soda tax on four distinct groups of soda products. This distinction takes into account the structure of the Portuguese soda tax, which taxes more heavily drinks with higher sugar content and has led manufacturers to alter the recipes of several drinks. All analyses are performed on both unbalanced and balanced panels; the latter including only the most popular drinks. Lastly, we study responses to the tax in different periods: when it was only being discussed in the media, when it was formally considered and debated in the parliament, and finally when it was enacted.
Our main findings include first, substantial pass-through of the tax to consumer prices, at almost 100% for high-sugar drinks and above 100% for drinks with less sugar; second, a substantial drop in consumption of drinks with relatively low sugar content, but otherwise limited impacts of the tax on consumption; and third, stockpiling in the quarter before the tax was implemented.
they impose on themselves (internalities) and on others (externalities) from consuming too much SSBs. Internalities have to do with individuals ignoring the effects of consuming SSBs on their health, because they are misinformed or because they fail to consider health problems that tend to appear far in the future. Externalities, in this case, are mainly healthcare costs of treating conditions related with SSB consumption, that are shared by everyone through public or private insurance.
Soda taxes can decrease the intake of sugar from SSBs, and consequently lead to improvements in population health, through three channels. The first channel is by increasing prices. In principle, consumers respond negatively to higher soda prices. However, whether soda prices increase or not depends, first, on whether manufacturers and retailers pass on the tax to the consumer, or alternatively (partly) absorb it. This in turn depends on manufacturers’ and retailers’ market power as well as the price elasticity of demand for SSBs. Manufacturers may also reformulate recipes in order to avoid (higher) taxes. Thus, the first question to be addressed concerns the impact of soda taxes on consumer prices (i.e. price pass-through). Available evidence on enacted soda taxes shows significant heterogeneity in price pass-through across countries and specific drink groups, ranging from less than 40% to more than 100% (Aguilar et al., 2018; Alsukait et al., 2020; Arteaga et al., 2017; Berardi et al., 2016; Bollinger and Sexton, 2018; Capacci et al., 2019; Cawley and Frisvold, 2017; Cawley et al., 2018a; Cawley et al., 2018b; Etil´e et al., 2018; Falbe et al., 2015; Grogger, 2017; Rojas and Wang, 2017; Seiler et al., 2019).
The second channel is precisely the incentive for manufacturers to reformulate recipes towards formulas with less added sugar. If SSBs contain less sugar, then sugar intake will be lower, by construction. Nevertheless, if consumers dislike the new recipes, they may substitute towards comparatively sweeter SSBs or other (unhealthy) products.
The third channel is increased consumer awareness. Regardless of any impact on price, media coverage and public debate around soda taxes may raise consumer awareness towards the detrimental effects of sugar intake and SSB consumption for health, and consequently decrease SSB consumption. One paper finds that soda consumption at the University of California campus, in Berkeley, fell immediately after the Berkeley soda tax was passed, two years before prices increased
on-campus [Taylor et al., 2019].
Other factors to keep in mind are substitution towards untaxed products that also generate internalities and externalities, e.g. candy or beer, and leakage, namely the possibility to purchase soda outside of the taxed jurisdiction [Allcott et al., 2019a]. There is suggestive evidence of substitution towards diet soda in countries where it is untaxed (e.g. Allcott et al., 2019b; Castell´o and L´opez-Casasnovas, 2018). For example Finkelstein et al. [2013] don’t find evidence of substitution towards sugary foods or pizza. As for leakage, Bergman and Hansen [2017] find that the tax pass-through for beer and soda in Denmark is an increasing function of distance to the German border. Bollinger and Sexton [2018], Cawley and Frisvold [2017], Cawley et al. [2019], and Seiler et al. [2019] also find evidence of cross-border shopping as a response to the soda taxes implemented in Berkeley and Philadelphia.
Most existing studies on consumer responses to soda taxes enacted in Mexico, Chile, Catalonia, Saudi Arabia, Berkeley, and Philadelphia find that consumption of soda decreased, from 6% in Mexico to more than 20% in Berkeley and Philadelphia and as much as 33% in Saudi Arabia (Aguilar et al., 2018; Alsukait et al., 2020; Arteaga et al., 2017; Castell´o and L´opez-Casasnovas, 2018; Cawley et al., 2019; Colchero et al., 2016; Colchero et al., 2017; Falbe et al., 2016; Mora et al., 2018; Nakamura et al., 2018; Seiler et al., 2019; Silver et al., 2017; Taylor et al., 2019). Due perhaps to specific data or methodologies, a few studies on the Berkeley soda tax don’t find significant impacts on consumption (Bollinger and Sexton, 2018; Rojas and Wang, 2017) and one finds a small positive impact [Debnam, 2017].
The literature so far has mainly relied on survey or home-scan data (e.g. Kantar World Panel) or hand-collected data on a few products or stores, with only a few studies having access to retail data (Berardi et al., 2016; Castell´o and L´opez-Casasnovas, 2018; Seiler et al., 2019). To try to estimate causal impacts, the vast majority of studies employ difference-in-differences designs, either comparing taxed products to untaxed ones (e.g. bottled water), or regions where soda is taxed to regions where it is not.
The studies cited above estimate the impacts of enacted soda taxes around the world ex-post. Several other studies provide ex-ante estimates of the impacts of soda taxes, by estimating demand
systems for soda and related products and then simulating the impact of the introduction of a soda tax. For example, Finkelstein et al. [2013] and Xiang et al. [2018] estimate that a 20% tax-induced increase in SSB prices would decrease per capita energy purchases by 24-29 kcal/day (see also Andal´on and Gibson, 2018; Caro et al., 2020; Colchero et al., 2015; Dubois et al., 2018; Etil´e and Sharma, 2015; Gomo and Birg, 2018; Harding and Lovenheim, 2017).
To summarize, most studies on the ex-post impacts of soda taxes implemented in France, Mexico, Chile, Spain, Saudi Arabia, and the US find increases in SSB prices and drops in SSB consumption. However, the magnitudes of the effects differ substantially across countries and studies, reflecting on the one hand the different tax rates and designs across countries, and on the other the different types of data and methodological approaches employed.
As for Portugal, non-scientific evidence indicates that between 2016 and 2017 alone, lemony drinks’ and fruit-flavored soda’s average sugar content decreased by 32.2% and 17.3% respectively (e.g. 7Up, Fanta; dos Santos, 2018). Overall, the change in the caloric content per 100 mililitres of non-alcoholic beverages was -11% from 2016 to 2017 (-21% from 2013 to 2017; Grupo de Trabalho, 2018). Until December 2017, the share of products with 80 grams of sugar or more per liter decreased from 61% to 37.9% of the sales volume [Grupo de Trabalho, 2018]. Aggregate data also indicate a 15% reduction in the total amount of sugar intake in 2017, arising from a transfer of consumption from high-sugar drinks to drinks with less than 80 grams of sugar per liter [Goiana-da Silva et al., 2018]. Of course, this mixes together the effect of recipe reformulations and any potential substitution effects.
This study adds to the previous literature by assessing for the first time the causal impacts of the Portuguese soda tax. We start by determining the extent of pass-through to consumer prices, and then analyze the impacts of the tax on soda consumption.
The setting of our study and our excellent data allow us to produce novel results along three main dimensions. First, soda taxes that vary according to drinks’ sugar content, penalizing more heavily drinks with a lot of sugar, are increasingly popular. In particular, this tax design led manufacturers in Portugal to change recipes in order to pay a lower tax, and we distinguish between the effects of the soda tax on drinks that remained above the threshold and those that
saw their sugar content reduced. This is an unexplored issue in previous studies.
Second, we have extremely detailed product-store-month-level data from a large retailer with more than 400 stores distributed across the country and 21% market share. Our data are nationally representative and allow us to estimate the causal impacts of the tax through a difference-in-differences design, using bottled water as the comparison group and controlling for several vectors of fixed effects. Few previous studies are able to control for potential confounders (e.g. preferences) as rigorously as we are. We also present event study specifications, providing evidence in favor of the parallel-trends assumption.
Third, we study the impacts of the soda tax before it was introduced, when it was only being discussed in the media and debated in the parliament, i.e. before and after prices changed due to the tax. This allows us to (partly) separate-out price effects from the other two channels (product reformulations and increased awareness). This is something that Taylor et al. [2019] also explore, but our data are more detailed and representative, covering all soda products and the whole country, as opposed to a university campus. We also explore stockpiling behavior in the quarter prior to the tax implementation, something that appears to have occurred for example in the UK, before a government levy on sugary drinks came into effect in 2018 [BBC News, 2018].
2
Institutional background
The Portuguese soda tax was implemented nationwide in February 2017 and received extensive media coverage. It was first mentioned almost one year earlier, in May 5, 2016, in the newspaper ‘Expresso’ [Expresso, 2016]. The tax proposal was included in the government budget proposal for 2017, submitted to the parliament for discussion in mid-October 2016. The soda tax was finally approved on December 28, 2016, together with the government budget for 2017 (Decree-law no. 42/2016).
The Portuguese soda tax applies to non-alcoholic drinks with added sugar or sweeteners, including liquid or powder concentrates. Examples of concentrates are Sunquick and Tang; in this case, the tax is calculated based on the sugar content of the final diluted mix. Tax-exempt products include (1) milk-, soy-, or rice-based drinks, (2) fruit-, algae-, or veggie-based juice and
nectar, as well as cereal- and nut-based drinks, and (3) drinks considered essential for special dietary needs. Table 1 compares the main features of the Portuguese and other soda taxes that have already been studied. Similarly to Catalonia, in Portugal there are different brackets defined based on drinks’ sugar content. The amount of the tax is 8.22 euro cents per liter for drinks with less than 80 grams of sugar per liter, and 16.46 cents per liter for drinks with 80 grams or more sugar per liter. The usual 23% VAT adds up to the soda tax, which gives 10.11 and 20.25 euro cents per liter. Unlike in Catalonia, neither drinks with relatively little added sugar nor light drinks are exempt, and drinks with a lot of sugar pay a comparatively higher tax.
Table 1 here
The tax is levied on producers, not retailers. The different tax breaks are a way to incentivize producers to reduce drinks’ sugar content in order to be subject to a lower tax (Allcott et al., 2019a; Cremer et al., 2019). In fact, several products that used to have more than 80 grams of sugar per liter now have 78-79 grams instead, paying a tax half as large (e.g. Coca-Cola Portugal, 2020; Goiana-da Silva et al., 2018). The UK, which also introduced a graduated soda tax, seems to be experiencing similar effects [Roache and Gostin, 2017].
3
Data
We use data from one of the two largest retailers in Portugal for the period February 2015-January 2018. This retailer has a share of 21% of the Portuguese retailer market and more than 400 stores that cover the mainland and Madeira territories comprehensively [Jornal Econ´omico, 2018]. Unlike in other countries, most retailers operating in Portugal (and all the main ones) are relatively similar in terms of the products/brands sold and price ranges [DECO PROTESTE, 2018]. This contributes to the national representativeness of our analyses.
The dataset includes monthly information on sales and sales volume at the product and store levels, from which we can compute unit prices. Prices include VAT and other taxes; unlike in the
US, in Portugal price tags include any applicable taxes. We can identify products by name/brand, and container size. A product corresponds to a specific bar code, meaning that a 1-liter bottle and a 33-centiliter can of Coca-Cola are two distinct products, for instance.
Geographically, we know only if a store is located in the North, Center, South, or Madeira regions. These regions display both between and within heterogeneity, e.g. they include both rural and urban areas. In addition, we can identify stores located in the two main metropolitan areas (Lisbon and Oporto), and stores located within 30 kilometers from the border with Spain. Unfortunately, we lack more detailed store locations or client information, preventing us from investigating potentially heterogeneous responses by local income level or other characteristics.
We define four main treated product groups, directly affected by the tax, based on each drink’s sugar content. Information on each drink’s sugar content was gathered from online sources and field visits to the supermarket in mid 2018, and validated, for the most part, by the producers or the Portuguese Association of Non-Alcoholic Beverages (PROBEB) by email. A few drinks with unknown sugar content that accounted for very few observations or total sales were excluded. Liquid and powder concentrates were also dropped. The first group includes drinks with more than 80 grams of sugar per liter (High Sugar, HS ); examples are Coca-Cola and Red Bull. The second group includes drinks with sugar levels just below that threshold (Medium Sugar, MS ); e.g. Fanta, 7Up. According to the available evidence, these drinks experienced reductions in their sugar contents; i.e. they contained more than 80 grams of sugar per liter before the tax was implemented (Introduction). The third group includes drinks with lower sugar levels, mostly below 70 grams per liter, unlikely to have dropped from more than 80 grams per liter pre-tax (Low Sugar, LS ), such as most iced tea and flavored water drinks. The fourth group includes zero-added sugar/artificially-sweetened drinks (Zero Sugar, ZS ); e.g. Coca-Cola Zero, Diet 7up. Note that this classification is fixed over time —products do not move from one group to another. In sum, High Sugar drinks pay the highest tax (0.16 euros per liter +VAT), and all other drinks pay the lowest tax (0.08 euros per liter +VAT).
Our comparison group is Water. We follow for example Alsukait et al. [2020], Etil´e et al. [2018], and Taylor et al. [2019], who also consider bottled water as a comparison product. There
are several reasons why we believe that water is a good comparison group in our setting. First, water is neither taxed nor likely to be indirectly affected by the tax. Cawley et al. [2019] and Seiler et al. [2019] explore the impacts of the Philadelphia soda tax on water consumption and find no evidence of substitution of soda for bottled water. Some other studies from completely different geographies, including Saudi Arabia or France, also find no evidence of such substitution (Alsukait et al., 2020; Capacci et al., 2019). Second, with the exception of sugar, the water-bottling industry uses the same inputs as the soda industry (e.g. machines, electricity, water, plastic/glass). So, water and soda are likely to share similar cost structures in packaging, marketing, and logistics [Etil´e et al., 2018]. Recent trends against plastic packaging should also affect both soda and bottled water in a similar manner. Third, soda brands have very low market shares in the bottled water segment, which mitigates any strategic manipulation of prices. Coca-Cola Portugal and Sumol-Compal are the main competitors in the Portuguese soda market, while the bottled water market is highly fragmented, with more than 30 brands/firms competing. In our data, the two water brands distributed by Coca-Cola Portugal are not represented, and the one brand commercialized by Sumol-Compal, Serra da Estrela, represents only 1% of sales volume. Fourth, most people simply drink water from the tap, making substitution of soda for bottled water less likely [Instituto Ricardo Jorge, 2016].
We conduct our analyses on the full sample (Unbalanced Panel) that includes all products, sold in any store in any month over the period February 2015-January 2018. For comparison, we also estimate our models on a restricted sample (Balanced Panel) that includes only products available in all stores in every month over the period February 2015-January 2018, i.e. the most popular drinks in common sizes. Figure A1 in the Appendix displays the evolution of the number of products per group in our unbalanced panel. In general, the numbers of products are fairly stable over time, with the exception of the Low Sugar category; this is also by far the largest category of products. The volatility in the number of products in this category is generally associated with some flavors not being sold year-round (e.g. red fruits); there was also one Portuguese brand of iced tea —four different flavors— created in 2014 that was discontinued in 2017. None of this affects the balanced panel, which always includes the same products over the entire period. Summary
statistics for both samples are presented in Table A1.
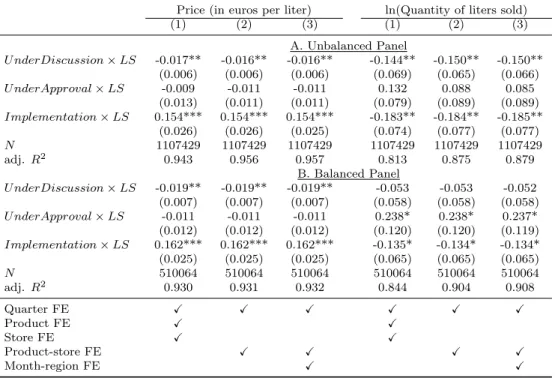
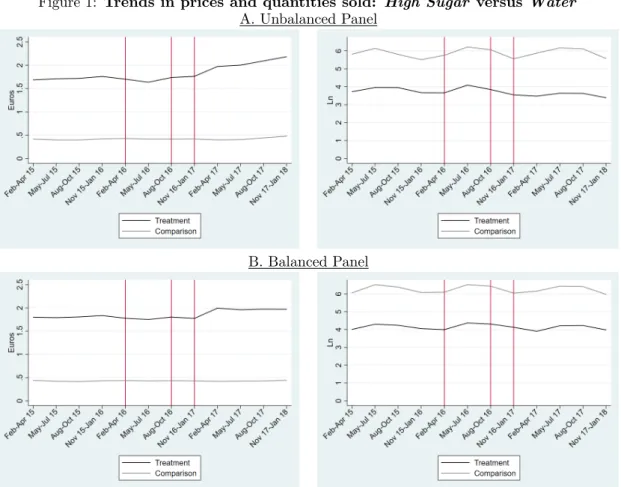
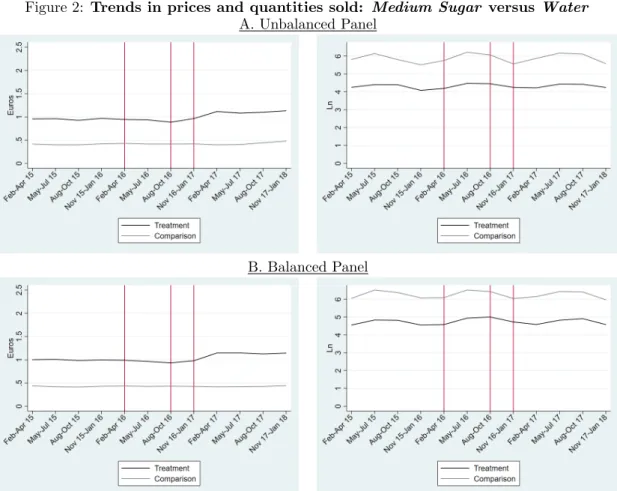
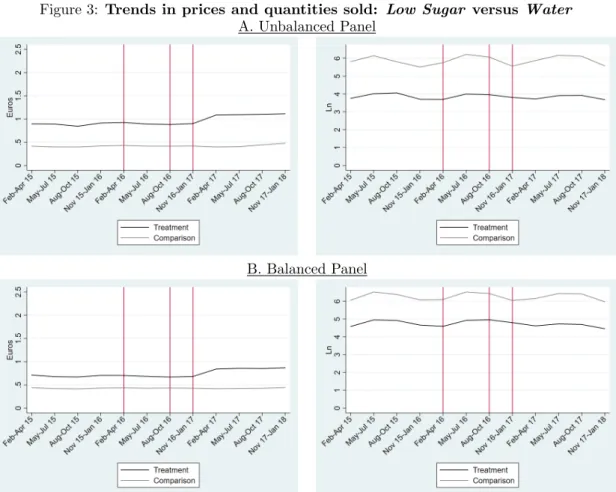
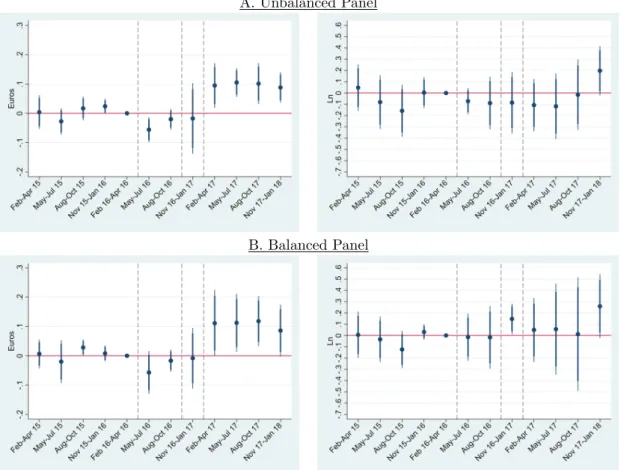
Figures 1-4 show the evolution of prices and quantities sold for each treatment group versus water, in the unbalanced panel (Panel A) and the balanced one (Panel B). The vertical red lines indicate the start of the periods in which the tax was being discussed, approved, and finally implemented (see the next section). The graphs display similar patterns for water and each of the treatment groups in the pre-tax period, suggesting that the parallel-trends assumption holds (i.e. that water is a good comparison group). Overall, the price of water is constant over the entire period under analysis (left-hand side graphs), at slightly less than 50 euro cents per liter, on average; quantity of water sold also exhibits a flat trend but with some seasonality (right-hand side graphs). All product groups show clear increases in prices when the tax is implemented —especially in the unbalanced panel—, but no clear changes in quantities sold.
Figures 1-4 here
4
Empirical strategy
4.1
Difference-in-differences model
We apply difference-in-differences models to compare each treated product group (P G) to Water, the comparison group (section 3). In the following econometric specification, q denotes the quarter (Feb-Apr 2015 through Nov 2017-Jan 2018), i the product (e.g. 33-centiliter can of Pepsi, 1.5-liter bottle of Pepsi, 1.5-liter bottle of Luso water), s the store (each of 400+ stores), m the month of the year (Jan, Feb, ..., Dec), and r the region (North, Center, South, or Madeira):
yq,i,s,m,r = β1Under Discussionq× PGi+ β2Under Approvalq× PGi+ β3Implementationq× PGi +λq+ αi,s+ δm,r+ εq,i,s,m,r (1)
The dependent variable, y, is either price (in euros per liter) or the natural logarithm of quantity sold. The natural logarithm accounts for the skewness in the distribution of sales volume and allows us to interpret consumption responses in percentage.
We compare the pre-treatment period (Feb 2015-Apr 2016) with three distinct post-treatment periods: 1) U nderDiscussion, the two quarters between May and October 2016, when the tax was only being discussed in the media, 2) U nderApproval, the quarter between November 2016 and January 2017, when the tax was formally proposed and debated in the parliament, and 3) Implementation, from February 2017 onwards, when the tax was actually in place (Figure 5). The parameters of interest are represented by βj.
Figure 5 here
In the previous section, we motivate the use of bottled water as the comparison group. We also test the parallel-trends assumption formally (see next section). In addition, the different vectors of fixed effects included in Equation 1 control for potential confounders that may hinder the identification of the causal impact of the soda tax. Quarter fixed effects (λq) control for aggregate trends related for example to the business cycle. Product-store fixed effects (αi,s) account for unobserved factors that may impact specific products or stores, such as preferences, competition, and other local characteristics. We also include month-region fixed effects (δm,r) to control for seasonality. In the tables presented in the results section and in the Appendix, Equation 1 corresponds to specification (3). Specification (1) controls only for quarter, product, and store fixed effects (not product-store fixed effects), and specification (2) controls only for quarter and product-store fixed effects.
Since the models include various (large) vectors of fixed effects, we estimate them using the user-written Stata module reghdfe [Correia, 2017]. Standard errors are clustered at the brand level to accommodate any serial correlation across different container sizes of the same product, that may for example be substitutes [Bertrand et al., 2004].
4.2
Event study design
We complement the previous strategy with event studies. The econometric specification is similar, except that it includes interactions between the treatment group and every quarter:
yq,i,s,m,r= X
(βqQuarterq× PGi) + λq+ αi,s+ δm,r+ εq,i,s,m,r (2)
The omitted quarter is Feb-Apr 2016, before the first news piece on the soda tax. Again, the parameters of interest are represented by βj and standard errors are clustered at the brand level. The event study design presents two key advantages beyond the difference-in-differences model. First, it is a way of formally testing the parallel-trends assumption. That is, we may test if prices or consumption of soda and water displayed similar patterns in the pre-tax period. If so, then it is reasonable to believe that prices or consumption patterns of bottled water in the post-tax period represent a good counterfactual for what would be the price or consumption patterns of soda, had there been no tax. Second, with event study specifications we may look at the dynamics in more detail, distinguishing between short- and medium-run responses to the tax.
5
Results
5.1
Difference-in-differences baseline results
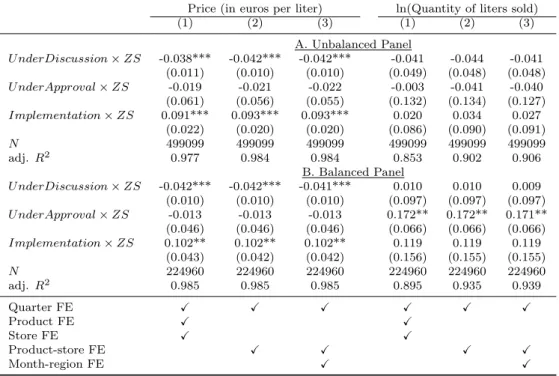
We present the difference-in-differences results for price (in euros per liter) and ln(quantity of liters sold), based on three alternative specifications. Results for ln(price) are presented in Table A2 in the Appendix, for comparison. Overall, all specifications give similar results. We focus on the most conservative one, specification (3), which includes quarter, product-store, and month-region fixed effects, as specified in Equation (1). We present results based on the unbalanced panel (Panel A) and the balanced one (Panel B).
Starting with High Sugar drinks, we find that when the tax was implemented, and compared to one year earlier, before the tax was ever mentioned, prices increased by 16 cents on average, vis-`a-vis water prices (Panel A of Table 2). The price increase is slightly larger, at 17 cents, when
considering only the most popular products (Panel B). This increase is consistent with pass-through to consumer prices below but not too far from 100%.
Regarding sales, the point estimates suggest a 8% drop in the Under Discussion period, consistent with an awareness effect, and a 6% drop in the Implementation period. However, these effects are imprecisely estimated and not statistically different from zero. In the balanced panel, which includes only the most popular products, we find a statistically significant 19% increase in sales in the Under Approval period, right before the tax was implemented. This suggests a stockpiling effect, whereby consumers may have purchased large quantities of these drinks in anticipation of the price increase due to the tax in the following quarter.
Table 2 here
Moving on to Medium Sugar drinks, we see that the average increase in prices is less pronounced than in the case of High Sugar drinks, at 15 cents per liter (Panel A of Table 3). In this case, the price increase corresponds to pass-through to consumer prices well above 100% (the tax amounts to about 10 cents when including VAT). This may reflect, at least in part, additional costs borne by producers related to product reformulation, repackaging, and brand repositioning, as drinks in this group went through recipe reformulations to fall bellow the 80 grams of sugar per liter threshold (section 3). Regarding sales, the only estimate worth notice is a 24% increase in the quarter prior to the tax implementation in the balanced panel (again, a stockpiling effect; Panel B).
Table 3 here
Regarding Low Sugar drinks, prices increased by 15-16 cents per liter, on average, which again corresponds to more than the amount of the tax (Table 4). In this case, we do find significant drops in consumption in both the Under Discussion and Implementation periods; as much as a 18% drop in the unbalanced panel. One possible explanation is increased awareness that drinks
with added sugar in general are bad for health, whereas Cola-flavored drinks (in the High Sugar group) have always been perceived as unhealthy. An alternative explanation is that drinks with comparatively less sugar may be less addictive, which may translate into a more elastic demand compared to drinks with more sugar. In the balanced panel, once again we find a surge in sales in the quarter prior to implementation.
Table 4 here
Lastly, for Zero Sugar drinks, we find about 100% price pass-through (Table 5). Looking at the balanced panel, we find a statistically significant increase in consumption in the Under Approval period, in line with our findings for the other drink groups. In addition, the point estimate for the Implementation interaction term indicates a 12% increase in sales, suggestive of a substitution effect towards artificially-sweetened beverages, but it is not statistically different from zero due to a large standard error.
Table 5 here
5.2
Internal
validity:
event
studies,
before-after
analyses,
and
falsification tests
We test the internal validity of our results by estimating event study specifications, as shown in Equation (2), before-after models, and by conducting a placebo test.
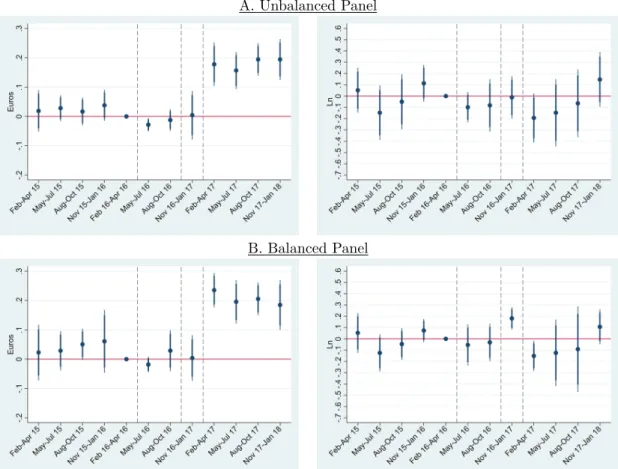
Event study results are shown in Figures 6 through 9, where the top panels display the results for the unbalanced panel and the bottom panels display the results for the balanced panel. We present both 90% and 95% confidence intervals. As a reminder, the omitted quarter is February-April 2016, before the first news piece on the soda tax.
difference-in-differences results, as confidence intervals for pre-treatment period interactions include the value zero. In addition, we highlight two main findings, looking at these plots. First, for any group of drinks, price increases appear mostly stable along the four quarters of the Implementation period. Second, in the High Sugar group, we find that consumption did decrease in the first quarter of the Implementation period, specially in the balanced panel, where we also find evidence of stockpiling in the pre-implementation quarter. However, consumption quickly returned to previous levels, resulting overall in the non-significant 6% drop that we find in the difference-in-differences results.
Tables A3 through A7 in the Appendix show the results of before-after analyses (i.e. no comparison group) for every drink group, including water. Note that in these specifications there are no quarter fixed-effects, which would be collinear with the U nderDiscussion, U nderApproval, and Implementation dummies. Therefore, we focus on specification (3), which controls for seasonality. Overall, the results are in line with those from the difference-in-differences models, in terms of sign, magnitude, and statistical significance. The before-after analyses for Water don’t show any impacts of the tax, in accordance with our hypothesis that bottled water is an appropriate comparison group.
We also considered quantities sold at the brand level, i.e. aggregating sales volume of all container sizes of the same drink (and in some cases, different flavors) in the same store and month, to account for potential substitution between sizes/flavors. Results shown in Figure A2 in the Appendix are very similar to those presented in this section, but noisier given the smaller sample. We explore further potential heterogeneous effects by size in section 5.4.
Figures 6-9 here
Our placebo test consists in estimating Equation (1) only with data for the pre-treatment period (i.e., February 2015-April 2016). We estimate the difference-in-differences model pretending the tax is implemented in the quarter before the first news piece on the soda tax. As expected, results indicate non-significant impacts of the fake tax introduction (Table A8).
5.3
Robustness checks
Our first robustness check consists in adding sparkling water to the comparison group, as a means to enlarge sample sizes and eventually obtain more precise estimates. Our go-to comparison group did not include sparkling water because, contrary to other countries, in Portugal sparkling water has little expression. Results are virtually unchanged by this enlargement of the comparison group (Table A9).
Second, we acknowledge that consumers may have different elasticities regarding popular multinational brands and the retailer’s own brand products. We test the sensitivity of our findings to the exclusion of the retailer’s own brand products. Third, we consider potential cross-border shopping as a means to avoid higher tax-induced prices in Portugal, and exclude from the sample stores close to the border with Spain (within a 30km distance). Some studies on soda taxes in the US find evidence of cross-border shopping (see Introduction). Neither excluding own brand products nor excluding stores close to Spain impacts visibly our main findings (Table A10).
Fourth, we distinguish between the impacts of the soda tax in the Lisbon and Oporto metropolitan areas versus the rest of the country. Excluding observations from the most urban and densely populated areas in the country also gives very similar results (Table A11).
5.4
Is there substitution from large to smaller container sizes?
Consumers may react to the introduction of the soda tax by substituting from large to smaller container sizes, compensating for the increase in price by reducing quantity purchased, in liters. To test this hypothesis, we split the treatment groups into <1 liter and 1+ liters container sizes. The comparison group is unaltered. Results are reported in Table A12. For all product groups, consumption of larger packages is hit in a more severe way; the exception is Low Sugar products in the balanced panel, where point estimates are virtually the same. These findings are in line with the findings of Castell´o and L´opez-Casasnovas [2018]. In some cases, the differential impact of the tax implementation on consumption may partly reflect different price increases in the two groups. Yet, even in the Under Discussion period, when prices don’t change substantially in economic terms, we see larger drops in the consumption of large container sizes. This suggests
that heavier soda consumers are the main ones reducing consumption. For more sugary drinks (HS and M S), consumption tends to increase in the Under Approval period, especially for larger packages, consistent with the idea of stockpiling.
6
Discussion
A recent WHO report called for the introduction of taxes on SSBs in developed countries [World Health Organization, 2016]. In particular, WHO recommended that to be effective in reducing consumption, a soda tax should result in at least 20% increase in retail prices. One of the arguments to introduce soda taxes is to improve consumer diets through the reduction of sugar intake from soda. Determining the impact of soda taxes on consumption can only be done empirically, as in theory there are several mechanisms that may entail both positive and negative effects. Those mechanisms include the elasticity of consumption to soda prices, changes in recipes, and amplified consumer awareness of the detrimental health effects of sugar and soda. Understanding better these mechanisms is also key to inform the design of more efficient public policies [Cornelsen and Smith, 2018].
Portugal introduced a soda tax in February 2017, levied on producers. The amount of the tax is 0.08 euros (+VAT) per liter for drinks with less than 80 grams of sugar per liter, and 0.16 euros (+VAT) per liter for drinks with more than 80 grams of sugar per liter. We study the impacts of this tax on prices and consumers’ purchasing behavior. First, we find substantial pass-through of the tax to consumer prices: almost 100% for drinks with more than 80 grams of sugar per liter, more than 100% for drinks with less sugar, and about 100% for artificially-sweetened beverages (average price increases of about 16%, 19%, and 8% respectively, compared to water). One possible reason underlying price overshooting for drinks with less than 80 grams of sugar per liter (Medium Sugar, Low Sugar, as well as Zero Sugar drinks) is costs associated with product reformulations. Another explanation may be that producers don’t think consumers pay attention to the sugar threshold and thus raise the price of all drinks equally. We also find slight price decreases when the tax first started to be discussed, almost one year before it was implemented (2-5 euro cents per liter, depending on the drink group), so the price increases when the tax came into effect are
also compensating for that.
Second, regarding consumption, our results suggest limited impacts of the tax. We do find a significant and substantial drop in consumption of drinks with comparatively lower sugar content (-18%). For drinks with very high sugar content, the point estimate suggests a 6% drop in consumption, but it is not estimated with enough precision to be statistically significant. Moreover, event study results show an immediate drop in consumption that quickly rebounds. Consumption of Medium Sugar drinks is also not significantly affected. Possibly, the drop in consumption of drinks with low sugar content might be explained by increased awareness that these drinks are also bad for health —whereas Cola-flavored and other drinks with medium-high sugar contents have always been perceived as unhealthy. Moreover, drinks with low sugar content are relatively less addictive and easier to quit.
These findings suggests that the main benefits of the soda tax in terms of reducing sugar intake are mainly through product reformulations. As we document in the Introduction, producers reduced the sugar content of several drinks to fall below the 80 grams per liter threshold. In fact, the Portuguese government introduced a new soda tax breakdown in 2019. In short, drinks with relatively less sugar, light, and zero products, are now subject to a lower tax, whereas drinks with high sugar content pay an aggravated tax. This new design is expected to further promote product reformulations towards lower sugar content. These changes are outside of our period of analysis but are worth studying in future research. Possibly because in Portugal artificially-sweetened beverages are also taxed, we find no significant evidence of substitution towards this type of drinks.
It is worth mentioning that even though it appears that producers are able to increase prices without significantly impacting demand (i.e., demand for most soda products appears rather inelastic), they still bother with product reformulations. This may be to accommodate consumers’ increasing preferences for healthier options, as well as to come progressively closer to targets negotiated with the government in May 2019, or even in anticipation of the new tax brackets [Expresso, 2019].
As far as awareness is concerned, in most cases we find a slight decrease in consumption when the tax first started to be mentioned in the media, but the estimates are not precisely estimated
and are not significantly different from zero.
Lastly, consumers appear to have engaged in stockpiling of the most widely consumed products in the quarter prior to the tax implementation. This is not a surprising finding in the context of Portugal. For example, in 2019 fuel truck drivers have been striking and when a new strike is announced, consumers run to gas stations [SIC Not´ıcias, 2019].
The comparison between previous findings and ours is not straightforward, as we split drinks into different groups. The drop in consumption of low sugar drinks is somewhere in the middle of the range of prior studies’ estimates. Overall, it is important to note that although we do not find statistically significant results for most drink groups, our estimates are more conservative than most, as we include in our main specification product-store fixed effects, and our standard errors are clustered at the brand level.
To conclude, the Portuguese soda tax has two main distinctive features: it depends on sugar content, taxing more heavily drinks with a lot of sugar, and artificially-sweetened beverages are also taxed. Due to its structure, the Portuguese soda tax led producers to reformulate many recipes towards lower sugar content. This seems to have been the main channel through which the tax reduced sugar intake from soda [Goiana-da Silva et al., 2018]. This finding is in line with recent developments in soda taxes worldwide, with not only Portugal but also France introducing more tax brackets in 2019 and 2018 respectively, and for example the UK structuring its 2018 soda tax in a similar manner. We believe that our results are of practical relevance not only for policymakers planning to implement similar taxes in other countries but also for countries or regions that have very recently introduced bracketed soda taxes.
References
A. Aguilar, E. Gutierrez, and E. Seira. The effectiveness of sin food taxes: evidence from Mexico. LACEA Working Paper Series, 0010, 2018.
H. Allcott, B. B. Lockwood, and D. Taubinsky. Should we tax sugar-sweetened beverages? An overview of theory and evidence. Journal of Economic Perspectives, 33(3):202–227, 2019a.
H. Allcott, B. B. Lockwood, and D. Taubinsky. Regressive sin taxes, with an application to the optimal soda tax. Quarterly Journal of Economics, 134(3):1557–1626, 2019b.
R. Alsukait, P. Wilde, S. N. Bleich, G. Singh, and S. C. Folta. Evaluating Saudi Arabia’s 50% carbonated drink excise tax: Changes in prices and volume sales. Economics and Human Biology, 38:100868, 2020.
M. Andal´on and J. Gibson. The ‘soda tax’ is unlikely to make Mexicans lighter or healthier: new evidence on biases in elasticities of demand for soda. Munich Personal RePEc Archive, 86370, 2018.
J. C. Arteaga, D. Flores, and E. Luna. The effect of a soft-drink tax in Mexico: a time series approach. MPRA Working Paper, (80831), 2017.
BBC News. Irn Bru panic as fans stockpile before recipe change, jan 2018. URL https://www.bbc.com/news/uk-scotland-glasgow-west-42565363.
N. Berardi, P. Sevestre, M. T´epaut, and A. Vigneron. The impact of a ‘soda tax’ on prices: evidence from French micro data. Applied Economics, 48(41):3976–3994, 2016.
U. M. Bergman and N. L. Hansen. Are excise taxes on beverages fully passed through to prices? The Danish evidence. Working paper, 2017.
M. Bertrand, E. Duflo, and S. Mullainathan. How much should we trust differences-in-differences estimates? The Quarterly Journal of Economics, 119(1):249–275, 2004.
B. Bollinger and S. E. Sexton. Local excise taxes, sticky prices, and spillovers: evidence from Berkeley’s soda tax. Working paper, 2018.
S. Capacci, O. Allais, C. Bonnet, and M. Mazzocchi. The impact of the French soda tax on prices and purchases. An ex post evaluation. PLoS ONE, 14(10):e0223196, 2019.
J. C. Caro, P. Valizadeh, A. Correa, A. Silva, and S. W. Ng. Combined fiscal policies to promote healthier diets: Effects on purchases and consumer welfare. PLoS ONE, 15(1):e0226731, 2020.
J. V. Castell´o and L´opez-Casasnovas. Impact of SBB taxes on consumption. CRES-UPF Working Paper, 201804(110), 2018.
J. Cawley and D. E. Frisvold. The pass-through of taxes on sugar-sweetened beverages to retail prices: the case of Berkeley, California. Journal of Policy Analysis and Management, 36(2): 303–326, 2017.
J. Cawley, C. Crain, D. Frisvold, and D. Jones. The pass-through of the largest tax on sugar-sweetened beverages: the case of Boulder, Colorado. NBER Working Paper Series, 25050, 2018a.
J. Cawley, B. Willage, and D. Frisvold. Pass-through of a tax on sugar-sweetened beverages at the Philadelphia International Airport. Journal of the American Medical Association, 319(3): 305–306, 2018b.
J. Cawley, D. Frisvold, A. Hill, and D. Jones. The impact of the Philadelphia beverage tax on purchases and consumption by adults and children. Journal of Health Economics, 67, 2019.
Coca-Cola Portugal. Qual a quantidade de a¸c´ucar existente nos refrigerantes?, 2020. URL http://perguntaserespostas.cocacolaportugal.pt/acucar-refrigerantes#.XuIj5S2ZNQJ.
M. A. Colchero, J. C. Salgado, M. Unar-Mungu´ıa, M. Hern´andez- ´Avila, and J. A. Rivera-Dommarco. Economics and Human Biology Price elasticity of the demand for sugar sweetened beverages and soft drinks in Mexico. Economics and Human Biology, 19:129–137, 2015.
M. A. Colchero, B. M. Popkin, J. A. Rivera, and S. W. Ng. Beverage purchases from stores in Mexico under the excise tax on sugar sweetened beverages: observational study. British Medical Journal, 352(h6704), 2016.
M. A. Colchero, M. Molina, and C. M. Guerrero-l. After Mexico implemented a tax, purchases of sugar-sweetened beverages decreased and water increased: difference by place of residence, household composition, and income level. Journal of Nutrition, (15):1552–1557, 2017.
L. Cornelsen and R. D. Smith. Viewpoint: Soda taxes – Four questions economists need to address. Food Policy, 74:138–142, 2018.
S. Correia. Linear models with high-dimensional fixed effects: an efficient and feasible estimator. Working paper, (March), 2017. URL http://scorreia.com/research/hdfe.pdf.
H. Cremer, C. Goul˜ao, and J. M. Lozachmeur. Soda tax incidence and design under monopoly. Toulouse School of Economics Working Papers, 992, 2019.
J. Debnam. Selection effects and heterogeneous demand responses to the Berkeley soda tax vote. American Journal of Agricultural Economics, 99(5):1172–1188, 2017.
DECO PROTESTE. Pre¸cos nos supermercados: Jumbo volta a ganhar, 2018. URL
https://www.deco.proteste.pt/familia-consumo/supermercado/noticias/precos-nos-supermercados-jumbo-volta-a-ganhar.
C. M. dos Santos. Imposto sobre as bebidas n˜ao alco´olicas adicionadas de a¸c´ucar ou outros edulcorantes: Qual efetividade? Uma an´alise explorat´oria. Masters thesis, Universidade Nova de Lisboa, 2018.
P. Dubois, R. Griffith, and M. O. Connell. How well targeted are soda taxes? Working paper, 2018.
F. Etil´e and A. Sharma. Do high consumers of sugar-sweetened beverages respond differently to price changes? A finite mixture IV-tovit approach. Health Economics, 24:1147–1163, 2015.
F. Etil´e, S. Lecocq, and C. Boizot-szantai. The incidence of soft-drink taxes on consumer prices and welfare: evidence from the French ‘soda tax’. PSE Working Papers, 2018(24), 2018.
Expresso. Sumos e refrigerantes v˜ao ter imposto extra, may 2016. URL
https://expresso.pt/sociedade/2016-05-28-Sumos-e-refrigerantes-vao-ter-imposto-extra#gs.ziLEots6.
Expresso. Acordo da Sa´ude com a ind´ustria alimentar: sal e a¸c´ucar v˜ao ser reduzidos em 2000 produtos, may 2019. URL
J. Falbe, N. Rojas, A. H. Grummon, and K. A. Madsen. Higher retail prices of sugar-sweetened beverages 3 months after implementation of an excise tax in Berkeley, California. American Journal of Public Health, 105(11):2194–2201, 2015.
J. Falbe, H. R. Thompson, C. M. Becker, N. Rojas, C. E. Mcculloch, and K. A. Madsen. Impact of the Berkeley excise tax on sugar-sweetened beverage consumption. American Journal of Public Health, 106(10):1865–1871, 2016.
E. A. Finkelstein, C. Zhen, M. Bilger, J. Nonnemaker, A. M. Farooqui, and J. E. Todd. Implications of a sugar-sweetened beverage (SSB) tax when substitutions to non-beverage items are considered. Journal of Health Economics, 32(1):219–239, 2013.
Global Food Research Program UNC. Sugary drink taxes around the world, 2019. URL https://www.dropbox.com/s/bqbj501wgocor24/UNCGFRP SSB tax maps.pdf?dl=0.
F. Goiana-da Silva, A. M. Nunes, M. Miraldo, A. Bento, J. Breda, and F. F. Ara´ujo. Using pricing policies to promote public health: the sugar sweetened beverages taxation experience in Portugal. Acta M´edica Portuguesa, 31, 2018.
C. Gomo and L. Birg. The economic and health impact of a tax on sugar sweetened beverages (SBBs) in South Africa. cege Discussion Papers, 356, 2018.
J. Grogger. Soda taxes and the prices of sodas and other drinks: evidence from Mexico. American Journal of Agricultural Economics, 99(2):481–498, 2017.
Grupo de Trabalho. Impacto do imposto especial sobre o consumo de bebidas a¸cucaradas e adicionadas de edulcorantes, 2018. URL
https://www.portugal.gov.pt/download-ficheiros/ficheiro.aspx?v=a3743967-dd85-4030-87a9-b92dd2d21d77.
M. Harding and M. Lovenheim. The effect of prices on nutrition: comparing the impact of product-and nutrient-specific taxes. Journal of Health Economics, 53:53–71, 2017.
Instituto Ricardo Jorge. Mais de 96% dos inquiridos em estudo consome ´
agua da rede p´ublica ou ´agua acondicionada, mar 2016. URL
Jornal Econ´omico. Quota de mercado da Sonae MC aproxima-se dos 22%, sep 2018. URL
https://jornaleconomico.sapo.pt/noticias/quota-de-mercado-da-sonae-mc-aproxima-se-dos-22-350698.
V. S. Malik, B. M. Popkin, G. A. Bray, J.-P. Despr´es, and F. B. Hu. Sugar-sweetened beverages, obesity, type 2 diabetes mellitus, and cardiovascular disease risk. Circulation, 121:1356–1364, 2010a.
V. S. Malik, B. M. Popkin, G. A. Bray, J.-P. Despr´es, W. C. Willett, and F. B. Hu. Sugar-sweetened beverages and risk of metabolic syndrome and type 2 diabetes. Diabetes Care, 33(11), 2010b.
T. Mora, E. Fichera, B. G. Lopez-valcarcel, and D. Roche. Do consumers respond to “sin taxes” heterogeneously? New evidence from the tax on sugary drinks using longitudinal scanner data. Working paper, 2018.
R. Nakamura, A. J. Mirelman, C. Cuadrado, N. Silva-Illanes, J. Dunstan, and M. Suhrcke. Evaluating the 2014 sugar-sweetened beverage tax in Chile: An observational study in urban areas. PLoS Medicine, 15(7), 2018.
S. A. Roache and L. O. Gostin. The untapped power of soda taxes: incentivizing consumers, generating revenue, and altering corporate behavior. International Journal of Health Policy Management, 6(9):489–493, 2017.
C. Rojas and E. Wang. Do taxes for soda and sugary drinks work? Scanner data evidence from Berkeley and Washington. Working paper, 2017.
S. Seiler, A. Tuchman, and S. Yao. The impact of soda taxes: pass-through, tax avoidance, and nutritional effects. Working paper, 2019.
SIC Not´ıcias. Corrida `as bombas de gasolina, apr 2019. URL https://sicnoticias.pt/economia/2019-04-16-Corrida-as-bombas-de-gasolina.
L. D. Silver, S. W. Ng, S. Ryan-ibarra, L. S. Taillie, M. Induni, D. R. Miles, J. M. Poti, and B. M. Popkin. Changes in prices, sales, consumer spending, and beverage consumption one year after a tax on sugar-sweetened beverages in Berkeley, California, US: A before-and-after study. PLoS Medicine, 14(4), 2017.
R. L. C. Taylor, S. Kaplan, S. B. Villas-boas, and K. Jung. Soda wars: the effect of a soda tax election on university beverage sales. Economic Inquiry, 57(3):1480–1496, 2019.
World Health Organization. Taxes on sugary drinks: why do it ?, 2016. URL
https://apps.who.int/iris/bitstream/handle/10665/260253/WHO-NMH-PND-16.5Rev.1-eng.pdf;jsessionid=15C8B910D43F10F475A6F57A020C8A0E?sequence=1.
D. Xiang, L. Zhan, and M. Bordignon. A reconsideration of the sugar sweetened beverage tax in a household production model. cesifo Working Papers, 7087, 2018.
Tables
Table 1: Soda taxes worldwide
Country Date of
implementation Tax rate
Includes diet soda?
Portugal February 2017
16 euro cents/L for drinks with > 80 g sugar/L, or 8 cents/L for drinks
with < 80 g sugar/L
Yes
France January 2012 7 euro cents/L Yes
Mexico January 2014 one peso/L No
Spain
(Catalonia) May 2017
12 euro cents/L for drinks with > 80 g sugar/L, or 8 cents/L for drinks
with 50 − 80 g sugar/L
No USA
(Berkeley, CA) March 2015 1 dollar cent/ounce No
USA
(Boulder, CO) July 2017 2 dollar cents/ounce Yes
USA
(Philadelphia, PA) January 2017 1.5 dollar cents/ounce Yes
Notes: Non-exhaustive. Source: Global Food Research Program UNC (2019).
Table 2: Effects of the soda tax on prices and quantities of High Sugar (HS) products sold: difference-in-differences results
Price (in euros per liter) ln(Quantity of liters sold)
(1) (2) (3) (1) (2) (3) A. Unbalanced Panel U nderDiscussion × HS -0.043** -0.040** -0.040** -0.087 -0.084 -0.084 (0.018) (0.015) (0.015) (0.051) (0.053) (0.051) U nderApproval × HS -0.009 -0.015 -0.016 0.019 -0.003 -0.005 (0.046) (0.048) (0.048) (0.086) (0.093) (0.093) Implementation × HS 0.156*** 0.159*** 0.160*** -0.071 -0.059 -0.065 (0.039) (0.034) (0.034) (0.075) (0.080) (0.080) N 647966 647966 647966 647966 647966 647966 adj. R2 0.974 0.980 0.980 0.846 0.899 0.904 B. Balanced Panel U nderDiscussion × HS -0.028* -0.028* -0.027* -0.034 -0.033 -0.034 (0.015) (0.015) (0.015) (0.059) (0.059) (0.059) U nderApproval × HS -0.029 -0.029 -0.029 0.190*** 0.190*** 0.189*** (0.057) (0.057) (0.057) (0.054) (0.054) (0.054) Implementation × HS 0.173*** 0.173*** 0.173*** -0.056 -0.056 -0.056 (0.052) (0.052) (0.052) (0.090) (0.090) (0.090) N 301075 301075 301075 301075 301075 301075 adj. R2 0.983 0.983 0.983 0.890 0.936 0.940 Quarter FE X X X X X X Product FE X X Store FE X X Product-store FE X X X X Month-region FE X X
Table 3: Effects of the soda tax on prices and quantities of Medium Sugar (MS) prod-ucts sold: difference-in-differences results
Price (in euros per liter) ln(Quantity of liters sold)
(1) (2) (3) (1) (2) (3) A. Unbalanced Panel U nderDiscussion × M S -0.033** -0.032** -0.031** -0.009 -0.022 -0.026 (0.015) (0.014) (0.014) (0.110) (0.107) (0.107) U nderApproval × M S 0.010 0.004 0.003 0.081 0.042 0.041 (0.027) (0.025) (0.025) (0.179) (0.184) (0.184) Implementation × M S 0.154*** 0.152*** 0.152*** 0.013 0.010 0.003 (0.023) (0.021) (0.021) (0.104) (0.112) (0.113) N 567786 567786 567786 567786 567786 567786 adj. R2 0.950 0.963 0.963 0.785 0.849 0.855 B. Balanced Panel U nderDiscussion × M S -0.050*** -0.050*** -0.050*** 0.049 0.049 0.049 (0.015) (0.015) (0.015) (0.098) (0.098) (0.098) U nderApproval × M S -0.017 -0.017 -0.017 0.239*** 0.239*** 0.239*** (0.017) (0.017) (0.017) (0.078) (0.078) (0.079) Implementation × M S 0.143*** 0.143*** 0.143*** 0.037 0.037 0.038 (0.018) (0.018) (0.018) (0.086) (0.086) (0.086) N 317611 317611 317611 317611 317611 317611 adj. R2 0.970 0.971 0.971 0.858 0.908 0.913 Quarter FE X X X X X X Product FE X X Store FE X X Product-store FE X X X X Month-region FE X X
Notes: Standard errors in parentheses clustered at the brand level. *p<0.1, **p<0.05, ***p<0.01.
Table 4: Effects of the soda tax on prices and quantities of Low Sugar (LS) products sold: difference-in-differences results
Price (in euros per liter) ln(Quantity of liters sold)
(1) (2) (3) (1) (2) (3) A. Unbalanced Panel U nderDiscussion × LS -0.017** -0.016** -0.016** -0.144** -0.150** -0.150** (0.006) (0.006) (0.006) (0.069) (0.065) (0.066) U nderApproval × LS -0.009 -0.011 -0.011 0.132 0.088 0.085 (0.013) (0.011) (0.011) (0.079) (0.089) (0.089) Implementation × LS 0.154*** 0.154*** 0.154*** -0.183** -0.184** -0.185** (0.026) (0.026) (0.025) (0.074) (0.077) (0.077) N 1107429 1107429 1107429 1107429 1107429 1107429 adj. R2 0.943 0.956 0.957 0.813 0.875 0.879 B. Balanced Panel U nderDiscussion × LS -0.019** -0.019** -0.019** -0.053 -0.053 -0.052 (0.007) (0.007) (0.007) (0.058) (0.058) (0.058) U nderApproval × LS -0.011 -0.011 -0.011 0.238* 0.238* 0.237* (0.012) (0.012) (0.012) (0.120) (0.120) (0.119) Implementation × LS 0.162*** 0.162*** 0.162*** -0.135* -0.134* -0.134* (0.025) (0.025) (0.025) (0.065) (0.065) (0.065) N 510064 510064 510064 510064 510064 510064 adj. R2 0.930 0.931 0.932 0.844 0.904 0.908 Quarter FE X X X X X X Product FE X X Store FE X X Product-store FE X X X X Month-region FE X X
Table 5: Effects of the soda tax on prices and quantities of Zero Sugar (ZS) products sold: difference-in-differences results
Price (in euros per liter) ln(Quantity of liters sold)
(1) (2) (3) (1) (2) (3) A. Unbalanced Panel U nderDiscussion × ZS -0.038*** -0.042*** -0.042*** -0.041 -0.044 -0.041 (0.011) (0.010) (0.010) (0.049) (0.048) (0.048) U nderApproval × ZS -0.019 -0.021 -0.022 -0.003 -0.041 -0.040 (0.061) (0.056) (0.055) (0.132) (0.134) (0.127) Implementation × ZS 0.091*** 0.093*** 0.093*** 0.020 0.034 0.027 (0.022) (0.020) (0.020) (0.086) (0.090) (0.091) N 499099 499099 499099 499099 499099 499099 adj. R2 0.977 0.984 0.984 0.853 0.902 0.906 B. Balanced Panel U nderDiscussion × ZS -0.042*** -0.042*** -0.041*** 0.010 0.010 0.009 (0.010) (0.010) (0.010) (0.097) (0.097) (0.097) U nderApproval × ZS -0.013 -0.013 -0.013 0.172** 0.172** 0.171** (0.046) (0.046) (0.046) (0.066) (0.066) (0.066) Implementation × ZS 0.102** 0.102** 0.102** 0.119 0.119 0.119 (0.043) (0.042) (0.042) (0.156) (0.155) (0.155) N 224960 224960 224960 224960 224960 224960 adj. R2 0.985 0.985 0.985 0.895 0.935 0.939 Quarter FE X X X X X X Product FE X X Store FE X X Product-store FE X X X X Month-region FE X X
Figures
Figure 1: Trends in prices and quantities sold: High Sugar versus Water A. Unbalanced Panel
B. Balanced Panel
Notes: Average price (in euros per liter) and ln(quantity of liters sold). Treatment: High Sugar. Comparison: Water. The vertical red lines indicate the start of the periods in which the tax was being discussed, approved, and finally implemented.
Figure 2: Trends in prices and quantities sold: Medium Sugar versus Water A. Unbalanced Panel
B. Balanced Panel
Notes: Average price (in euros per liter) and ln(quantity of liters sold). Treatment: Medium Sugar. Comparison: Water. The vertical red lines indicate the start of the periods in which the tax was being discussed, approved, and finally implemented.
Figure 3: Trends in prices and quantities sold: Low Sugar versus Water A. Unbalanced Panel
B. Balanced Panel
Notes: Average price (in euros per liter) and ln(quantity of liters sold). Treatment: Low Sugar. Comparison: Water. The vertical red lines indicate the start of the periods in which the tax was being discussed, approved, and finally implemented.
Figure 4: Trends in prices and quantities sold: Zero Sugar versus Water A. Unbalanced Panel
B. Balanced Panel
Figure 5: Timeline of events
Figure 6: Effects of the soda tax on prices and quantities of High Sugar products sold: event studies results
A. Unbalanced Panel
B. Balanced Panel
Notes: Dependent variables: price in euros per liter (left-hand side) and natural logarithm of quantity of liters sold (right-hand side). The vertical dashed lines indicate the start of the periods in which the tax was being discussed, approved, and finally implemented. 90% and 95% confidence intervals using standard errors clustered at the brand level.
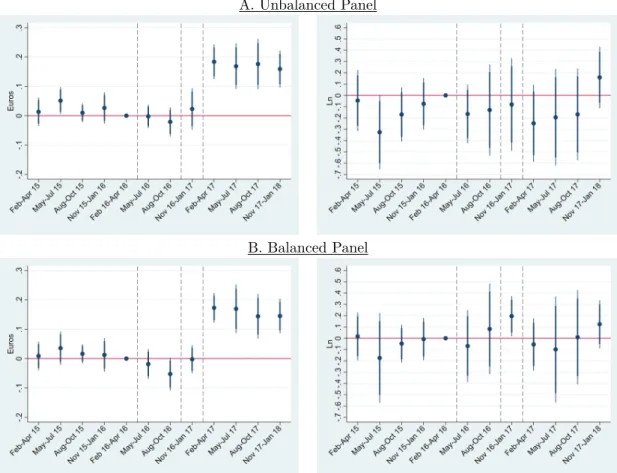
Figure 7: Effects of the soda tax on prices and quantities of Medium Sugar products sold: event studies results
A. Unbalanced Panel
B. Balanced Panel
Notes: Dependent variables: price in euros per liter (left-hand side) and natural logarithm of quantity of liters sold (right-hand side). The vertical dashed lines indicate the start of the periods in which the tax was being discussed, approved, and finally implemented. 90% and 95% confidence intervals using standard errors clustered at the brand level.
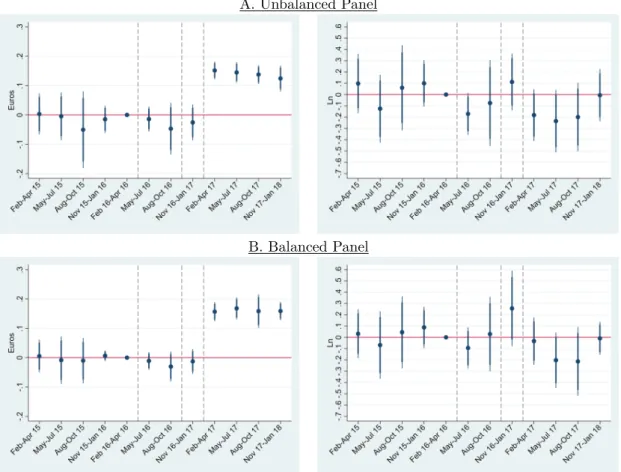
Figure 8: Effects of the soda tax on prices and quantities of Low Sugar products sold: event studies results
A. Unbalanced Panel
B. Balanced Panel
Notes: Dependent variables: price in euros per liter (left-hand side) and natural logarithm of quantity of liters sold (right-hand side). The vertical dashed lines indicate the start of the periods in which the tax was being discussed, approved, and finally implemented. 90% and 95% confidence intervals using standard errors clustered at the brand level.
Figure 9: Effects of the soda tax on prices and quantities of Zero Sugar products sold: event studies results
A. Unbalanced Panel
B. Balanced Panel
Notes: Dependent variables: price in euros per liter (left-hand side) and natural logarithm of quantity of liters sold (right-hand side). The vertical dashed lines indicate the start of the periods in which the tax was being discussed, approved, and finally implemented. 90% and 95% confidence intervals using standard errors clustered at the brand level.
Appendix
Table A1: Summary statistics by drink group and period, balanced and unbalanced panels
Price (in euros) Quantity sold (in liters)
Full Period Before Under Discussion Under Approval Implemented Full Period Before Under Discussion Under Approval Implemented
Feb 15-Jan 18 Feb 15-Apr 16 May 16-Out 16 Nov 16-Jan 17 Feb 17-Jan 18 Feb 15-Jan 18 Feb 15-Apr 16 May 16-Out 16 Nov 16-Jan 17 Feb 17-Jan 18 A. Unbalanced Panel
Comparison group: W ater
Average 0.42 0.41 0.42 0.42 0.43 1899.53 1863.68 2273.06 1479.55 1872.23 Std. dev. 0.30 0.27 0.28 0.28 0.33 5344.12 5354.86 6127.92 4232.96 5184.60 N 295359 114319 48036 26012 106992 295359 114319 48036 26012 106992 HighSugar(HS) Average 1.84 1.72 1.69 1.76 2.06 216.73 237.15 276.45 207.09 170.00 Std. dev. 1.61 1.60 1.62 1.56 1.61 1257.36 977.60 1980.30 1471.38 1045.77 N 352607 139868 57137 27071 128531 352607 139868 57137 27071 128531 M ediumSugar(M S) Average 1.00 0.95 0.91 0.96 1.10 228.25 221.28 251.94 227.33 224.03 Std. dev. 0.50 0.47 0.46 0.48 0.53 503.33 494.38 522.35 539.00 495.14 N 272427 109342 49568 19928 93589 272427 109342 49568 19928 93589 LowSugar(LS) Average 0.96 0.89 0.89 0.90 1.10 188.24 195.77 200.54 177.60 174.31 Std. dev. 0.62 0.59 0.58 0.59 0.65 420.58 445.79 446.95 374.06 380.54 N 812070 339566 145032 66716 260756 812070 339566 145032 66716 260756 ZeroSugar(ZS) Average 1.56 1.39 1.43 1.75 1.77 114.88 104.48 138.38 97.52 119.78 Std. dev. 1.10 0.98 1.10 1.17 1.18 308.02 248.93 381.67 258.54 339.73 N 203740 84955 32262 13436 73087 203740 84955 32262 13436 73087 B. Balanced Panel Comparison group: W ater
Average 0.43 0.43 0.43 0.43 0.43 2653.14 2622.62 3095.95 2217.50 2578.79 Std. dev. 0.27 0.27 0.27 0.27 0.27 6385.42 6411.21 7182.98 5383.30 6144.02 N 163881 68268 27318 13659 54636 163881 68268 27318 13659 54636 HighSugar(HS) Average 1.85 1.80 1.78 1.77 1.97 179.34 189.78 218.41 181.66 146.17 Std. dev. 1.77 1.82 1.81 1.69 1.70 363.29 395.26 485.00 334.04 230.60 N 137194 57142 22872 11436 45744 137194 57142 22872 11436 45744 M ediumSugar(M S) Average 1.03 1.00 0.95 0.98 1.14 304.21 287.46 354.79 294.26 302.32 Std. dev. 0.50 0.49 0.48 0.47 0.52 582.63 574.87 609.33 585.92 576.33 N 153730 64039 25626 12813 51252 153730 64039 25626 12813 51252 LowSugar(LS) Average 0.74 0.69 0.67 0.68 0.85 334.52 356.07 376.74 313.00 291.88 Std. dev. 0.31 0.30 0.28 0.29 0.30 574.21 613.89 627.50 503.57 504.43 N 346183 144184 57714 28857 115428 346183 144184 57714 28857 115428 ZeroSugar(ZS) Average 1.33 1.31 1.27 1.30 1.41 115.43 115.96 134.28 100.74 109.01 2
Table A2: Effects of the soda tax on prices: difference-in-differences results for ln(price) ln(Price) HS M S LS ZS A. Unbalanced Panel U nderDiscussion × P G -0.034*** -0.035* -0.019 -0.052*** (0.011) (0.017) (0.012) (0.011) U nderApproval × P G 0.008 0.009 -0.018 0.014 (0.019) (0.032) (0.014) (0.015) Implementation × P G 0.161*** 0.162*** 0.190*** 0.082* (0.053) (0.032) (0.024) (0.044) N 647966 567784 1107415 499099 adj. R2 0.985 0.973 0.966 0.987 B. Balanced Panel U nderDiscussion × P G -0.032** -0.062*** -0.033* -0.050*** (0.012) (0.015) (0.017) (0.007) U nderApproval × P G 0.015 -0.015 -0.021 0.017 (0.021) (0.023) (0.017) (0.018) Implementation × P G 0.213*** 0.149*** 0.226*** 0.133* (0.072) (0.033) (0.025) (0.073) N 301075 317611 510061 224960 adj. R2 0.988 0.981 0.965 0.986 Quarter FE X X X X Product-store FE X X X X Month-region FE X X X X
Notes: Standard errors in parentheses clustered at the brand level. *p<0.1, **p<0.05, ***p<0.01. P G stands for the following product groups: HS(HighSugar), M S(M ediumSugar), LS(LowSugar), and ZS(ZeroSugar).
Table A3: Effects of the soda tax on prices and quantities of High Sugar (HS) products sold: before-after results (no comparison group)
Price (in euros per liter) ln(Quantity of liters sold)
(1) (2) (3) (1) (2) (3) A. Unbalanced Panel U nderDiscussion -0.036* -0.029* -0.026 0.170*** 0.170*** 0.007 (0.018) (0.014) (0.018) (0.038) (0.043) (0.044) U nderApproval -0.000 -0.002 -0.029 -0.209* -0.196** -0.128 (0.042) (0.041) (0.040) (0.096) (0.097) (0.101) Implementation 0.174*** 0.179*** 0.178*** -0.017 -0.022 -0.057 (0.031) (0.024) (0.025) (0.051) (0.044) (0.043) N 383907 383907 383907 383907 383907 383907 adj. R2 0.960 0.969 0.970 0.790 0.851 0.862 B. Balanced Panel U nderDiscussion -0.025 -0.025 -0.019 0.221*** 0.221*** 0.061 (0.015) (0.015) (0.014) (0.055) (0.055) (0.036) U nderApproval -0.029 -0.029 -0.043 0.009 0.009 0.075 (0.058) (0.058) (0.067) (0.047) (0.047) (0.051) Implementation 0.172*** 0.172*** 0.172*** -0.036 -0.036 -0.068 (0.053) (0.053) (0.054) (0.075) (0.075) (0.072) N 137232 137232 137232 137232 137232 137232 adj. R2 0.978 0.977 0.978 0.797 0.874 0.887 Product FE X X Store FE X X Product-store FE X X X X Month-region FE X X
Table A4: Effects of the soda tax on prices and quantities of Medium Sugar (MS) products sold: before-after results (no comparison group)
Price (in euros per liter) ln(Quantity of liters sold)
(1) (2) (3) (1) (2) (3) A. Unbalanced Panel U nderDiscussion -0.022 -0.021 -0.019 0.197* 0.195* 0.064 (0.014) (0.014) (0.017) (0.094) (0.094) (0.088) U nderApproval 0.017 0.014 0.004 -0.172 -0.163 -0.080 (0.030) (0.028) (0.024) (0.201) (0.201) (0.204) Implementation 0.164*** 0.160*** 0.159*** 0.033 0.029 0.004 (0.025) (0.022) (0.021) (0.116) (0.116) (0.118) N 295284 295284 295284 295284 295284 295284 adj. R2 0.910 0.931 0.932 0.636 0.702 0.719 B. Balanced Panel U nderDiscussion -0.048** -0.048** -0.046** 0.303** 0.303** 0.141* (0.015) (0.015) (0.014) (0.099) (0.099) (0.065) U nderApproval -0.017 -0.017 -0.019 0.057 0.057 0.171** (0.016) (0.016) (0.017) (0.077) (0.077) (0.050) Implementation 0.143*** 0.143*** 0.143*** 0.056 0.056 0.030 (0.018) (0.018) (0.016) (0.071) (0.071) (0.062) N 153756 153756 153756 153756 153756 153756 adj. R2 0.950 0.951 0.952 0.749 0.807 0.829 Product FE X X Store FE X X Product-store FE X X X X Month-region FE X X
Notes: Standard errors in parentheses clustered at the brand level. *p<0.1, **p<0.05, ***p<0.01.
Table A5: Effects of the soda tax on prices and quantities of Low Sugar (LS) products sold: before-after results (no comparison group)
Price (in euros per liter) ln(Quantity of liters sold)
(1) (2) (3) (1) (2) (3) A. Unbalanced Panel U nderDiscussion -0.013* -0.013* 0.003 0.142** 0.134** -0.046 (0.007) (0.007) (0.013) (0.060) (0.058) (0.055) U nderApproval -0.012 -0.012 -0.015 -0.078 -0.082 0.046 (0.014) (0.012) (0.014) (0.071) (0.066) (0.066) Implementation 0.156*** 0.154*** 0.157*** -0.127** -0.137*** -0.166*** (0.025) (0.024) (0.027) (0.046) (0.042) (0.045) N 867422 867422 867422 867422 867422 867422 adj. R2 0.926 0.942 0.943 0.741 0.812 0.822 B. Balanced Panel U nderDiscussion -0.017** -0.017** -0.007 0.202*** 0.202*** 0.049 (0.007) (0.007) (0.011) (0.053) (0.053) (0.041) U nderApproval -0.012 -0.012 -0.024 0.057 0.057 0.167 (0.009) (0.009) (0.014) (0.118) (0.118) (0.102) Implementation 0.161*** 0.161*** 0.162*** -0.115** -0.115** -0.139*** (0.025) (0.025) (0.025) (0.041) (0.041) (0.043) N 346284 346284 346284 346284 346284 346284 adj. R2 0.891 0.892 0.895 0.783 0.852 0.863 Product FE X X Store FE X X Product-store FE X X X X Month-region FE X X
Table A6: Effects of the soda tax on prices and quantities of Zero Sugar (ZS) products sold: before-after results (no comparison group)
Price (in euros per liter) ln(Quantity of liters sold)
(1) (2) (3) (1) (2) (3) A. Unbalanced Panel U nderDiscussion -0.039** -0.042*** -0.034** 0.211*** 0.208*** 0.042 (0.014) (0.011) (0.014) (0.046) (0.045) (0.032) U nderApproval -0.020 -0.014 -0.036 -0.246 -0.243 -0.125 (0.064) (0.055) (0.052) (0.145) (0.147) (0.151) Implementation 0.093*** 0.097*** 0.097*** 0.043 0.053 0.021 (0.023) (0.019) (0.019) (0.067) (0.067) (0.064) N 217059 217059 217059 217059 217059 217059 adj. R2 0.966 0.974 0.975 0.760 0.821 0.836 B. Balanced Panel U nderDiscussion -0.039*** -0.039*** -0.035* 0.264** 0.264** 0.102 (0.010) (0.010) (0.016) (0.097) (0.097) (0.069) U nderApproval -0.013 -0.013 -0.014 -0.010 -0.010 0.075 (0.047) (0.047) (0.047) (0.062) (0.062) (0.076) Implementation 0.102* 0.102* 0.103* 0.138 0.138 0.108 (0.044) (0.044) (0.045) (0.152) (0.152) (0.145) N 61092 61092 61092 61092 61092 61092 adj. R2 0.980 0.980 0.981 0.733 0.814 0.835 Product FE X X Store FE X X Product-store FE X X X X Month-region FE X X
Notes: Standard errors in parentheses clustered at the brand level. *p<0.1, **p<0.05, ***p<0.01.
Table A7: Effects of the soda tax on prices and quantities of Water sold: before-after results
Price (in euros per liter) ln(Quantity of liters sold)
(1) (2) (3) (1) (2) (3) A. Unbalanced Panel U nderDiscussion 0.001 0.002 0.011*** 0.294*** 0.302*** 0.079 (0.002) (0.002) (0.003) (0.057) (0.055) (0.062) U nderApproval 0.001 0.004 -0.008 -0.201** -0.176* 0.085 (0.004) (0.003) (0.005) (0.082) (0.098) (0.122) Implementation 0.005 0.004 0.005 0.081 0.076 0.055 (0.005) (0.005) (0.005) (0.086) (0.093) (0.094) N 316925 316925 316925 316925 316925 316925 adj. R2 0.943 0.968 0.969 0.762 0.836 0.850 B. Balanced Panel U nderDiscussion 0.002 0.002 0.010** 0.254*** 0.254*** 0.036* (0.002) (0.002) (0.004) (0.026) (0.026) (0.018) U nderApproval -0.000 -0.000 -0.009* -0.182*** -0.182*** 0.013 (0.008) (0.008) (0.004) (0.029) (0.029) (0.021) Implementation -0.000 -0.000 0.000 0.019 0.019 -0.012 (0.006) (0.006) (0.006) (0.054) (0.054) (0.049) N 163908 163908 163908 163908 163908 163908 adj. R2 0.964 0.965 0.967 0.881 0.922 0.935 Product FE X X Store FE X X Product-store FE X X X X Month-region FE X X