M
ASTER IN
F
INANCE
M
ASTER
F
INAL
W
ORK
D
ISSERTATION
W
ORK
E
QUITY
R
ESEARCH
–
B
ANCO
P
ORTUGUÊS DE
I
NVESTIMENTO
M
ASTER IN
F
INANCE
M
ASTER
F
INAL
W
ORK
D
ISSERTATION
W
ORK
E
QUITY
R
ESEARCH
–
B
ANCO
P
ORTUGUÊS DE
I
NVESTIMENTO
J
OÃO
E
DUARDO
N
UNES
S
UPERVISION OFM
ASTER’
ST
HESIS:
ABSTRACT
During the last decades, it has been created and developed several mechanisms models of business valuation. These evaluation methods, some of them with a high level of technical complexity, aim to determine with the greatest degree of precision, the intrinsic value of a company. Generally, there is no right answer to the problem of valuation of companies. In my opinion, the evaluation process is closer to an art than a science. Which assumptions should be made, and what are the most adequate methods to follow is still on debate, after all this years. The aim of this dissertation is to identify featuring the key methods presented by the literature, in order to peek which of those are the most used ones, specifically with the purpose of an equity research about financial companies.
Keywords: Company Valuation, Discounted Cash Flow, Free Cash Flow to Equity, Enterprise Value, BPI.
RESUMO
Durante as últimas décadas, têm vindo a ser criados e desenvolvidos vários modelos de avaliação de empresas. Estes métodos de avaliação, alguns deles com um alto nível de complexidade técnica, têm por objetivo determinar com o melhor grau de precisão, o valor intrínseco de uma empresa. Geralmente, não há resposta certa para o problema da avaliação de empresas. Na minha opinião, o processo de avaliação está mais perto de uma arte do que uma ciência. Que suposições deveram ser feitas, e quais são os métodos mais adequados para seguir ainda continuam em debate, depois de todos esses anos. O objetivo desta dissertação é identificar caracterizando os principais métodos apresentados pela literatura, com o intuito de escolher os que são os mais utilizados, especificamente com o propósito de um equity research sobre empresas financeiras.
Palavras-chave: Avaliação de empresas, Cash Flow descontados, Free Cash Flow to Equity, Valor da Empresa, BPI.
ACKNOWLEDGMENTS
This dissertation was a culmination of an outstanding process of hard work and dedication, which would not have been possible to conclude without the support of all who accompanied me during these last months.
Firstly, I would like to express my sincere gratitude to my advisor Prof. Manuel Félix Cardoso for the continuous support and for its immense predisposition to help me overcome this important stage of my life. His guidelines helped me during all the time of the creation of this work.
Finally I would like to thank all my intimate persons by unqualified motivational support shown, throughout writing this thesis and my life in general.
INDEX
ABSTRACT ... I RESUMO ... II ACKNOWLEDGMENTS... III INDEX ... IV LIST OF ABBREVIATIONS ………VI INDEX OF FIGURES ……….………...VII INDEX OF TABLES ... VIII
1. INTRODUCTION ... 1
1.1FRAMEWORK ... 1
2 – LITERATURE REVIEW ... 2
2.1–VALUATION METHODS ... 2
2.1.1 - Discounted Cash Flow Valuation (DCF) ... 3
2.1.2 - Free Cash Flow to Equity (FCFE) ... 4
2.1.3 - Free Cash Flow to Firm (FCFF) ... 5
2.1.4 - Dividend Discount Model (DDM)... 6
2.1.5 - Residual Income (Excess return Model) ... 7
2.1.6 - Adjusted Present Value (APV) ... 7
2.1.7 The key inputs of DCF Valuation ... 8
2.1.8 – The WACC ... 8
2.1.9 – The Capital Asset Pricing Theory ... 9
2.1.10 – The cost of equity ... 9
2.1.11 – The risk free and equity premium ... 10
2.1.12 – The beta ... 10
2.1.13 – The cost of debt ... 11
2.1.14 – Relative Valuation ... 11
2.1.15 – Contigent Claim Valuation ... 12
2.2–WHICH IS THE BEST EVALUATION MODEL FOR A FINANCIAL COMPANY? ... 12
2.3–THE IMPORTANCE OF BANKS VALUATIONS ... 13
3 – COMPANY’S PRESENTATION ... 14
3.1-COMPANYOVERVIEW ... 14
3.2–HISTORY ... 15
3.3-SHAREHOLDERSTRUCTURE ... 17
3.4–FINANCIAL INDICATORS ... 17
3.5–PORTUGAL MACROECONOMIC CONTEXT ... 22
3.6–ANGOLA MACROECONOMIC CONTEXT ... 26
4 – Valuation ... 29
4.1–METHODOLOGY ... 29
4.2–ASSUMPTIONS AND VALUATION RESULTS ... 31
6 – Conclusion ... 34
7 – Bibliographic references ... 36
8 – Appendix ... 38
Table VIII - Domestic Ke ...38
Table IX - FCFE (Domestic) ...38
Table X – Present Value of CF (Domestic) ...38
Table XI – Enterprise Value (Domestic) ...39
Table XII - Country Risk Premium and Rating (Domestic) ...39
Table XIII - International Ke ...40
Table XIV – FCFE (International) ...40
Table XV – Present Value of CF (International) ...40
Table XVI – Enterprise Value (International) ...40
Table XVII - Country Risk Premium and Rating (International) ...41
Table XVIII – Tax Rate ...41
Table XIX – Effective Tax Rate Domestic ...42
Table XX – Effective Tax Rate International ...42
Table XXI - Benninga Model (Domestic) ...38
Table XXII - Benninga Model (BS Domestic) ...43
Table XXIII - Benninga Model (P&L Domestic) ...43
Table XXIV - Benninga Model (International) ...44
Table XXV - Benning Model (BS International) ...45
Table XXVI - Benninga Model (P&L International) ...45
Table XXVII - Re Average ...46
LIST OF ABBREVIATIONS
1H15 – 1st half of 2015
BCI – Banco Comercial e de Investimentos BdP – Bank of Portugal
BFA – Banco Fomento Angola
BPI – Banco Português de Investimento BC – Bankruptcy Costs
BS – Balance Sheet
CAPM – Capital Asset Pricing Model CF – Cash Flow
CRP – Country Risk Premium DCF – Discounted Cash Flow ECB – European Central Bank ERP – Equity Risk Premium FCFE – Free Cash Flow to Equity FCFF - Free Cash Flow to the Firm FY14 – Final year of 2014
FY15F – Final year of 2015 forecast GDP – Growth Domestic Product IMF – International Monetary Fund NI –Net Income
PV – Present Value ROE – Return on Equity ROA – Return on Assets TV – Terminal Value
INDEX OF FIGURES
Figure 1 – Discounted Cash Flow ... 3
Figure 2 – Equity Value (DCFE) ... 4
Figure 3 – Terminal Value ... 4
Figure 4 – Enterprise Value (DCFF) ... 5
Figure 5 – Terminal Value ... 5
Figure 6 – Equity Value (DDM) ... 6
Figure 7 – Terminal Value ... 6
Figure 8 – Residual Income ... 7
Figure 9 – PV (Adjusted Present Value) ... 8
Figure 10 – Weighted Average Cost of Capital ... 8
Figure 11 – Capital Asset Price Model ... 9
Figure 12 – Cost of Equity ... 9
Figure 13 –Beta ... 10
Figure 14 – Betla levered ... 11
Figure 15 – Beta levered ... 11
Figure 16 – The cost of debt ... 11
Figure 17 – ROE and ROA (consolidated) ... 18
Figure 21 – Portugal Unemplyment rate ... 24
Figure 22 – ECB risk free rate and Euribor ... 25
Figure 23 – Europe Brent Spot Price ... 26
INDEX OF TABLES Table I – Valuation Methods... 3
Table II – Shareholders owing more than 2% ... 17
Table III – Portugal GDP and inflation rate ... 23
Table IV – Angola GDP and inflation rate ... 27
Table V – Forecast Growth Rate of Loans and Deposits ... 32
Table VI – Sensitivity analysis with ∆ Country Risk Premium ... 33
1. INTRODUCTION
1.1 Framework
The valuation of a company is a complex process in which the primary objective is confined to the determination of its value in a certain fixed period of time, and precisely as possible. In this way, it can give all the information to those who need it, whether investors, shareholders, creditors or even to customers.
There are several methods of evaluation that can be used for both, financial and non-financial companies, but it is necessary to have a higher level of caution when applying them, because the results definitely will not lead to accurate values. This is due to the complexity and distinctiveness of financial institutions, such as the one that was chosen in this dissertation, the Portuguese bank BPI (Banco Português de Investimento). Given that a bank, income generation takes place through the assets and liabilities, making this type of business, adopt specific valuation models to their activity.
There are numerous methods of evaluation that have been developed in order to compute the intrinsic value of a company, but due to the fact mentioned above, in my opinion there exists a unique model that should obtaining consensus among the major investors and economists in order to evaluate a financial institution. Beside that, when evaluating a financial institution, it must should take into account the phase in which it is located and the context in which it is integrated, in other words, whether it is in a decrease or growth phase, what is the dividend policy, which is the macroeconomic situation of the country in which it operates and the entity itself, or even if it is an institution that is properly valued on the stock exchange.
This dissertation aim to demonstrate what was stated above, namely the evaluation of the countries activity context where the entity is allocated, the characteristics of the institution itself and the choice of the most credible model in order to obtain the most accurate possible value. Regarding the complexity and peculiarity of this subject, coupled with the desire to learn more about the evaluation of such institutions, were the main drivers for choosing this equity research about BPI.
According to Damodaran (2006), there are two main problems relative to this type of evaluation:
1st – The impossibility on determinate the cash flows without estimating the reinvestment.
2nd – In the case that the re-investment cannot be calculated, estimating the growth rate, will become a big problem to solve. Therefore, will be more accurate directly evaluate the equity of a banking institution.
2 – LITERATURE REVIEW
2.1 – Valuation Methods
According to Damodaran (2006) there are basically three categories, each of them having different valuation approaches which can be used:
a) Discounted Cash Flow Valuation: discounts the expected cash flow to the present value, at an adequate rate that can reflect the risk of it;
b) Relative Valuation: estimates the value of an asset focusing on asset pricing comparable on a common variable such as earnings, cash flow, book value or sales;
c) Contingent Claim: uses options pricing models to measure the value of assets that have option features.
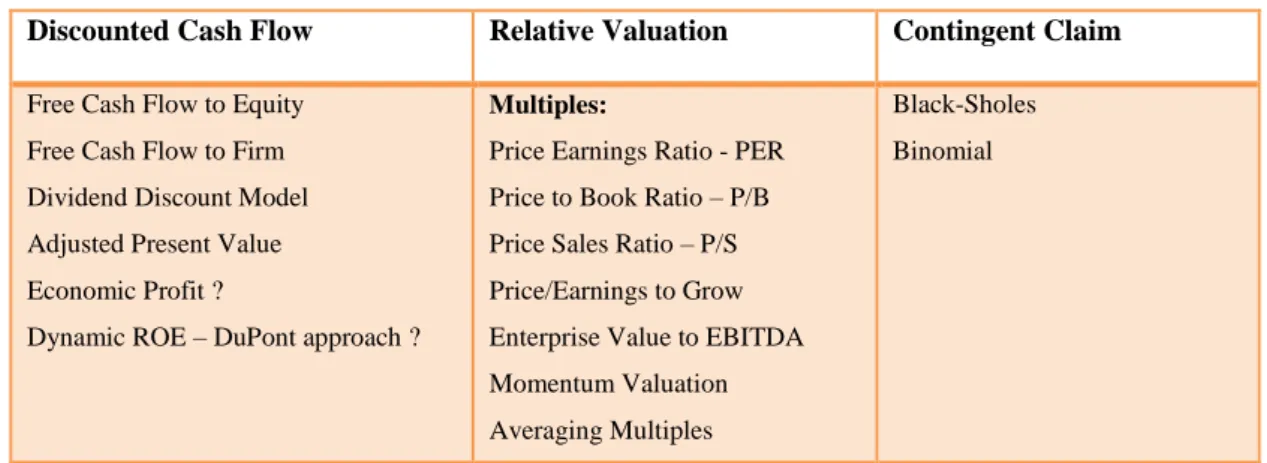
Table I – Valuation Methods
Discounted Cash Flow Relative Valuation Contingent Claim
Free Cash Flow to Equity Free Cash Flow to Firm Dividend Discount Model Adjusted Present Value Economic Profit ?
Dynamic ROE – DuPont approach ?
Multiples:
Price Earnings Ratio - PER Price to Book Ratio – P/B Price Sales Ratio – P/S Price/Earnings to Grow Enterprise Value to EBITDA Momentum Valuation Averaging Multiples
Black-Sholes Binomial
Source: Damodaran (2006 and 2012)
2.1.1 - Discounted Cash Flow Valuation (DCF)
The DCF model can be applied to any company, at any time, if it´s possible to predict its future cash flows, making this method one of the most attractive among the valuation methodologies. This method have four-variable analysis: The ability to generate future cash flow for the company's assets, the duration where the cash flow should be designed, during which it will be able to predict the behavior of the main variables (depending on the features of the business and the degree of predictability of its most relevant key components), the discount rate at which cash flows are discounted to present value and finally the determination of its residual value (perpetuity or terminal value, estimated based on the expectation of perpetual growth).
(1) 𝑉𝑎𝑙𝑢𝑒 = ∑ 𝐶𝐹𝑡
(1+𝑟)𝑡
𝑡=𝑛 𝑡=1
𝐶𝐹𝑡= Cash Flow in Period t
r = Discount rate reflecting the riskiness of the estimated Cash Flow 2.1.2 - Free Cash Flow to Equity (FCFE)
The FCFE is a measure that indicates how much cash can be paid to the equity shareholders. This calculation achieves the value of a bank institution for shareholders through the value of the discounted equity (the estimation of the residual value after the calculation of all operating expenses, reinvestment requirements, taxes and debt), at the cost of equity capital.
Formula A (companies in general)
Free Cash Flow to Equity = Net income – Capital Expenditures - ∆ Non-cash Working Capital + Depreciations and Amortizations + (New debt issued – Debt repayment) Formula B (financial services companies)
Free Cash Flow to Equity = Net income – Reinvestment in regulatory Capital When the equity cash flow is calculated it is discounted at 𝐾𝑒:
(2) 𝐸𝑞𝑢𝑖𝑡𝑦 𝑉𝑎𝑙𝑢𝑒 =𝐹𝐶𝐹𝐸1 1+𝐾𝑒 + 𝐹𝐶𝐹𝐸2 (1+𝐾𝑒)2+ ⋯ + 𝐹𝐶𝐹𝐸𝑛 +𝑇𝑉𝑛+1 (1+𝐾𝑒)𝑛 (3) 𝑇𝑉𝑛+1 = 𝐹𝐶𝐹𝐸𝑛 ×(1+𝑔) 𝐾𝑒−𝑔 Where,
FCFE, is the free cash flow to equity Ke, the cost of equity
TV, the terminal value
2.1.3 - Free Cash Flow to Firm (FCFF)
FCFF is the amount of the predicted cash generation to investors, after all operating expenses (including taxes) have been paid and needed investments in working capital and fixed capital have been made.
NOPAT + Depreciation and Amortization = Cash flow from Operations, Cash flow from Operations - ∆ NWC – CAPEX = Free Cash Flow to the Firm Where,
NOPAT is the net operating profit after taxes (equal to EBIT (1-T)) ∆ NWC are the changes in net working capital
CAPEX are the capital expenditures
In order to achieve the enterprise value, it’s necessary to sum up the free cash flows and the terminal value discounting them:
4) 𝐸𝑛𝑡𝑒𝑟𝑝𝑟𝑖𝑠𝑒 𝑉𝑎𝑙𝑢𝑒 = 𝐹𝐶𝐹𝐹1 1+𝑊𝐴𝐶𝐶+ 𝐹𝐶𝐹𝐹2 (1+𝑊𝐴𝐶𝐶)2+ ⋯ + 𝐹𝐶𝐹𝐹𝑛 +𝑇𝑉𝑛+1 (1+𝑊𝐴𝐶𝐶)𝑛 5) 𝑇𝑉𝑛+1 = 𝐹𝐶𝐹𝐹𝑛 ×(1+𝑔) 𝑊𝐴𝐶𝐶−𝑔 Where,
FCFF, is the free cash flow to the firm WACC, the weighted average cost of capital TV, the terminal value
2.1.4 - Dividend Discount Model (DDM)
The Dividend Discount Model is characterized by his simplicity and intuitive logic, in fact, according to Damodaran (2006) the older model based on discounted cash flow refers to the model of dividends.
It´s a virtuous model to use, assuming normal economic conditions, where are expected stability conditions over time. In order to valuing stock, it´s used the expected future dividends and discounting them back to present value. It´s important to refer that sometimes dividends distribution is not always linear, since companies may have punctual needs of investment with the aim of value creation, what may be translated in substantial reductions of dividends.
6) 𝐸𝑞𝑢𝑖𝑡𝑦 𝑉𝑎𝑙𝑢𝑒 =𝐸(𝐷𝑃𝑆1) 1+𝐾𝑒 + 𝐸(𝐷𝑃𝑆2) (1+𝐾𝑒)2+ ⋯ + 𝐸(𝐷𝑃𝑆𝑛)+𝑇𝑉𝑛+1 (1+𝐾𝑒)𝑛 7) 𝑇𝑉𝑛+1 = 𝐸(𝐷𝑃𝑆𝑛)×(1+𝑔) 𝐾𝑒 − 𝑔 Where,
𝐸(𝐷𝑃𝑆𝑡) are the expected dividends per share computed by multiplying Net income by
the Dividend Payout Ratio Ke, the cost of equity 𝑔, the growth rate
The method of discounted dividends is used too often to assess banking institution. According to Damodaran (2006) a company that is in high growth period can be assessed by the method of dividends even if isn´t paying dividends. However due to the current economic environment and present context of banking institutions, makes this assessment not credible.
2.1.5 - Residual Income (Excess return Model)
Is based on the remaining income after considering all costs inherent to the capital structure of a company, in other words, in terms of equity valuation residual income represents the income created by a firm after accounting for the real cost of its capital. According to Damodaran (2006), the cash flow is divided into normal return cash flows, and in excess return cash flows, that can be positive or negative:
Equity Value = 𝐶𝑎𝑝𝑖𝑡𝑎𝑙 𝐼𝑛𝑣𝑒𝑠𝑡𝑒𝑑 𝑡=0 + PV excess return* CF from both existing and future project
PV excess return* is known as residual income
The residual income is calculated as follows, and discounted at the cost of equity: 8) 𝑅𝐼𝑡 = 𝑁𝐼𝑡 - 𝐾𝑒,𝑡 × 𝐵𝑜𝑜𝑘𝑡−1
Where,
RIt represents the residual income at time t Ke is the cost of equity
Bookt−1 is the book value of the firm on time t-1
2.1.6 - Adjusted Present Value (APV)
According to Damodaran (2002) and Fernández (2002) the adjusted present value approach, the firm´s value correspond to the unlevered company´s shareholders equity (taking into account that it is all financed with equity) 𝑉𝑢 , plus the present value tax benefits form debt and the expected bankruptcy costs:
Where the most consistent way to compute 𝑃𝑉𝑡𝑠 for a perpetuity growing at rate g according to Arzac and Glosten (2005), is through M&E method. The following equation discount the tax savings during the first year at 𝐾𝑑 and for the followings at 𝐾𝑢 , which is the cost of capital for the unlevered firm:
9) 𝑃𝑉𝑡𝑠 = 𝐷 × 𝑇 × 𝐾𝑑 × (1+ 𝐾𝑢)
(1+𝐾𝑑)(𝐾𝑢−𝑔)
According to Damodaran (2002), the effect level of debt on the default risk of the company is measured through the expected bankruptcy cost, and can be computed as follows:
Expected BC = Profitability of BC × PV of BC
In order to estimate the profitability of BC we can estimate for example through a bond rating for the company at each level of debt and use empirical data of default probabilities associated with each rating. Regarding the PV of BC they represent mostly lost opportunities and are very difficult to estimate, and therefor errors may occur on it.
2.1.7 The key inputs of DCF Valuation 2.1.8 – The WACC
The weighted average cost of capital, it´s a tax that measures the opportunity cost, or the return on invested capital required, it was formulated by Modigliani Miller and it expressed as: 10) 𝑊𝐴𝐶𝐶 = 𝐸 𝐸+𝐷× 𝑅𝑒 + 𝐷 𝐸+𝐷× 𝑅𝑑 × (1 − 𝑇) Where,
𝑅𝑒 and 𝑅𝑑are the cost of equity and debt T is the company´s marginal income tax rate
In order to be an accurate measure, the cost of equity must be estimated correctly. Therefore, the capital asset pricing model is used, regarding some assumptions about its components.
2.1.9 – The Capital Asset Pricing Theory
The CAPM is used in order to estimate the required rates of return of a specific investment, regarding his risk:
11) 𝐸(𝑅𝑖) = 𝑟𝑓 + 𝛽𝑖 × 〔𝐸(𝑅𝑚) − 𝑟𝑓〕
This formula is divided into two parts, in order to compensate the investor from the risk that he is exposed through the value of money. Therefore, the risk free interest rate accounts for the value of money, during the investment, in a certain period of time. The second one relies on the inherent risk exposure through a risk premium. The beta makes the relationship between the degrees of risk that the investors are expose to, reliant on the market where they are dealing.
2.1.10 – The cost of equity
Usually CAPM is used to estimate the cost of equity that reflects the expected return for equity investors. In crisis periods with unstable macroeconomic contexts, or with emergent markets, an additional extra risk must be taken into account. The country risk premium should be an extra component of this theory, as expressed bellow in following formula:
Where,
𝐾𝑒 is the cost of equity
𝐸(𝑅𝑖) is the expected return of the security
𝑟𝑓, is the risk free rate
𝛽𝑖 the stock´s sensitivity to the market
𝐸(𝑅𝑚) − 𝑟𝑓 represents the expected return of the market over risk free bonds
𝐶𝑅𝑃 is the country risk premium
2.1.11 – The risk free and equity premium
Following Damodaran (2006) the risk free interest rate, can be estimated comparing the expected return to long-term government securities, through the usage of treasury bonds, namely ten-year zero coupon bonds, since the time horizon is short.
Relating to the equity premium, according to Damodaran (2011), it can be calculated: a) Regarding on what equity premium investors and analysts usually require for
investing in equity in each country comparative to the risk free rate; b) Taking into account the premiums used historically;
c) Estimating a forward looking premium, backing out equity risk premium from market prices in the present.
2.1.12 – The beta
According to Fama & French (2004) the market beta for an asset is expressed as bellow: 13) βi,m=Cov(Ri,Rm)
σ2(R m)
Iit allow us to comprehend how an asset´s return shift relative to movements in the economy as a whole, reflecting the systematic risk, and a the sensitivity level a firm is
in this model since it´s diversifiable and ca be eliminated, known as unsystematic risk. According to Damodaran (2002) if the beta of debt is zero and if there are tax advantages which are originate form leverage, the beta would be:
14) βl= βu( 1 + ( 1 − T ) D
E )
If beta isn´t equal to zero: 15) βl= βu( 1 + ( 1 − T ) D
E ) - βd(1 − T ) × ( D E)
Where,
𝛽𝑙 is the levered beta for equity
𝛽𝑢 is the unlevered beta
T, is the corporate tax rate (𝐷
𝐸) is the debt to equity ratio
In sum, is predictable, that when leverage increases, the risk is higher and so as the beta.
2.1.13 – The cost of debt
The cost of debt can be described as the return lenders expect from his investments, plus a premium for default risk, depending on the riskiness of the company.
16) 𝐾𝑑 = 𝑟𝑓+ Default spread
2.1.14 – Relative Valuation
According to Damodaran (2006) in relative valuation, we measure the value of an asset based upon comparable assets that are priced in the same industry. Implicitly it´s assumed that a comparable firm has similar expected cash flow, growth rate and risk. There exist three steps in this valuation technique: first find comparable assets, then
multiple approach being simple and easy to work with, for the purpose of this dissertation, this type of valuation doesn´t make sense to apply since in the banking industry, each bank it´s not comparable one with each other, since objectives, strategies, structures, regulatory standards, market capitalization, growth rates diverge a lot, and this facts can lead into higher estimation errors. For example according to Fernandez (2001) the dispersion between multiples as PER, P/B and ROE of Portuguese/Spanish banks is quite high.
2.1.15 – Contigent Claim Valuation
This method have a principle behind it, where the occurrence or not of an event is contingent with the value of an asset. This approach uses option pricing models in order to measure the value of assets with option characteristics.
Since is not normally used for evaluating the stock value of financial institutions, this method will not be applied or discussed.
2. 2 – Which is the best evaluation model for a financial company?
To answer this question we can evaluate the model through accuracy and applicability criteria’s.
The criterion of accuracy, aims to measure the ability of a model to determine the fair value of a company. The smaller the difference between the estimated price (by applying a model) and the fair price of the company, the greater the accuracy of the model. Nevertheless, it is not easy to measure this difference objectively, taking into account that the application of any valuation model requires the design of assumptions about the future behaviour of several variables. These estimates are prepared by analysts. They use information analysis and perceptions, which in general are different
from one to another. A standard evaluation of the same entity may drive to different values as well, although using the same evaluation model. Another factor to consider is the fair value of the company, which is only available on the market. In this way, only listed companies or acquired recently will have this information.
As regards the criterion of applicability, which aims to evaluate the easiness of use of the model by the analyst, it is based on the number and degree of difficulty of the estimates required for their application and the information available in the market. In other words, an assessment will have a certain level of applicability, taking into account factors such as the number and complexity of variables to estimate and the information available.
Damodaran (2006) recommends the use of free cash flow for companies that are in the process of changing its leverage, as well as much leveraged companies, where the application of models of dividends and economic profit becomes quite difficult
The Free Cash Flow model can be characterized by their ability to consider, explicitly and objectively, all the elements that determine the value of a company internal rate of return, rate of growth, synergies, organizational capital etc.
Another advantage of the FCF model is its ease of application for companies with multiple business units. The model allows the isolated assessment of the business units. And for BPI that’s very important regarding the domestic and international operations.
2.3 – The Importance of Banks Valuations
When carrying out a merger or acquisition, the valuation of the financial institution is critical to the success of the operation, both from the buyer's point of view as the seller's point of view. For the buyer, an evaluation conducted incorrectly can mean paying a
necessary return on investment. For the seller, may lead to the sale for a price lower than the real value of the bank, representing value destruction to existing shareholders. The usefulness of a bank assessment is not limited to mergers and acquisitions. It can also be used as a management tool providing important references to allocation of resources among the various business units of a bank or to determine executive compensation. Tracking the value of a bank also allows monetary authorities to adopt preventive measures against crises in the banking system and its consequent negative impact on the other sectors of the economy. Finally, the evaluation of banks is also an important tool for customers of the financial, concerned about the bank's solvency where they perform their investments.
Due to the activities engaged in the economic system, financial institutions have particular characteristics, which make a more complex evaluation than the evaluation of non-financial companies. The analysis must focus on how the different valuation models can deal with such characteristics appropriately, incorporating them into the estimated value of the bank.
3 – COMPANY’S PRESENTATION
3.1 – Company Overview
The BPI Group - headed by Banco BPI - is a financial group focused on banking business, with a full range of financial products and services to corporate, institutional and individual customers.
It is currently the fourth largest financial group operating in Portugal, recorded an asset of 46 billion euros, with market shares in both loans and deposits close to 8%. With a stock market capitalization of EUR 1.5bn, weighing 2.61% on PSI-20 Index, BPI group
has as its main activity, its domestic business, divided by the segments of commercial banking, investment banking, private equity and financial Investments.
Currently in its domestic operations accounts for more than 1.7 million customers, through a network of 546 traditional branches, 39 investment centers, 28 000 business partners, 46 centers dedicated to the Corporate segment and six centers dedicated to international clients, telephone banking and home banking service.
Regarding the international operations, the bank owns a 50.1% participation in angolan Banco Fomento de Angola (BFA) and 29.7% participation in the mozambican Banco Comercial e de Investimentos (BCI).
3.2 – History
In October of 1981, gathered some of the most enterprising Portuguese companies, as well as five of the most important financial institutions internationally, in order to be shareholders of the new company in Portugal called Sociedade Portuguesa de Investimentos (SPI). This Society had as objectives set at the time, funding of private sector investment projects, in order to contribute to the revival of the capital market and the modernization of the Portuguese corporate structures.
Nearly four years later, in March 1985 with the aim of expanding the business, the company saw transformed its structure in a bank. The foundation of the Portuguese Investment Bank has helped increase their business area, in particular in attracting demand deposits and time deposits, in short-term lending, the practice of foreign exchange transactions, and the intervention of interbank markets.
After almost a year in 1986, there was the initial public offering and admission of shares to listing on stock exchanges in the Euronext Lisbon and Porto.
About six years after the foundation of the bank, it was already visible strong leadership in key areas of investment banking, and a major role in the privatization program in Portugal. Thus, in order to strengthen its position, pointed to the acquisition of Banco Fonsecas & Burnay (BFB) in August 1991, which allowed the possibility of increasing its size in particular through the entry into commercial banking.
At this stage the group aimed to ensure the supply of financial services in both strands (individual and corporate customers). Then it was found, at first, the realization of a partnership with Itaú Group, which began with participation in BFB, which, in 1993, was converted into a share of BPI itself, which has become one of major shareholders. In November 1995 reorganized his structure, becoming a bank holding company in the form of SGPS. Approximately at the same time, strong allies has joined the shareholder structure, namely La Caja de Ahorros y Pensiones de Barcelona (La Caixa), the German insurance group Allianz and the Angolan Santoro Finance.
Until 1998, there were the acquisitions of Banco de Fomento and Banco Borges in 1996, and began the process of integration of the BPI Group.
In 1998, was created the largest network of single-brand banking in Portugal, formed by the merger of Banco Fonsecas & Burnay, Banco de Fomento e Exterior and Banco Borges & Brother and finally the Universe Bank (in-store bank).
The structure was simplified in the merger process. BPI SGPS was divided into Portuguese Investment Bank and a commercial bank called Banco BPI.
For a decade Banco BPI developed its image and strengthened its position within the domestic financial activity. Following, he took the opportunity to put into practice some lines international strategies, with a view to attracting customers and expanding its business. In 2003 the group acquired 29.7% interest on Banco Comercial e de
Investimentos (BCI), and later in 2008, joined the Unitel, Angola's telecommunications network, and now holds 50.1% of Banco de Fomento de Angola (BFA).
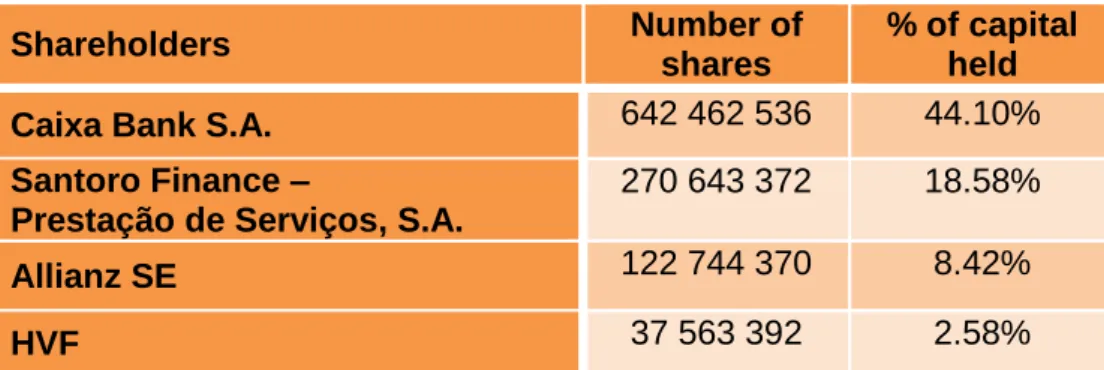
3.3 - SHAREHOLDER STRUCTURE
According to BPI´s website, the shareholder structure at 31 March 2015, was held by 20 339 shareholders, where 11.1% of the capital belong to 19 866 individuals, and 88.9% belong to 473 institutional investors and companies owned the remaining share capital. This capital was made up of 1 457 million of nominative and dematerialised (book entry) ordinary shares with no par value, being all of them listed on the Euronext market.
TABLE II
SHAREHOLDERS OWNING MORE THAN 2%
Shareholders Number of shares
% of capital held Caixa Bank S.A. 642 462 536 44.10% Santoro Finance –
Prestação de Serviços, S.A.
270 643 372 18.58%
Allianz SE 122 744 370 8.42% HVF 37 563 392 2.58%
Source: Company Data, according to BPI’s website (updated at March 2015)
3.4 – Financial Indicators
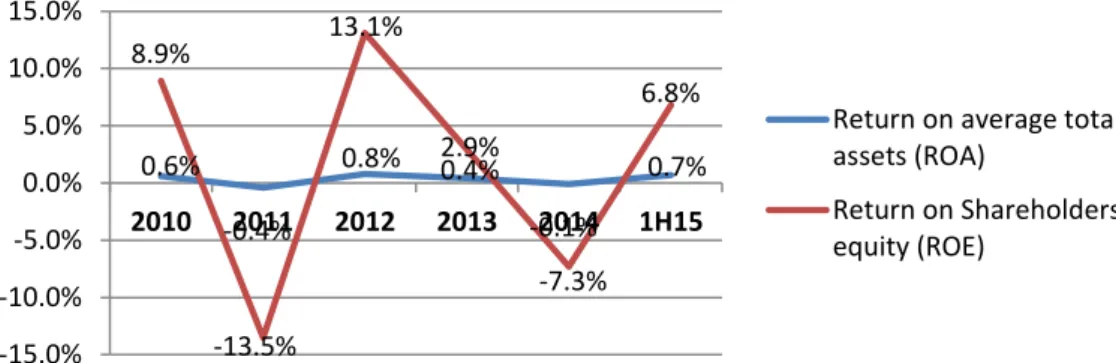
The historic analysis provided during the course of this dissertation denotes that in consolidated terms during 2010 BPI achieved the best return on equity of the four largest Portuguese banks. Although this figure has been falling since 2007 when 24.7%
FIGURE 1 – ROE and ROA (Consolidated)
Source: BPI’s Annual Reports
By contrast, 2011 was characterised by an exacerbation in the Euro crisis brought about by the situation in Greece and the Portuguese Government’s application for a rescue package which resulted in an attempt at financial stabilisation nationwide. This year then saw the start of a period which Banco BPI found it hard to deal with as it recorded a net loss of 284.9 million Euros, the first loss in its 30-year history. After tax, impairment charges deriving from exposure to the Greek debt amounted to 420 million Euros. As far as liquidity was concerned, there was a 7% increase in deposits with the credit portfolio falling by 6%. In this same year also worthy of mention were a credit-deposit ratio of 109%, already less than that required of the Portuguese banks of 120% by 2014. Its accumulated return on equity stood at -13.5%.
In 2012 an almost symmetric figure was recorded in terms of ROE which can be put down to the same reasons, the influence of extraordinary impacts related with the public debt portfolio. The loss in 2011 was impacted by the writing off of Greek debt imposed on private banks by the European authorities. The profit in 2012 is, per se, the upshot of the contribution by non-recurring financial operations for the sum of 204 million Euros as a consequence of the repurchasing of liabilities and the gains obtained from the sale
0.6% -0.4% 0.8% 0.4% -0.1% 0.7% 8.9% -13.5% 13.1% 2.9% -7.3% 6.8% -15.0% -10.0% -5.0% 0.0% 5.0% 10.0% 15.0% 2010 2011 2012 2013 2014 1H15
Return on average total assets (ROA)
Return on Shareholders equity (ROE)
of public debt. Until 2014, despite the positive contribution by Angola, on a consolidated basis there was a sharp fall owing to the poor results from its activity in Portugal, in 2013 owing to the 30% fall in banking revenue determined by three factors: the fall in net gains on financial operations from 326 to 172 million Euros, the 29% slide in the financial markup pertaining to 117 million Euros and the 9% drop in commissions, around 25 million Euros. It is also worth stressing the 4% increase in credit provisions and impairments totalling 264 million Euros.
2014 saw BPI suffer a net loss of 163.6 million Euros in consolidated terms, constituting one of the best results for international activity and a negative outcome for domestic activity, a profit of 126 million Euros in the former case and a loss of 289.7 million Euros in the latter.
As regards domestic activity, more than 90% derives from non-recurring income. Losses of 105.9 million Euros deriving from the sale of medium and –long-term public debt of Portugal and Italy, costs of 20.5 million Euros pertaining to the payment of interest on contingent convertible bonds, costs of 23.1 million Euros further to early retirements, cancellation of 50.9 and 23.3 million Euros in deferred tax pertaining to 2011 and deferred tax owing to an alteration in the IRC (corporation tax) rate, respectively. And finally, owing to other miscellaneous one-off costs for the sum of 40.5 million Euros.
As regards international activity, the best result ever was achieved since BPI disposed of BFA in 2008. The latter ended the year demonstrating its financial capacity and the good performance and development of its retail networks: 1.3 million customers, 186 commercial spaces, 2 526 employees, total assets of 8.4 billion Euros, liquidity
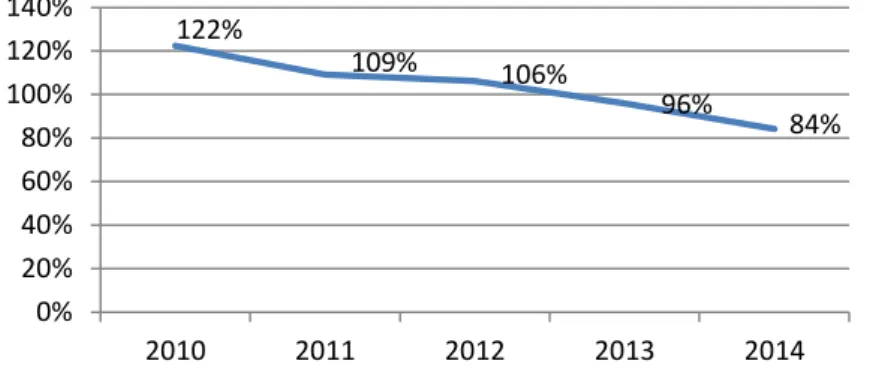
and an exceptional credit-deposit ratio of 25%. As far as liquidity, risk and costs were concerned, it is worth mentioning the evolution in credit and resources which made up an ever smaller transformation ratio with a figure of 106% for domestic activity (having recorded 118% in 2013) and 84% in consolidated terms (attaining 96% in 2013).
FIGURE 2 – Loans to Deposits Ratio (consolidated)
Source: BPI’s Annual Reports
A further positive factor worthy of special mention against this difficult backdrop for Portugal was the strengthening of the bank’s position in terms of its liquidity management, clearly borne out by the early repayment of 2.9 million Euros to the ECB in view of which at year-end 2014 it had exposure of 1.5 billion Euros (the lowest in the Portuguese financial system), also having available and eligible for new operations a total of 6.4 billion.
During the course of the period under analysis not only BPI but also other credit institutions operating in Portugal have been subject to extreme pressure on the financial markup and submitted to major restructuring processes as a result of the aggregation of external factors such as interest and inflation rates close to zero, resulting in the allocation of the operating account thereof. There was a high level of impairments against a backdrop of major deleverage. Also under analysis during 1H15 there was a
122% 109% 106% 96% 84% 0% 20% 40% 60% 80% 100% 120% 140% 2010 2011 2012 2013 2014
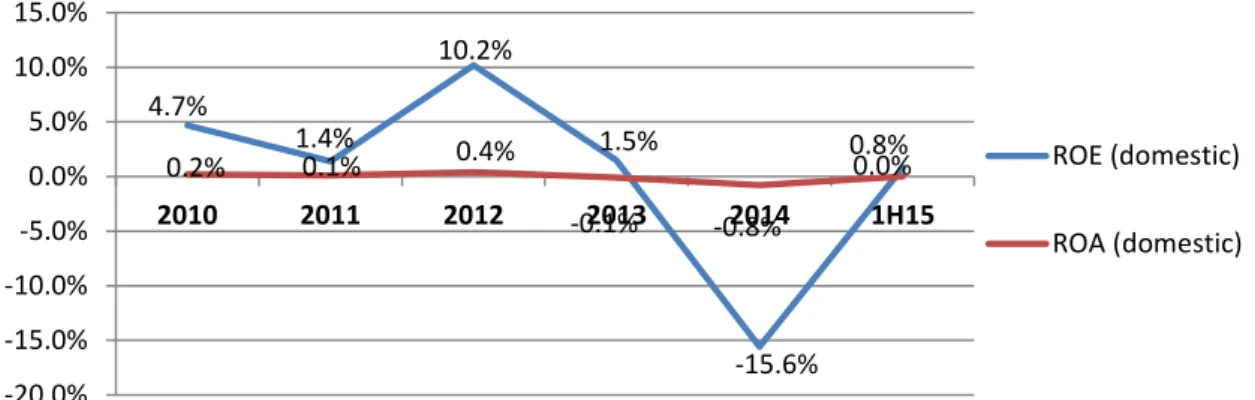
The consolidated net profit stood at 76.2 million Euros, comprising 6.6M.€ relating to domestic activity and 69.6M.€ to international activity. The financial markup in consolidated terms, increased by 40%, an ROE of 6.8% in consolidated terms, with 0.8% in domestic activity and 28.7% in international activity.
FIGURE 3 – ROE and ROA (Domestic)
Source. BPI’s Annual Reports
FIGURE 4 – ROE and ROA (International)
Source. BPI’s Annual Reports
A fall in the credit portfolio in consolidated terms of 3.5% on a year-on-year basis
4.7% 1.4% 10.2% 1.5% -15.6% 0.8% 0.2% 0.1% 0.4% -0.1% -0.8% 0.0% -20.0% -15.0% -10.0% -5.0% 0.0% 5.0% 10.0% 15.0% 2010 2011 2012 2013 2014 1H15 ROE (domestic) ROA (domestic) 37.6% 28.9% 25.2% 28.4% 32.7% 28.7% 4.4% 3.7% 3.0% 3.0% 3.5% 3.3% 0.0% 10.0% 20.0% 30.0% 40.0% 2010 2011 2012 2013 2014 1H15 ROE (International) ROA (International)
pertaining to mortgage credit and in international activity there was a 25% rise on a year-on-year basis). As far as credit was concerned, there was a reduction in risk from 0.72% to 0.64%.
As far as resources are concerned, there was a 10.4% increase on a consolidated year-on-year basis (having increased 10% domestically and 12.2% internationally). A 40% increase in the financial markup in consolidated terms and in domestic terms of 27%. As regards BPI financing obtained from the ECB, as at June 30th 2015 this stood at 1.5 Bi €.
Finally, it is worth noting that by the end of 2018 medium-long term net debt refinancing needs total 617 million Euros and that in 2019 there is a reimbursement of 1.2Bi € of medium-long term Eurozone sovereign debt held in portfolio by BPI.
3.5 – Portugal Macroeconomic Context
The international crisis triggered in 2007 marked the start of a downward course which led the country to a situation which was unsustainable in economic and financial terms. In 2011, the rise in yields and CDS spreads accompanied by a fall in the credit rating by the credit rating agencies has led to a loss in the credibility of the banking entities since that time, combined with factors such as high rates of unemployment, the contraction of GDP, high indebtedness levels and poor growth prospects engendered a macroeconomic climate which it was hard to resolve. The dependence on European funds became clear when on May 6th 2011 Portugal was forced to ask for aid for the sum of €78bn, signing an agreement with the European Commission, the Central bank and the IMF (Troika memorandum).
TABLE III
PORTUGAL GDP AND INFLATION RATE
Subject
(%) 2007 2008 2009 2010 2011 2012 2013 2014 2015 GDP 2.492 0.199 -2.978 1.899 -1.827 -4.028 -1.605 0.903 1.604
Inflation 2.423 2.651 -0.903 1.389 3.557 2.777 0.44 -0.158 0.627 .
Source: International Monetary Fund, World Economic Outlook Database, April 2015
Since 2011 – at which time there was a contraction in GDP from 1.9% in 2010 to around -1.8% in 2011 – there has been a policy involving budget cuts, increases in the tax burden with a view to balancing the public accounts and an attempt to reduce the sovereign debt. Some financial institutions have started to register losses, requiring State aid and leading to the start of a restructuring period for them and increasing their capital so as to be able to withstand the stress tests and regulations imposed, namely by the Basel Accords. They have increased their fees, cut staffing costs and consequently closed down branches, restructuring and monitoring their granting of credit, posting impairments which had not been recognised until that juncture.
After a three-year period during which the economy contracted, Portugal managed to register growth again in 2014 of 0.9%. The problem raised is the poor growth capacity and the slow rate inherent in Portugal. According to INE (Instituto Nacional de Estatística) another further factor to bear in mind is the warning about the rise in GDP in 2014 deriving from an increase in private consumption since this now seems to have slowed down again. The IMF advises the State to try and make its reforms slightly more
rates which have not exceeded 1.5% for a long time now have resulted in very serious consequences for the budget performance and for the fight against unemployment which hit a new high in January 2013 at 17.5%. Despite the fact that in August 2015 unemployment was situated at the lowest level since late 2010, it should be borne in mind that job creation has not accompanied the rate of unemployment. Hence, the Portuguese economy has 218.6 thousand people less employed than at the time of the troika in 2011. It should be stressed that there are more young people unemployed and more long-term unemployed.
Figure 5
PORTUGAL UNEMPLOYMENT RATE
Source: Trading Economics Statistics Portugal
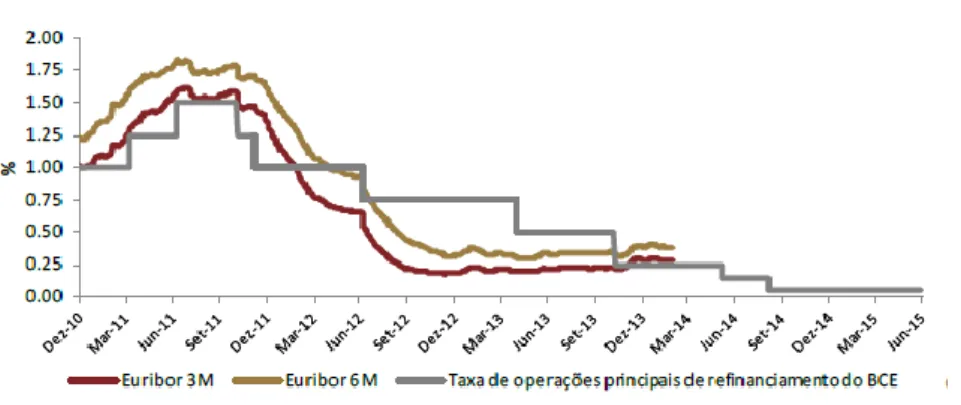
In European terms, the ECB has been developing a monetary expansion programme, buying assets and ensuring that the interest rates on German bonds and the Euribor rates are at record lows. The 3-month Euribor rate, one of the main indices for business loans
and mortgages, hit a record low of -0.001% and the 1-month Euribor rate also recorded a record low of -0.034%.
Figure 6 - ECB risk free rate and Euribor
Source: Website Bdp
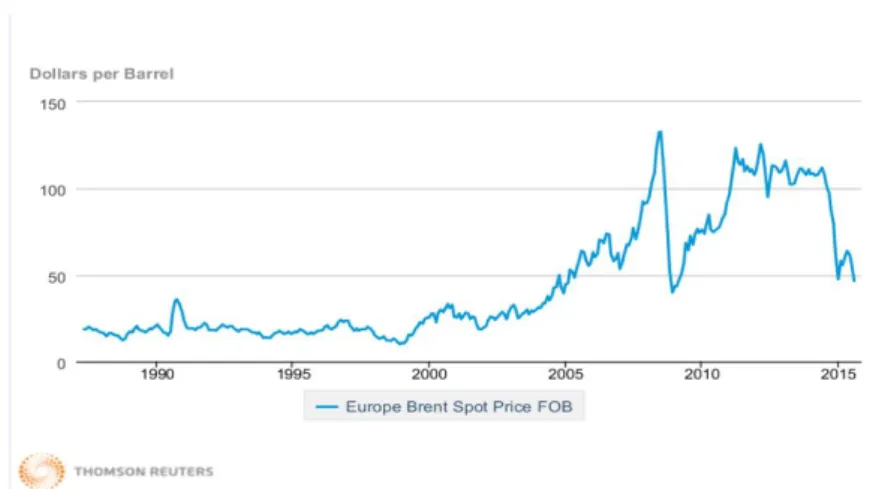
Another factor to bear in mind derives from the impasse reached in the situation of Greece, leading to a delay in the recovery of the Eurozone economy owing to the delay in investment decisions. It is worth pointing out that the exogenous shock, namely the fall in oil prices along with the policies undertaken by the ECB were the main factors behind the recovery in some economic indices. However, we should not forget that these effects fade away and more of the same is required.
Notwithstanding, after years of restrictive policies, Europe and Portugal seem to have gained a new lease of life and it is the perfect time to keep up the good work, reviewing and attempting to improve the structural reforms, always with an eye on the medium-long term.
3.6 – Angola Macroeconomic Context
Angola is an emerging country and it is the third largest economy in Sub-Saharan Africa - the second largest oil producer and highly dependent on the latter – which has stood out in recent years for its high GDP growth rates, putting it amongst the top 10 in the world in terms of growth. Its GDP per capita is one of the highest in terms of growth in the African continent. A further distinguishing feature is the fact that 50% of its population is aged under 18 years old and its total population may well double in just 20 years. After the triggering of the global crisis in 2007, there has been a trend amongst developed countries to get involved in large infrastructure development programmes, thereby providing direct support (foreign), engendering more know-how and specialised support in Angola. Public investments to improve electrical production capacity - namely through new electrical power plants, dams, infrastructure development, such as maritime ports and airports - have been factors designed to help win over foreign investment in the country.
The diversification of the Economy is still one of the main concerns of the Angolan government in the medium-term.
Despite all the efforts the country has endeavoured to make to break off its dependence on the oil sector, diversifying the economy in sectors such as agriculture, agro-industry, infrastructures, services and consumer goods, Angola still lives from imports and its exports essentially derive from the oil sector. In addition, it is worth pointing out this country’s difficulties in terms of corruption which are on the rise, the great inefficiency of public services, the high political risk and the lack of skilled labour. In addition to these negative factors, the child mortality rate is one of the highest in the world.
In recent times, the country’s great dependence on the oil sector has slowed down the economy owing to the continuous fall in oil prices. As this is the main revenue of the Angolan State, the reforms put into effect in the past will undergo changes as the difficulties in paying for some works which had already been started and the suspension of scheduled investments have been and will continue to occur, being reflected, per se, by the value of the sovereign debt.
TABLE IV
ANGOLA GDP AND INFLATION RATE
Subject
(%) 2007 2008 2009 2010 2011 2012 2013 2014 2015 GDP 22.593 13.817 2.413 3.408 3.919 5.155 6.8 4.222 4.497
Inflation 12.249 12.465 13.721 14.48 13.484 10.285 8.782 7.296 8.394
Source: International Monetary Fund, World Economic Outlook Database, April 2015
In 2014 GDP fell from 6.8% to 4.2% on a year-on-year basis which can essentially be put down to the performance of the oil sector which has been undergoing contraction since 2011. In 2014 production fell by 2.6% owing to unexpected repair and maintenance works, having fallen by 1% in 2013. In the non-oil sector, in 2014 there
investments in the industrial and energy sector. The fall in the oil price had an impact in terms of the tax deficit, increasing from 0.3% of GDP in 2013 to 2.9% in 2014. As regards revenue from the oil sector, there was a fall between 2013 and 2014 from around 30% to 24% of GDP, respectively. As regards the non-oil sector, there was an increase in revenue from 8.1% to 9.1% of GDP between 2013 and 2014. In absolute terms this data denotes a 14% fall in total revenues.
In light of this fall in oil industry prices the government will have to review its policies and reforms, implementing more severe austerity measures and redefining public expense priorities.
There is the risk of these austerity reforms creating long-term problems for the economy, reducing, in the same way, the extremely necessary attempts to diversify the economy. At present, the government seems to be committed to an ambitious political agenda focusing on the stable growth of the economy as well as social and infrastructures’ programmes. However, it should be borne on mind that the government may have to resort to the IMF for said if oil prices keep falling and for a prolonged period. This situation has been exacerbated by the signing of the agreement on Iran’s nuclear programme with the five UN Security Council powers plus Germany. Analysts believe that in the next year alone Iranian exports will hit record highs. Production is set to increase by around 200 thousand barrels of oil per day in the short-term.
As regards the rate of inflation, there was a record fall to 7.3% in 2014, from 8.8% in 2013, and an expectation that this rate will remain below 9% in 2015. This fall derives from a decrease in global food prices, an increase in agricultural production and efforts by the Angolan central bank to stabilise the nominal exchange rate.
As regards monetary policy, this is still restricted by the significant relative importance of the US Dollar in the Angolan economy despite the fact that efforts have been made to use the national currency the Kwanza on the domestic market.
As far as the Banking Sector is concerned, this has evolved positively in recent years, namely in terms of its size, increasing its number of branches, employees, assets and in terms of earnings. Furthermore, there has been an appreciable greater concern for credit risk management through monitoring and the implementation of integrated systems and workflows for their management in due time and these measures are extremely important bearing in mind that the credit due ratio has been increasing. Hence, I think that the sector still has room to grow but bearing in mind competitors it should endeavour to opt for its ability to stand out commercially, making its products and services profitable but also bearing in mind the capacity to react to ever more demanding regulatory requirements which are transversal to the whole range of financial institutions.
4 – Valuation 4.1 – Methodology
In the present dissertation, in line with the approaches to the methodology reviewed and bearing in mind the special characteristics of a financial institution, in other words, the fact that it is not possible to separate financing and investment decisions from operating decisions, in order to value Banco BPI the DCF method will be used. This method, per se, proves hard to apply and at the same time it is challenging to use in any valuation as for the financial services both the working capital needs and the capital expenditures are
decisions are highly constrained by the regulatory entities which per se influence the way they are capitalised and the speed of growth they may have.
Bearing in mind the factors set out above, I can assert that the best method for valuing BPI in the most credible way possible would be by means of FCFE.
As BPI’s business is highly influenced by its international activity, I thought it important to estimate each aspect separately, in other words, valuing the domestic and international activity individually and then finally consolidating them deploying “Sum-of-Parts” methodology. For each activity different premises were considered so that the result of the valuation would take into account the different types of risk factors in place in each geographic area. The historical period under analysis was from 2010 until 2014. As regards the forecast, this was set out for a period falling between 2015 and 2019 and the results of the first half of 2015 were taken into account.
The valuation of BPI was based on the Simon Benninga model with thorough work being carried out to adapt the items on the balance sheet (taken from the official reports and accounts of the Banco BPI site) to the items of the model referred to previously in accordance with the IAS/IFRS. The items on the Benninga model BS are as follows: Assets: cash, cash equivalents, other investment securities including money market
instruments, other earnings assets, other Loans, mortgage Loans, securities held to maturity, securities available for sales, other fixed assets, accumulated depreciation and other assets;
Liabilities: sight deposits, term deposits, short-term borrowings, long-term
indebtedness, other liabilities and federal funds purchase and repurchase agreements; Shareholder’s Equity: Equity and minority interests and Accumulated retained earnings. The cost of capital (𝐾𝑒) was used in order to obtain the FCFE.
4.2 – Assumptions and valuation results
The risk free interest rate considered for both activities was the 10 year German zero-coupon bond 0.7%;
The market risk premium used for both activities 5.8%,was taken from Damodaran and it´s generally accepted by research analysts;
The country risk premium was calculated, according Damodaran’s method, through the multiplication of an additional volatility multiplier of 1.5 by a rating base default spread of 2.5% for domestic activity and 4.5% for international activity. The final CRP obtained for domestic activity was of 3.8% and for international activity of 6.8%. The rating considered for CRP calculations was obtained on the Capital IQ database and correspond to BB+ for domestic activity and B+ for the international one.
The unlevered beta of the Banking sector used for discount rate calculation purposes was obtained in Damodaran’s website and amounts to 0.34. The levered beta was computed recurring to the Damodaran’s method.
The cost of equity was calculated using the CAPM. The FCFE was discounted through the cost of equity (Ke) plus a country risk premium.
For the effective tax rate was assumed for both activities, in order to comply with The Corporate Income Tax Reform, an initiative undertaken by the Portuguese Government. For forecast purposes and consequent valuation was taken into consideration Benninga Model assumptions. We projected our key valuation driver taking into consideration that the Portuguese economy is starting to recovery albeit in a slow pace. For the Angolan case it was assumed that the outstanding levels of growth from previous years were not realistics. Therefore, we readjust the assumptions used previously with the
assumed the astonishing growth verified until now will have necessarily to slowdown given several conjectures, such as the current oil shock.
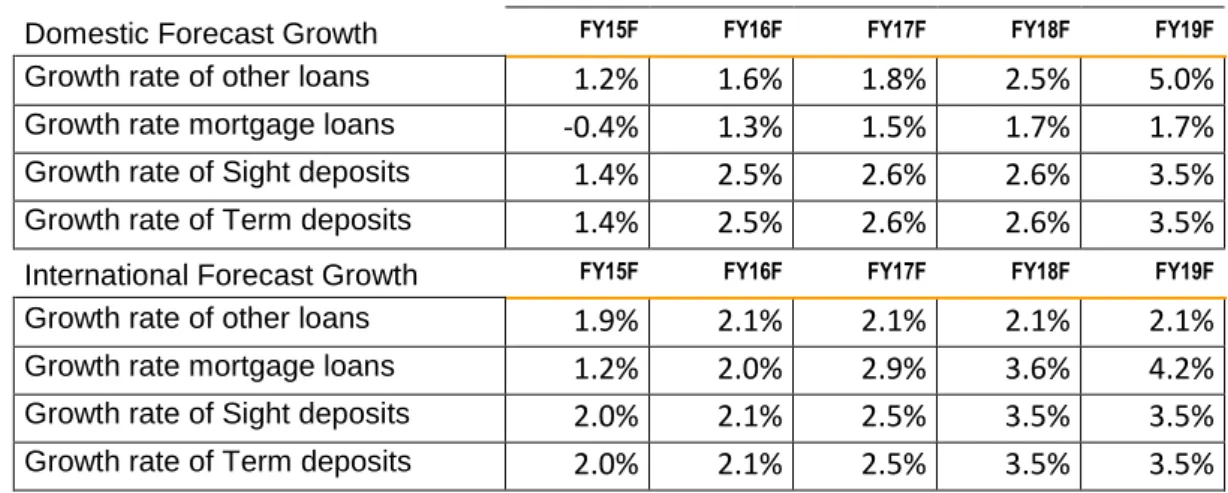
The total assets, which are mainly composed by mortgage loans, other loans and
securities available for sale, presents an upwards trend in the international activity and a downwards one in the domestic activity. For the future we expect an upwards trend for both regions, except on the FY15F for mortgage loans reducing a little bit (-0.42%) in terms of BS value.
TABLE V – Forecast Growth Rate of Loans and Deposits
Domestic Forecast Growth FY15F FY16F FY17F FY18F FY19F Growth rate of other loans 1.2% 1.6% 1.8% 2.5% 5.0% Growth rate mortgage loans -0.4% 1.3% 1.5% 1.7% 1.7% Growth rate of Sight deposits 1.4% 2.5% 2.6% 2.6% 3.5% Growth rate of Term deposits 1.4% 2.5% 2.6% 2.6% 3.5% International Forecast Growth FY15F FY16F FY17F FY18F FY19F Growth rate of other loans 1.9% 2.1% 2.1% 2.1% 2.1% Growth rate mortgage loans 1.2% 2.0% 2.9% 3.6% 4.2% Growth rate of Sight deposits 2.0% 2.1% 2.5% 3.5% 3.5% Growth rate of Term deposits 2.0% 2.1% 2.5% 3.5% 3.5%
Source: Author´s Calculations
The other items from the BS were calculated keeping the weight of interest over total income from the last completed year.
The net income resulted in a positive value for domestic activity growing from 8 090 thousand euros in FY15F to 40 939 thousand euros in FY19F.
The international segment net income results were, as in the domestic operations, positive from 108 154 thousand euros FY15F growing until 121 834 thousand euros FY17F reducing until FY19F in an amount of 76 692 thousand euros.
The final value of BPI bank was obtained by updating future cash flows for the actual time. Taking into consideration the assumptions made, the BPI value according to the
5 – Sensitivity Analysis
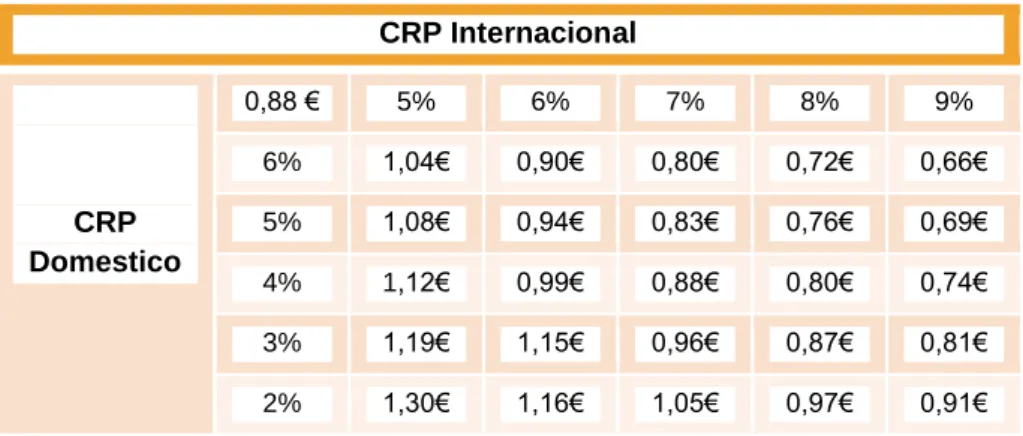
This section presents a sensitivity analysis focused on the "price target" regarding the oscillation of two important inputs in the evaluation of the share price of BPI Bank, specifically through the Country Risk Premium and the Rating level associated with each business segment, namely domestic and International. As we can see the final price fluctuates, in the first case, between 0,66 € and 1,30 € and in the second case between 0,62 € and 1,23 €.
TABLE VI
Sensitivity analysis with ∆ Country Risk Premium
CRP Internacional CRP Domestico 0,88 € 5% 6% 7% 8% 9% 6% 1,04€ 0,90€ 0,80€ 0,72€ 0,66€ 5% 1,08€ 0,94€ 0,83€ 0,76€ 0,69€ 4% 1,12€ 0,99€ 0,88€ 0,80€ 0,74€ 3% 1,19€ 1,15€ 0,96€ 0,87€ 0,81€ 2% 1,30€ 1,16€ 1,05€ 0,97€ 0,91€ TABLE VII Sensitivity analysis with ∆ Rating
Rating Internacional Rating Domestico 0,88 € B- B B+ BB- BB BBB 0,75€ 0,83€ 0,94€ 1,09€ 1,23€ BBB- 0,72€ 0,80€ 0,91€ 1,06€ 1,19€ BB+ 0,69€ 0,77€ 0,88€ 1,03€ 1,17€ BB 0,65€ 0,73€ 0,85€ 0,99€ 1,13€ BB- 0,62€ 0,70€ 0,81€ 0,96€ 1,09€
6 – Conclusion
The present dissertation set out to communicate various evaluation models for financial and non-financial companies with a view to choosing the best model so that the latter can be applied to the Banco BPI valuation. -
During its application its main characteristics were borne in mind, its modus operandi and the context and phase at which it was inserted, in other words, by means of a macroeconomic and financial analysis.
The free cash flow to equity was chosen as the best valuation method in terms of applicability, efficiency and forecasting. It should be stressed that the model used – devised by Simon Benninga – involves aggregating the items in a manner which is different from that shown on the balance sheet, thereby generating an innovative forecast which fits in perfectly with that which is to be expected.
As far as Portugal is concerned, after the atmosphere in the financial sector has calmed down, we find ourselves at a stage with low levels of inflation, low interest rates and indebtedness levels which are still very high, resulting in a poor return for the financial institutions, forcing them to try and earn income by cutting their costs to the hilt. Another factor to be borne in mind was the deterioration in the quality of the credit portfolio which required major efforts to ensure its funding.
In terms of the rules laid down by the supervision entities, to wit, through Basel III, these in the same way limit the range of action of this sector, in other words, focusing attention on the capital retained by the institutions so that the latter have sufficient capital buffers with a view to preventing a new financial crisis, thereby conserving the present and future stability of this sector, laying foundations for the latter to sustain the
As far as Angola is concerned, as stated previously, in terms of the banking sector it is a country endowed with vast future growth potential, high liquidity but with a drawback which is its great dependence on the oil sector which is currently going through a time when its supply is outstripping demand. Hence, as it is no longer as profitable as before, Angola will from now on have to tackle the existing problem of how to diversify its economy.
In view of that which has been expressed throughout this dissertation, I think it is to be expected in the forthcoming years that the financial institutions will have to be submitted to a highly detailed process in terms of monitoring and actions on variables such as contributions from costs or revenue. Efficient monitoring of impairment management and control, thorough adjustment of credit prices and the winning over of resources. A careful rethink about the size of the installed capacity and an optimisation in the gains deriving from operating efficiency. In this way I think it will be possible to again attain a certain level of credibility which is so lacking in this sector. In summary, if the ideas above can be put into place, along with the continued stabilisation of the economic and financial situation I believe it will be possible to achieve the gradual recovery of the financial sector.
7 – Bibliographic references
Adans, Michael e Rudolf, Markus (2010), A new approach to the valuation of banques, WHU
Benninga, Simon (2008), Financial Modeling, second Editio, The MIT PressFernandez Benninga, Simon (2011), Financial Modeling, 3rd Edition, The MIT Press
Copeland, T., Koller, T. & Murrin, J. (1994), Valuations: Measuring and Managing the Values of companies, 3rd Edition, New York: John Wiley and Sons.
Damodaran, Aswath (2001), Corporate finance: Theory and Practice, 2nd Edition, John Wiley & Sons
Damodaran, A. (2006), Valuation Approaches and Metrics: A survey of the Theory and Evidence, Stern School of Business,1–77.
Damodaran, Aswath (2011), Applied Corporate Finance, 3rd Edition, John Wiley & Sons
Deev, Oleg (2011), Methods of bank vauation: A criticial overview, Masaryk University, pp.33 - 44
Fernandez (2001) P. Valuation using multiples. How do analysts reach their conclusions, IESE Research Papers D/450: IESE Business School.
Gordon, M. (1962), The Investment, Financing, and Valuation of the Corporation, The Irwin Series in Economics.
Peterson, P. & Peterson, D. (1996), Company Performance and Measures of Value Added, CFA Institute Research Foundation Publications, pp. 1-60.
Reports
BPI, Financial Report (2010, 2011, 2012, 2013, 2014 and 1st Half 2015) Internet sources
Damodaran´s website: http://pages.stern.nyu.edu/~adamodar/ Bdp website: https://www.bportugal.pt/
8 – Appendix
Table VIII - Domestic Ke
DCF analysis Dec15F Dec16F Dec17F Dec18F Dec19F
Risk free rate 0.7% 0.7% 0.7% 0.7% 0.7% Country risk premium 3.8% 3.8% 3.8% 3.8% 3.8% Risk free rate (Rf) 4.4% 4.4% 4.4% 4.4% 4.4% Market Risk Premium (Rm -
Rf)
5.8% 5.8% 5.8% 5.8% 5.8% Beta unlevered 0.34 0.34 0.34 0.34 0.34
Beta re-levered 0.58 0.59 0.60 0.61 0.61
D/E 95.2% 95.3% 95.3% 95.3% 95.4% Marginal tax rate 25.7% 22.9% 20.7% 17.6% 17.0%
Ke (Rf+βL*MRP) 7.8% 7.8% 7.9% 7.9% 7.9%
Table IX - FCFE (Domestic)
FCFE
DCF analysis Dec15F Dec16F Dec17F Dec18F Dec19F
EBIT 10,889 28,230 29,123 20,494 49,324 EBIT(1-marginal tax rate) 8,090 21,772 23,097 16,880 40,939 Depreciation & amortization 17,170 18,321 18,838 20,133 20,858 Capex (7,065) (17,287) (7,770) (19,450) (10,895) Changes in NWC (4,298) (13,797) (9,213) (5,951) (17,157) FCFE 13,897 9,009 24,952 11,612 33,746
Table X - Present Value of CF (Domestic)
DCF analysis Dec15F Dec16F Dec17F Dec18F Dec19F
FCFE 13,897 9,009 24,952 11,612 33,746 Discount period 1 2 3 4 5 Re 7.8% 7.8% 7.9% 7.9% 7.9% Discount factor 1 1 1 1 1 Present value of CF 12,893 7,747 19,876 8,556 23,025
Table XI – Enterprise Value (Domestic)
PERPETUITY GROWTH METHOD
Re 7.9%
NPV of FCF 72,098 Terminal growth rate 2.0% Terminal value 578,969 Present value of the terminal value 395,038
Table XII – CRP/Rating (Domestic)
Date 15/10/2015 German government bond 0.69% Country rating BB+ Rating base default spread 2.5% Additional volatility multiplier 1.5 Mature risk premium 5.8% Country risk premium 3.8%
Rating Default spread in basis points
AAA - AA+ 40 AA 50 AA- 60 A+ 70 A 85 A- 120 BBB+ 160 BBB 190 BBB- 220 BB+ 250 BB 300 BB- 360 B+ 450 B 550 B- 650 CCC+ 750 CCC 900 CCC- 1,000 NR NA