Maria Constança Gomes Redinha Pais do
Amaral
Bachelor Degree in Biology
In vitro
and
in vivo
models to assess
cancer metastasis
Dissertation to obtain the Master Degree in Biochemistry for Health
Supervisor: Professor Paula Videira, PhD, FCT/UNL
Cossupervisor: Professor José Ramalho, PhD, FCM/UNL
Maria Constança Gomes Redinha Pais do
Amaral
Bachelor Degree in Biology
In vivo
and
in vitro
models to assess
cancer metastasis
Dissertation to obtain the Master Degree in Biochemistry for Health
Supervisor: Professor Paula Videira, PhD, FCT/UNL
Cossupervisor: Professor José Ramalho, PhD, FCM/UNL
Jury:
President: Prof. Dra. Teresa Catarino, FCT-UNL Arguer: Dra. Sofia Coroadinha, ITQB, FCT-UNL
Faculdade de Ciências e Tecnologia da Universidade Nova de Lisboa
iii
Copyright
In vivo
and
in vitro
models to assess cancer metastasis
Maria Constança Gomes Redinha Pais do Amaral
FCT-UNL, UNL
The Faculty of Sciences and Technology and the NOVA University of Lisbon have the right, forever and without geographical limits, to file and publish this dissertation through printed copies reproduced in paper or by digital means, or by any other mean known or that is invented, and to disclose it through scientific repositories and to allow its copying and distribution for non-commercial educational or research purposes, provided that the author and editor are credited.
v The work developed until the present date has originated:
- One Oral Presentation:
Constança Amaral, Roberta Zoppi, Fanny Deschepper, José Ramalho, Paula Videira (2017). Genetic cell models to assess the role of colorectal cancer-associated glycans. Jornadas Portuguesas da Genética, June 8th-9th, Aveiro, Portugal.
- One Paper:
vii “BELIEVE IN YOUR INFINITE POTENTIAL. YOUR ONLY LIMITATIONS ARE THOSE YOU SET UPON YOURSELF”
ix
Acknowledgements
To my supervisor, Professor Paula Videira, for the opportunity of working in her lab, for all the knowledge, guidance, trust, and advices, but mainly for the words of support when most needed. To Professor José Ramalho, for accepting to co-supervise me and for always opening his lab door to me.
To Roberta Zoppi (Mommy) for being the best mentor and friend someone can ask for, for never saying no to my cries for help but always letting me fly, for all the peeking while I was in the flow chamber alone for the first times, for the screams of not eating spaghetti properly and mainly for the friendship that is going to follow me for life (even if I must drag her).
To Carlota Pascoal whom I’m very proud of, for helping me every time, for the companionship, friendship, and for the great strength example that she is, always with a smile in her face and a music note.
To all the Glycoimmunology Group for the knowledge transmitted, advices, for all the laughs in the lab, companionship and for our common food problem: Fanny Deschepper, Tiago Ferro, Diana Sousa, Liliana Loureiro, Mylène Carrascal e Zélia Silva.
To our collaborators for providing us the colorectal cancer cell lines.
To Mafalda Sobral for always putting a smile on my face, cheering me up and having my back, for all the craziness and pure profound conversations, that may follow us in eld.
To my family for all the love, patience, care and help for me to proceed with my dreams, putting behind their own needs for mine, in particular to my mom Margarida, my dad José, my grandfather José, my aunt Regina, my sister Joana and my B.
To João, my partner for life, for all the late nights, cheers, support, for the more adorable distractions and friendship.
xi Abstract
Cancer metastasis is the major cause of cancer-related deaths. Some proteins/lipids-attached glycans are aberrantly expressed in cancer and this pattern is highly associated with malignancy and tumor progression. Thus, aberrant glycans are promising candidates as cancer biomarkers and therapeutic targets. Glycosyltransferases overexpression is the main mechanism behind tumor-associated glycans such as Sialyl-Tn (STn), α2,6-sialyl lactosamines and Sialyl Lewis X (SLex) antigens.
Colorectal cancer (CRC), the second most common cancer, is described to present STn and SLex, which correlate with disease progression. Although no glycan biomarkers yet reached clinical application due to the scarce understanding of the molecular mechanisms and the lack of relevant in vitro/vivo models to address them.
Therefore, this study main goal was to establish experimental models of CRC cell lines expressing altered glycans and to evaluate their behavior in vitro through: CRC cell lines 1) overexpressing STn and 2) expressing Luciferase. In the first, the LS174T cell line was transduced with ST6GALNaC I gene to induce STn expression. In the second, SW48, SW948, SW620 and HT29 cell lines that overexpressed, or not, relevant sialyl and fucosyltransferases were used: ST6Gal 1 responsible for increased α2,6 sialylation; and FUT 6, responsible for increased SLex expression. These cell lines were then genetically modified to express LUCIFERASE (LUC) gene to allow cell tracking.
After ST6GALNaC I or LUC genes transduction, the cells were phenotyped by flow cytometry to assess glycan expression and Luciferase was assessed by bioluminescence. Results showed that LS174T did not induce STn expression after transduction, since its precursor was absent. Regarding the remaining cell lines transduced with LUC, only HT29 FUT VI and SW948 ST6GAL I, and respective controls, emitted bioluminescence when tested.
This study contributed to the comprehension of cancer-related glycan expression in CRC cell lines. These established cell lines may open the way for future investigation lines of metastasis development in vivo.
xiii Resumo
Metástases tumorais são a maior causa de mortes relacionados com cancro. Alguns glicanos, ligados a proteínas/lípidos, estão aberrantemente expressos em cancro e este padrão está altamente associado a malignidade e progressão tumoral. Assim, glicanos aberrantes tornam-se promissores candidatos para biomarcadores tumorais e alvos terapêuticos. A sobre expressão de dadas glicosiltransferases é o principal mecanismo adjacente a glicanos tumorais como é o caso dos antigénios Sialil-Tn (STn), α2,6-sialil lactosaminas e Sialil Lewis X (SLex).
Cancro colorretal (CRC) é o segundo tipo de cancro mais comum e expressa STn e SLex, o que se correlaciona com progressão da doença. Apesar de nenhum dos glicanos propostos ter chegado ainda à clínica devido à falta de compreensão dos mecanismos moleculares adjacentes e de modelos in vitro e in vivo.
Assim sendo, o principal objetivo deste estudo foi estabelecer modelos de linhas celulares de CRC que expressavam glicanos alterados e avaliar o seu comportamento in vitro por: estabelecer linhas de CRC que 1) sobre expressassem STn e 2) que expressassem Luciferase. Na primeira, a linha LS174T foi transduzida com o gene ST6GALNaC I de forma a induzir a expressão de STn. Na segunda, as linhas SW48, SW948, SW620 e HT29, a expressar ou não relevantes sialil e fucosiltransferases foram usadas; nomeadamente ST6Gal 1, responsável pelo aumento de α2,6-sialilação; e FUT 6, responsável pelo aumento de expressão de SLex. Estas linhas foram geneticamente modificadas para expressar o gene da LUCIFERASE (LUC) para permitir o seguimento celular por bioluminescência.
Após transdução com os genes ST6GALNaC I ou LUC, as células foram fenotipadas por citometria de fluxo para aceder à expressão de glicanos e a expressão de Luciferase foi testada por bioluminescência. Os resultados mostraram que as LS174T, não expressavam STn após transdução, uma vez que o seu percursor estava ausente. Relativamente às restantes linhas quando transduzidas com LUC, só as HT29 FUT VI e SW948 ST6GAL I e respetivos controlos, emitiram bioluminescência.
Este estudo contribuiu para a compreensão da expressão de glicanos-tumorais em linhas celulares de CRC. Estas linhas estabelecidas podem ter aberto o caminho para novas linhas de investigação para o desenvolvimento metastático in vivo.
xv 1 TABLE OF CONTENTS
1. Introduction ... 1
1.1 Cancer ... 1
1.1.1 Colorectal Cancer ... 2
1.2 Glycosylation ... 2
1.2.1 Sialic Acids ... 3
1.2.2 Glycosyltransferases and Glycosidases... 4
1.2.2.1 Sialyltransferases and Sialidases ... 4
1.2.2.2 Fucosyltransferases ... 5
1.3 Glycosylation and Cancer ... 5
1.3.1 Thomsen-Friedenreich Antigens ... 7
1.3.2 Sialyl-Tn Antigen ... 8
1.4 Study of glycans in vitro and Luciferase enzyme ... 8
1.5 Introduction to the aims of this thesis ... 8
2 Materials and Methods ... 11
2.1 Culture of Colorectal Cancer Cell Lines ... 11
2.2 Techniques ... 11
2.2.1 Transduction ... 11
2.2.2 Flow Cytometry ... 12
2.2.3 Fluorescence Microscopy ... 13
2.2.4 Real Time Polymerase Chain Reaction ... 14
2.2.5 Luciferase Detection Assay ... 14
2.3 Colorectal Cancer Cell Lines Characterization ... 15
2.3.1 Transduction Protocol... 15
2.3.2 Cell Phenotype Analysis by Flow Cytometry ... 15
2.3.2.1 Flow Cytometry Protocol ... 15
2.3.2.2 Sialidase Treatment Protocol ... 16
2.3.2.3 Cell Lines Staining with Antibodies ... 16
2.3.3 Cell Phenotype Analysis by Fluorescence Microscopy ... 17
2.3.3.1 Fluorescence Microscopy Protocol ... 17
2.3.4 Gene Expression Analysis of ST6GALNACI by RT-PCR ... 17
2.3.5 Luciferase Expression Assessment ... 19
2.3.5.1 Luciferase Detection Assay Protocol ... 19
2.3.5.2 Colony Picking for SW48 and SW948 Cell Lines ... 20
2.3.6 Cell Growth Curves ... 20
2.4 Statistical Analysis ... 21
3 Results ... 23
3.1 Establishment of a CRC cell line overexpressing STn Antigen ... 24
3.2 Luciferase Expression and Luciferase Cell Lines Characterization ... 27
3.2.1 SW948 MOCK LUC Cell Line ... 28
3.2.2 SW620 MOCK, SW620 FUT VI, HT29 MOCK, HT29 FUT VI, SW948 ST6GAL I, SW48 MOCK and SW48 ST6GAL I Cell lines ... 32
4 Discussion of Results ... 35
5 Conclusion and Future perspectives ... 38
6 Bibliography ... 40
xvii List of Figures:
xxi List of Tables:
xxiii Abbreviations:
APC - Allophycocyanin
ATP – Adenosine Triphosphate Asn – Asparagine
cDNA – complementary DNA
CFG - Consortium for Functional Glycomics CMP – Cytidine Monophosphate
CRC – Colorectal Cancer DMSO – Dimethyl Sulfoxide DNA – Deoxyribonucleic Acid ECM – Extracellular Matrix ER – Endoplasmic Reticulum
EV – Empty Vector
FBS – Fetal Bovine Serum FITC – Fluorescein isothiocyanate FSC – Forward-scattered Light Fuc – Fucose
FUT – Fucosyltransferase gene
FUT VI – Fucosyltransferase VI Gal – Galactose
GalNAc – N-acetylgalactosamine GDP – Guanosine Diphosphate Glc - Glucose
GlcNAc - N-acetylglucosamine
Lex– Lewis X
Luc – Luciferase gene ME – Mercaptoethanol
MOI – Multiplicity Of Infection
mRNA – messenger Ribonucleic Acid NC – Negative Control
Neu5Ac – N-acetyl neuraminic Acid or Sialic Acid PBS – Phosphate Buffered Saline
PCR – Polymerase Chain Reaction Pen/Strep – Penicillin and Streptomycin PFA – Paraformaldehyde
RNA – Ribonucleic Acid
RT-PCR – Reverse Transcriptase Polymerase Chain Reaction
Sia – Sialic Acid Ser - Serine
SSC – Side-scattered Light
STn – Sialyl-Tn Antigen
ST3Gal I - β-Galactoside α2,3-Sialyltransferase I
ST6Gal I –β-Galactoside α2,6-Sialyltransferase I
ST6GalNAc I –N-Acetylgalactosaminide α2,6-Sialyltransferase I
TACAs - Tumor-Associated Carbohydrate Antigens TE- Trypsin-EDTA
Thr – Threonine
1 1. Introduction
1.1 Cancer
Canceris one of the most prevalent diseases and the second leading cause of death, worldwide. Such high incidence and its related mortality leads to the importance of an early and correct diagnosis and to the discovery of effective treatments, in order to cure or to improve the life quality and expectancy of cancer patients. Lung, liver, colorectal and breast cancers are the most deadly types of cancers, since their etiology is mostly related to dietary or behavioral risk factors1.
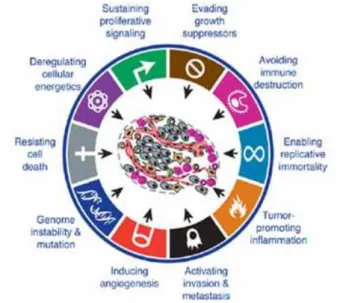
This process occurs by normal cells transformation into malignant cells due to gene mutation that can lead to oncogene activation and/or tumor suppressor genes loss of function. These genetic alterations are the result of the combination of genetics and carcinogens exposition1. Cancer cells differ from normal cells by the acquisition of certain common capabilities during their development that allows them to survive, proliferate and differentiate in uncontrolled ways. These are called the Hallmarks of Cancer (Figure 1.1). Nowadays, ten common alterations have been described: self-sufficiency in growth signals, insensitivity to anti-growth signals, evasion from cell death signals, unlimited replication capacity, sustained angiogenesis and tissue invasion and metastasis, genomic instability, inflammation, reprogrammation of energy metabolism and immune response escape 2,3.
According to the cell type from which the tumor arises, tumors are classified into carcinomas, which includes 90% of all cancer, if the primary cell is epithelial; sarcomas if the origin is in connective tissue; lymphomas for immune system cells; and leukemias for blood-forming cells. They are also classified according to their tissue of origin, for example, adenocarcinoma have its origin in glandular tissue4.
Cancer cells can undergo an invasion process called metastasization. It originates with the loss of cell-cell adhesion ability and it is defined as the tumor capacity to spread and invade from the primary site to adjacent healthy tissue and distant organs. This ability is the main cause of the increasing mortality ratio within cancer patients. While many early stage tumors can be treated with surgery or local irradiation, metastasized ones are more difficult to treat. Cancer cells have genetic instabilities and such heterogeneity that allows them to survive in unfavorable environments5. The molecular mechanism behind this process is still unknown, but already some genes and molecules known to be involved with it have been identified. The metastatic process consists of many steps where cells detach from the primary tumor, invade, circulate in the blood stream or in lymph, extravasate, are able to survive, proliferate, and promote angiogenesis6. Although most of the cells that enter the circulation do not survive, others develop the ability to adhere the vascular walls in a host organ and extravasate. The adhesion to the extra-cellular matrix (ECM) is mediated by selectins and their respective ligands. Cancer cells can produce collagenase IV which degrades collagen IV, the main component of membranes. When this happens, an inflammatory response is created, and the recruitment of leukocytes and macrophages is initiated, allowing the extravasation and the permeabilization of the membranes/walls. Adhesion molecules such as laminin, fibronectin and collagen are essential for cancer cells to adhere to the endothelium membranes and to attach to basal lamina. It has been described that cell malignancy is associated with overexpression of adhesion molecules receptors, regulating adhesion and motility of these cells7. Metastasis have been shown to have preferred spreading sites as happens in bone, in breast and prostate cancers8.
1.1.1 Colorectal Cancer
Colorectal Cancer (CRC) is the second most common cause of cancer-related death in women and the third in men9. Its causes are various but mostly related with diet habits, prior family cases, age and untreated polyps. What makes this kind of cancer particularly dangerous is the presence of high genetic and molecular heterogeneity among its cells. This high incidence combined with an asynthomatic behaviour translates into an urgent need to develop prognostic tools and therapy methods in order to reduce and avoid disease progression. In fact, most patients with metastatic CRC have higher chances of recurrence, even after surgery and chemotherapeutic treatments.
The majority of CRC are adenocarcinomas. They usually originate with a polyp in the colon or rectum that can, sometimes, develop into a tumor: in this scenario, preliminary detection through colonoscopy becomes an essential prevention tool10. However, CRC can derive in metastic CRC within the liver and without proper biomarkers, it is very difficult to detect by endoscopy.
1.2 Glycosylation
3 together with motility, cell growth, immune response, amongst others11, since they are the first face of interaction regarding to cells.
Glycosylation is the most common post-translational modification process in eukaryotic cells, where carbohydrate donors and carbohydrate acceptors react through enzyme mediation, to form chains that are linked to specific protein and lipid glycosites. Glycosyltransferases are the enzymes responsible for glycan biosynthesis and glycoconjugates formation using a single nucleotide-sugar as a donor substrate. This mainly occurs in the lumen of the Endoplasmic Reticulum (ER) and Golgi Apparatus, but also in the Cytoplasm and Plasma Membrane. On other hand, glycosidases are the enzymes that are responsible for hydrolyzing some specific glycan linkages 12.
There are a wide variety of glycans due to monosaccharide composition, branches, and different linkages. Therefore, a nomenclature was created, the Nomenclature Committee of the Consortium for Functional Glycomics (CFG), where glycans structures are represented as symbols and text (see Apendix I).
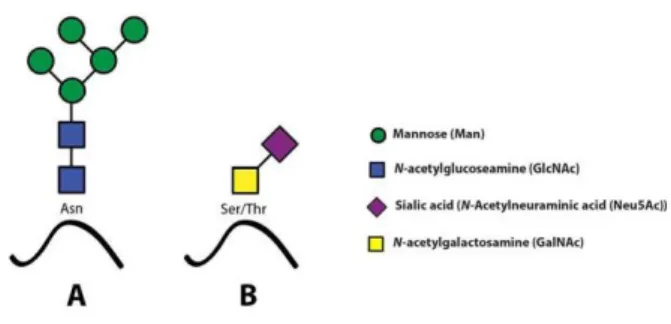
Glycosylation can produce several types of glycoconjugates or glycans. From the five classes known, this thesis will only focus on two: O-glycans or N-glycans. N-glycosylation is the binding of a N-acetylglucosamine (GlcNAc) residue to the amine group of an asparagine (Asn) residue of a protein side chain, especially to the motif Asn-X-Ser/Thr and O-glycosylation is the linkage of a N-acetylgalactosamine (GlacNAc) residue to the oxygen atom of a subset of serines (Ser) and threonines (Thr)12 as illustrated in Figure 1.2.
O-glycosylation process steps occur in the trans-Golgi network by the linkage of monosaccharide units by the sequential action of glycosyltransferases. The position in the Golgi lumen, the level of expression and the specificity of each of these enzymes determines the O-glycans patter13, being Tn is the simplest existing O-glycan.
1.2.1 Sialic Acids
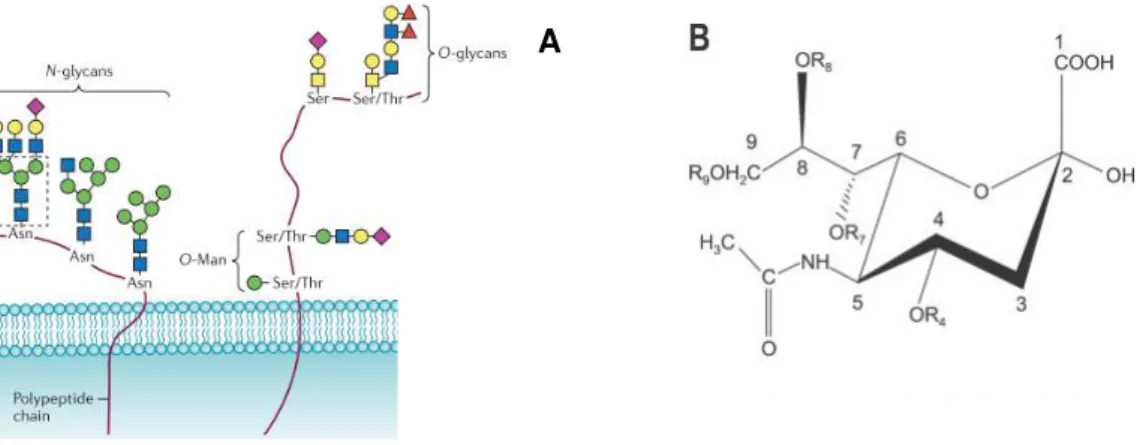
Sialic acids (Sia or N-acetylneuraminic acid (Neu5Ac)) are the simplest monosaccharide family of the glycan chain of glycoproteins and glycolipids. Many cell surface glycoproteins and glycolipids can be
modified by sialylation through the linkage of Sia. Due to their several α-linkage possibilities between its nine-carbon backbone, their diversity is vast. Usually they are situated at the terminal branches of N-glycans, O-glycans and glycosphingolipids (Figure 1.3) and their negative charge center can be H-bonded to the donor groups of cytidine-5’-monophosphate-sialic acid (CMP-sialic acid) by sialyltransferases.
Given their non-reducing terminal position in cell membranes, they have several important biological roles. They are related with various biological processes such as cell/cell interactions, B and T cell activation in the immune system and cell differentiation, maturation and they constitute the attachment site for pathogens. An altered sialylation is also implicated in tumorigenicity such as metastasis of malignant cells 14.
1.2.2 Glycosyltransferases and Glycosidases
The enzymes in charge for glycan biosynthesis are called glycosyltransferases and act by the sequential addiction of monosaccharides from a high-energy nucleotide sugar donor to specific positions on determined precursors, originating linear or branched sugar chains. Most are found in the ER/Golgi pathway15.
Glycosidases are responsible for the degradation of sugar chains. These may be endo or exoglycosidases and their action is correlated with low pH levels. Exoglycosidases act by cleaving the linkage of terminal carbohydrates from the nonreducing end. On other hand, endoglycosidases cleave internal glycosidic linkages of larger chains that can later be degraded by exoglycosidases15.
1.2.2.1 Sialyltransferases and Sialidases
Sialyltransferases are the glycosyltransferase family responsible for adding CMP-activated Sia residues to specific terminal non-reducing positions on oligosaccharides of proteins or lipids. The substrates can
A
5 be galactose residues (Gal), GalNAc or Sia. These enzymes are type II membrane proteins from the Golgi apparatus, therefore, Sia are added during glycoproteins biosynthesis.
The sialyltransferase enzyme family vary according to their tissue distribution and to the Sia linkage that they form. Sia can be added by some of them, such as: ST3Gal 1 sialyltransferase in α2,3 linkage to galactose; ST6Gal 1 sialyltransferase in α2,6 linkage to galactose or by ST6GalNAc to N-acetylgalactosamine; or by the α2,8 linkage by a family of polysialyltransferases to other Sia. The aberrant expression of these enzymes is highly correlated with cancer. For the aims of this thesis only ST6Gal 1 and ST6GalNAc 1 are going to be considered.
ST6GAL I gene is present in chromosome 3 in humans and in chromosome 4 in mice and codes for ST6Gal 1 enzyme. This enzyme is a type II membrane protein, but it can also be found in the soluble form. It is highly expressed in lymphocytes and hepatocytes where it is the mainly responsible for catalyzing α2,6 sialylation of membrane glycoproteins and of serum glycoproteins, respectively, on N-glycan cases 11.
ST6GalNAc 1 is the human enzyme responsible for adding Sia in α2,6 linkage to O-linked GalNAc residues linked to a Ser or Thr, leading to Sialyl-Tn antigen (STn) a cancer related antigen that is one of the main incidences on this work.
Sialidases or neuraminidases are the enzymes responsible for catalyzing the cleavage of the Sia from glycans: they have been described as having an important role in the pathogenesis of diseases16, since they can be found in lysosomes and endosomes that degrade glycoproteins.
1.2.2.2 Fucosyltransferases
Fucosyltransferases (FUT) are a glycosyltransferase family that transfer a fucose residue from a guanosine diphosphate fucose (GDP-fucose) donor to glycoconjugate acceptors. Human FUT genes can be divided into α1,2-FUT, α1,3/4-FUT and α1,6-FUT. The first family is the responsible for blood group antigens, such as ABO, and Lewis y (Ley). In the second family, we have From FUT 5 to FUT 7 and from FUT 9 to FUT 11. One of them, FUT6 is responsible for Lewis x (Lex)and Sialyl-Lewisx (SLex) biosynthesis17, another important cancer related antigens that this thesis is going to refer to.
1.3 Glycosylation and Cancer
glycosyltransferases or glycosidases or also due to their deallocated position in the Golgi Apparatus as well as due to fluctuations on pH levels20.
Figure 1.4 Tumor associated carbohydrate antigens structure in normal mammalian cell surface mucins and in tumor cells surface. In normal healthy cells, the glycosylation pattern is more elaborated that in cancer cells. Adapted from Roy, 2013 51.
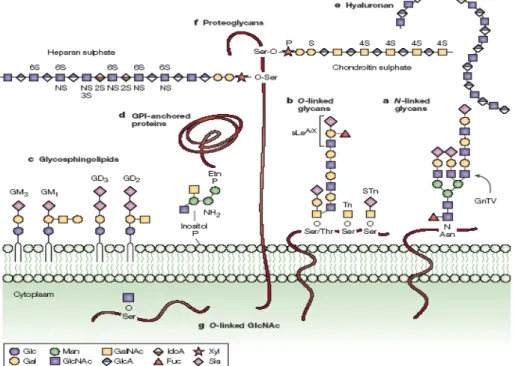
Figure 1.5Cancer associated glycans. A) N-glycans are covalently bound do Asn residues of protein membranes,
with two or more branches, associated with tumor invasion; B) O-linked glycans are covalently bounded to Ser/Thr
residues of glycoproteins or mucins, as SLex/a that are overexpressed in cancer-cell mucins; STn and Tn are tumor
antigens correlated with invasion, that are truncated forms of O-glycans; C) Glycosphingolipds are sugar linked to
the lipidic layer of cell membranes that includes some sialilated structures associated with tumor growth: GM3, GM1,
GD2 and GD3; D) Glycosylphosphatidylinositol (GPI)-linked proteins are anchored to the membrane by a glycan
covalently linked to a phosphatidylinositol. Glycosaminoglycans can also appear as free chains (E); F)
Proteoglycans can be related with cell-growth activation and cell adhesion; G) O-linked N-acetylglucosamine
(O-GlcNac) can be associated with cytoplasmic or nuclear proteins and can even be released to the extracellular
matrix. (Glc – glucose, Gal – galactose, Man – mannose, GlcNAc - acetylglucosamine, GalNAc -
N-acetylgalactosamine, GlcA - glucuronic acid, Fuc – fucose, Xyl – xylose, Sia - sialic acid). Adapted from Fuster,
7 Aberrant glycosylation leads to, consequentially, altered cell/cell and cell/matrix interactions which can explain some abnormality of tumor cells such as unlimited growth, tumor invasion and metastatic potential22 that combined with absence in normal cells, make glycans good biomarkers for diagnosis, prognosis and therapy. Some studies already correlate the high level of some truncated O-glycans with low rates of survival in cancer patients23,24. Sialylated structures of Thomsen-Friedenreich (TF) antigens are also examples of truncated glycans. Many of these glycans are already used in clinical practice and are related to immune system escape, attachment to capillaries in tumor invasion and new adhesion in metastasis. This aberrant glycosylation can be detected in blood tests since some of these are present in the serum18.
α2,6-sialyltransferases have been shown to be upregulated in some tumor cells. ST6Gal I overexpression has already been described in several carcinomas, such as colon, and some studies indicate its upregulation is due to oncogenes activation such as RAS. The high activity of this enzyme is correlated with a poor prognosis and metastasis25. The same has been described for ST6GalNAc 1 enzyme, since it overexpression is the mainly responsible for STn formation and upregulation, a cancer related antigen that has been found in several carcinoma types and that is associated with poor prognosis and metastasis development26.
1.3.1 Thomsen-Friedenreich Antigens
TF antigens or disaccharides Galβ1-3GalNAcα1-Ser/Thr or T antigens, are the core 1 structure of O-linked mucins, thus being present in membrane glycoproteins. They are truncated in the early stages of glycosylation27 and have been correlated with tumor progression and metastases and also the natural human production of antibodies against them is very low in cancer patients27. Cancer cells can lose the ability to synthetize core 1 and in that case, the Tn antigen, GalNAc α1-Ser/Thr, is exposed which is also a carcinoma correlated antigen that occurs in approximately 90% of human cancers. Lastly, Tn can be further sialylated originating the STn antigen.
1.3.2 Sialyl-Tn Antigen
STn (Neu5Acα2-6GalNAcα-O-Ser/Thr or CD175s) is a truncated O-glycan antigen used as an epithelial cancer biomarker. It has been used not only for diagnosis and prognosis, but also for immunotherapy targeting since it is not found in healthy tissue. It is the simplest sialylated mucin-type O-glycan and it is composed by a GalNAc residue α-O-linked to a Ser or Thr residue in a protein that is sialilated on carbon 6.
The sialylation of a single O-GalNAc has been shown to be performed in vitro by two sialyltransferases, ST6GalNAc 1 and ST6GalNAc 2 28. However, studies using transfected cells by either one of these enzymes has demonstrated that in a cellular context, only ST6GalNAc 1 overexpression generates STn structures recognized by anti-STn antibodies29,26,30. It can be associated with a variety of membrane proteins such as mucins, integrins and CD44.
It is expressed in almost all carcinomas and in nearly 80% of CRC. STn expression is associated with oncogenesis and the metastatic ability of cancer cells, being therefore correlated with poor prognosis in cancer patients.
1.4 Study of glycans in vitro and Luciferase enzyme
To track cancer cells in vivo and in vitro, the Luciferase enzyme (LUC) can be overexpressed in cells and then used as a reporter. Luciferase is an enzyme that efficiently catalyzes light production through a chemical reaction, present in bioluminescent living organisms. The chemical reaction requires luciferin, Mg2+ andO2 as co-factors, and, in case of insects, also ATP31. Through cDNA cloning, the LUCIFERASE gene can be introduced into the cancer cells genome by transduction and further expressed. It is widely used as a reporter gene and the detection assay is very sensitive one32. Its detection can be assessed by direct bioluminescence, alternatively, the cells need to be lysate for the enzyme to be approachable.
Firefly luciferase has a wide potential and applicability since it has no endogenous activity in the choose host cells, is able to be detected by a reproducible assay and the protein does not need posttranslational modifications.
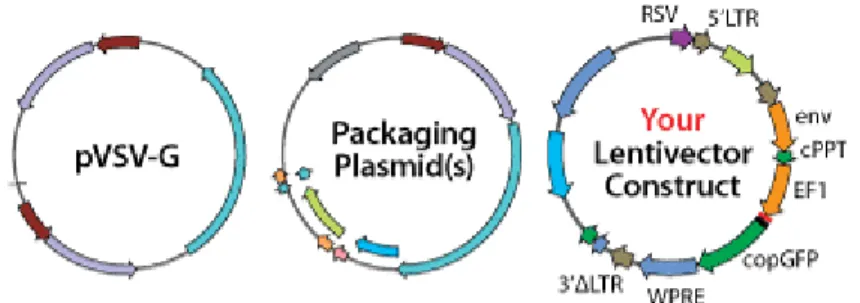
In this thesis work, the LUCIFERASE gene was cloned in a lentiviral vector and this was transduced into CRC cell lines to be further tracked in living organisms, making sure that this genetic modification in the CRC cell lines did not change their glycan expression either way.
1.5 Introduction to the aims of this thesis
9 CRC cells can produce mucin glycoproteins with O-linked oligosaccharides that have been found to express TF antigens. Tn and STn antigens, both examples of these, shown to be highly sensitive and specific tumor-associated antigens in the colon that are absent in normal colon tissue33, making them potential biomarkers. Also, the SLeX antigen is another highly expressed glycan in solid tumors, that have potential as biomarker. This aberrant glycosylation is associated with a poor prognosis, cancer progression and metastasis development.
STn is expressed when over or incomplete synthesis of α2,6-sialylation occurs due to ST6GalNAc 1 overexpression and it has been found in 80% of human carcinomas such as colon adenocarcinomas and that is associated with a poor prognosis35,20. Moreover, SLex provide ligands for selectin adhesion receptors on activated endothelia, platelets or leukocytes what are thought to be involved in metastasis extravasation and its presence is due to the overexpression of fucosyltransferase FUT 636. ST6Gal 1 expression is upregulated in several carcinomas being CRC among them.
In this study, the main goal was to establish experimental genetically modified models based on CRC cell lines expressing both altered glycans and Luciferase reporter. To achive this, the work consisted in two arms.
In the first part, we aimed to establish a CRC cell line overexpressing the STn antigen. To assess this, the LS174T cell line was transduced with the ST6GALNaC I gene. This transduced cell lines were phenotyped to assess the expression of STn antigen. Since this cell line naturally express high levels of other relevant glycans, namely the SLex, but not of STn, it was expected to obtain a CRC cell line that had a dual overexpression of STn and SLex/a antigens. This cell line could also be used in further transduction experiments to overexpress the LUC gene. However, after several attempts to transduce the cell line with lentivirus containing the ST6GALNaC I gene, it was not possible in this work to obtain the desired LS174T cell line overexpressing STn. Further studies are necessary to understand the mechanism behind these results.
11 2 Materials and Methods
2.1 Culture of Colorectal Cancer Cell Lines
Several colorectal cancer (CRC) cell lines were used during this work: SW620, LS174T SW48, SW948 and HT29. All CRC cell lines were kindly provided by Professor FABIO DALL’OLIO from the University of Bologna, Italy. As controls, another cell lines were used, MDA and HEK293 Star cells. All of them had the three variants – the wild type (WT); the empty vector (EV) or MOCK or negative control (NC); and FUT VI or ST6GAL I or STn positive cell lines.
SW620 (ATCC®CCL-227TM) cell line derived from a Dukes’ type C metastatic adenocarcinoma from colon in lymph node from a 51-year-old Caucasian male. LS174T (ATCC®CL-188TM) cell line was established from Dukes’ type B adenocarcinoma of colon from a 58-year-old Caucasian female. SW48 (ATCC®CCL-231TM) derived from Dukes’ type C, grade IV, adenocarcinoma of colon from an 82-year-old Caucasian female. SW948 (ATCC®CCL-237TM) was established from Dukes’ type C, grade III, adenocarcinoma of colon from an 81-year-old Caucasian female. HT29 (ATCC®HTB-38TM) derived from an adenocarcinoma of colon from a 44-year-old Caucasian female.
The used CRC cell lines were adherent and were kept in T25 and T75 culture flasks (SARSTEDT), in a 37°C incubator (Panasonic) with a humidified atmosphere and 5% CO₂ .The culture media used was dependent on the cell line: SW48, SW948 and SW620 cell lines were cultured in Leibowitz’s medium (Lonza) supplemented with 10% of Fetal Bovine Serum (FBS) (Gibco), 2mM of L-glutamine (Gibco) and 100 µg/mL Penicillin/Streptomycin (Gibco); LS174T were cultured in MEM (Biowest) supplemented with 10% FBS (Gibco), 2Mm L-glutamine (Gibco), 100 µg/mL Penicillin/Streptomycin (Gibco), Non-Essential Aminoacids (Gibco) and Sodium Pyruvate (Gibco); HT29 and MDA cell lines were cultured with DMEM (Gibco) supplemented with 10% de FBS (Gibco), 2mM of L-glutamine (Gibco) and 100 µg/ml Penicillin/Streptomycin (Gibco). The medium was changed every three days. For passages, at 80/90% of confluency, the culture was washed with 1X phosphate buffered saline (PBS) and 1X Trypsin-EDTA (TE) (Gibco) was used for cell detachment from the flask, followed by a centrifugation (Eppendorf) step at 200xg for 5 minutes and cultured according to the desired dilution. All cell lines were stored at -80°C resuspended in culture medium and 10% (v/v) o dimethyl sulfoxide (DMSO) (Sigma).
2.2 Techniques
2.2.1 Transduction
Transduction is a gene transfer mechanism through viral infection of host cells that allows genome integration and the consequent expression of the gene of interest. In this thesis work, the viral vector used was a lentiviral one.
gene (VSV-G) and a packing vector. They also have present truncated long-terminal residues (LTR) for self-inactivation37. The coding reagion of human ST6GALNaC I gene was before amplified by PCR and cloned in the pLenti6/V5 Directional TOPO cloning vector containing the CMV promoter, as well for LUCIFERASE. Lentiviral particles were generated by co-transfection of HEK 293 T cells with the three plasmids, using pPACK Lentivector Packing Systems, what was kindly performed by Professor Doutor JOSÉ RAMALHO, CEDOC’s. Our plasmid construct is presented on Appendix 3.
2.2.2 Flow Cytometry
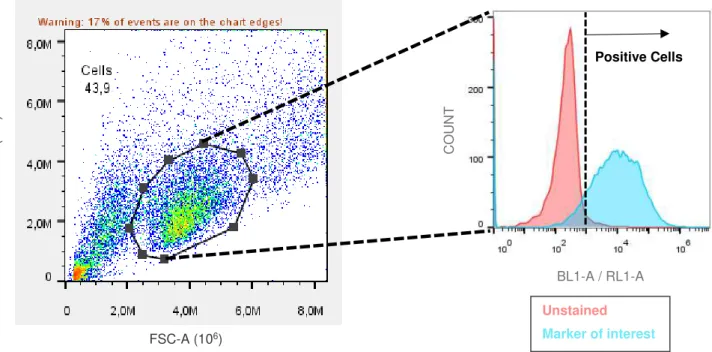
Flow Cytometry analyzes single particles in suspension such as cells, while they flow in a fluid, through a light beam, usually a laser. It is a technique that is able to measure simultaneously particle size, complexity, and fluorescence intensity. These characteristics are determined by how the particle scatters light since its structural complexity scatters light at different angles and quantities. When particles are stained with a fluorophore, the incidence laser excites this molecule making it emit light with a certain wavelength. The fluorescent emitted light is detected, filtered, and amplified to be converted into digital data by a flow cytometer. A flow cytometer allows the determination of the median fluorescence intensity (MFI) or percentage of positive cells that are proportional to the amount of antibody bonded that is proportional to the amount of expressed antigen.
Forward-scattered light (FSC) is proportional to the relative size and area of the particle since scatter at lower angles. Side-scattered light (SSC) is proportional to the cell complexity or granularity, as scatters at larger angles. The correlation of these two measurements leads to a differential population analysis through their physical characteristics.
When a fluorochrome is conjugated with an antibody that recognizes specific receptors, it can be used to detect a cell type according to the antigen at its surface.
The particle characteristics are determined by an optic-electronic system that registers how the particles disperses light and emits fluorescence. Flow Cytometry its formed by three systems: fluidics, that leads the particles to the laser beam; the optic system that its composed by the laser beam and the optic filters that direct the light signals to the proper detectors; and the electronics, that processes the light signals into electronic signals38,39.
13 The Flow Cytometer used in this work was an Attune® Acoustic Focusing Cytometer (Applied Biosystems) with two lasers, red (638nm) and blue (488nm) that allows up to six different fluorescence’s, four for blue laser (BL1: green, BL2: orange, BL3: red and BL4: red) and two for the red laser (RL1: light red and RL2: dark red).
At least 1x10⁴ events were acquired in the Attune Cytometric Software (version 2.1) and all data was analyzed in FlowJo (version10) and GraphPad Prism (version7). Upon the flow cytometry acquisition, the strategy adopted to gate cell population was as described on Figure 2.2.
2.2.3 Fluorescence Microscopy
Fluorescence Microscopy is an optical microscopy type that uses fluorescence to generate an image by enlarging the optic resolution and the contrast of the microscopy image. The image is created using an opening, the pinhole, that allows a better definition to be obtained in thicker samples.
A laser is focused in the limited place for diffraction in the sample from the objective. The emitted fluorescence is focused by the same lens to a specific point in the detector. The pinhole is then placed at this point such that the detector only captures the light prevenient from the focal plane. By plotting several planes, it is possible to generate a three-dimensional image of the sample that is processed by a computer40.
FSC-A (106)
S
SC
-A (1
0
6)
BL1-A / RL1-A
C O U N T Positive Cells Unstained
Marker of interest
The microscope used was a Axiolmager D2 – Zeiss, with a 40x objective and the laser filters of 488 nm and 633 nm to excite FITC and Alexa Fluor 633, respectively. The images obtained were processed by Fiji.
2.2.4 Real Time Polymerase Chain Reaction
The Real Time Polymerase Chain Reaction (RT-PCR) is an enzymatic process that converts RNA into its complementary DNA (cDNA) by reverse transcriptase enzyme action, followed by cDNA amplification by PCR41. It is a very powerful and sensitive tool to analyze and quantify the expression of a gene by mRNA expression. In this thesis, TaqMan technology was used. TaqMan probes are oligonucleotide hydrolysis probes that are dually labelled with a fluorophore linked to the 5’ end with a non-fluorescent quencher linked to the other end of the probe. When closer, the quencher reduces the fluorescence emitted by the fluorophore but with the presence of the target sequence, the probe hydrolysis with it and the exonuclease activity of Taq DNA polymerase, degrades the probe annealed to the target sequence, emitting fluorescence that is detected by the device. This fluorescence emitted is proportional to the amplification42.
Quantification is performed by relative quantification where the change of expression of the target gene is described by comparison with the expression of an endogenous control gene. The ideal reference gene should have a stable and secure expression regardless of the conditions in which it is used, since they are vital to cell survival. In this thesis two housekeeping genes were used, GAPDH (that codes for glyceraldehyde-3-phosphate dehydrogenase) and β-actin. The relative expression was analyzed using the comparative CT mathematical method, 2-ΔΔCT method, from Livak and Schmittgen43. CT stands for Threshold Cycle and corresponds to the intersection of the amplification curve with the threshold line. The threshold fluorescence is defined according to the point at which the fluorescence rises significantly above the background fluorescence level. ΔCT corresponds to the variation between the amplification value of the gene of interest and the endogenous control gene, so ΔΔCT will correspond to the variation between the amplification values of the gene of interest and the variation between all the controls amplification44. Therefore, 2-ΔΔCT, will correspond to the amount of target when normalized with the reference.
2.2.5 Luciferase Detection Assay
15
The luciferase assay offers a nearly instantaneous measure of total luciferase expression in the lysate; therefore, the emitted light is proportional to the luciferase concentration. Although the high efficiency of the assay, the luciferase half-life is less than three hours due to it low intrinsic stability, as a disadvantage.
2.3 Colorectal Cancer Cell Lines Characterization
2.3.1 Transduction Protocol
Before transduction itself, 5x10⁵ cells per well in a 12 well plate, were seeded. The next day, the virus were thawed at room temperature in a concentration of 150 µL of virus to a concentration of 8 µg/ml of polybrene in 2 ml of medium. The cells were washed with 1X PBS and this mixture was placed in the wells. The plate was shaken and incubated overnight, 37º, 5% CO2. The next day the cells were washed again and the new culture medium was placed with 3,2 µg/ml of Blasticidin. This selection process was
performed during approximately two weeks since the plasmid inside the virus had the resistance to Blasticidin antibiotic and the cells that did not incorporate the plasmid, would die.
2.3.2 Cell Phenotype Analysis by Flow Cytometry
2.3.2.1 Flow Cytometry Protocol
Cancer cells were detached with TE from the culture flasks and washed with 1X PBS by centrifugation at 200xg, for 5 minutes. The resultant pellet was resuspended in 1ml of medium and the cells were counted in a 1:10 dilution in a Newbauer chamber (Marienfeld). 2x10⁵ to 3x10⁵ cells per condition were collected in a centrifuge tube and washed again. At this point, we could proceed to a direct antibody staining or to a sialidase treatment as described forward. The desired concentration of cells was then washed with 500 µl of PBS 1X and centrifuged at 1500xg for 2 minutes. The supernatant was discarded
and the previous step was repeated but with 990 µl of 1X PBS. The pellets were resuspended in the
desired volume of 1X PBS to be divided as 100 µl per condition. The primary antibodies were added
and the samples were incubated at 4ºC for 30 minutes. Another wash step was performed with 500 µl
of 1X PBS and centrifuged at 1500xg for 2 minutes. The supernatant was discarded and the pellets were resuspended in 100 µl of 1X PBS. The secondary antibody was added according to the primary
antibody used and the samples were incubated at room temperature for 15 minutes in the dark. At the end of this step the cells were again washed with 500 µl of 1X PBS by centrifugation at 1500xg for 2
minutes. The supernatant was discarded, and the pellets were resuspended in 1 ml of 1X PBS to by analyzed by Flow Cytometry. If required, the cells were fixed in 4% Paraformaldehyde (PFA) to be analyzed later.
2.3.2.2 Sialidase Treatment Protocol
The sialidase treatment was performed to remove the sialic acid from structures according to the experimental case, once it had hydrolyses the α2-6 and α2-3 sialic acid linkage. After the first wash, the supernatant was discarded, and the cells were resuspended in 400 µl of sialidase buffer. This 400µl of
cell suspension was divided between two eppendorf tubes, a sialidase treated one and a non-treated, control. For the sialidase treated one, sialidase (from Clostridium perfringes, Roche) was added at a final concentration of 100 mU/ml. Both samples were incubated at 37ºC, 5% CO2 for 90 minutes during which time, the tubes were stirred to avoid cell deposition.
2.3.2.3 Cell Lines Staining with Antibodies
To assess glycans expression at the cell surface, a flow cytometry assay was performed. The primary antibodies used and their correspondent amounts, and the secondary antibody and respective amount and fluorescence method used are detailed in Table 2.1.
Table 2.1 Antibody description table. Primary antibodies list, correspondent antigens and secondary antibodies, quantities used and fluorescence, used in cancer expressing glycans screening.
Primary Antibody
Antigens Amount Secondary Antibody
Amount Fluorochrome
B72.3 STn 1,5 µL Goat anti-mouse
(Dako)
5 µL FITC
5F4 Tn 8 µL Goat anti-mouse
(Dako)
5 µL FITC
A70-C/C8 Lewis y 5 µL Goat anti-mouse (Dako)
5 µL FITC
CD15 (Biolegend)
Lewis x 2 µL Goat anti-mouse (Dako)
5 µL FITC
CD15s (BD Biosciences)
SLex 3 µL Goat anti-mouse (Dako)
5 µL FITC
antiCD44-APC (Biolegend)
CD44 5 µL _ _ APC
17
(Biolegend) (BD Pharmingen)
CA19.9 (Abcam)
SLea 5 µL Goat anti-mouse (Dako)
5 µL FITC
Carcinoembryonic antigen (ImmunoTools)
CEA 5 µL
Goat anti-mouse
(Dako) 5 µL FITC
2.3.3 Cell Phenotype Analysis by Fluorescence Microscopy
2.3.3.1 Fluorescence Microscopy Protocol
0,4 x 10⁶ cells/mL of LS174T WT, LS174T ST6GALNaC I and 0,2 x10⁶ cells/mL of MDA STn cells were cultured on top of round coverslips inside 12 well plates (Orange Scientific). After 24h, they were washed three times with 1X PBS for 5 minutes. They were then fixed and permeabilized with 200µl of wash
solution (Fixation/Permeabilization Solution Kit from BD Biosciences) for 20 minutes at 4ºC. In order to be labeled with the anti-ST6GALNaC I antibody (2C3 clone), the cells were incubated with 1 ml of wash solution for 30 minutes and then washed three times with 1X PBS for 5 minutes. The incubation with the primary antibody anti- ST6GALNaC I labeled with Cy5, occurred during 30 minutes at a dilution of 1:2 in wash solution. Cells were then washed three times with 1X PBS for 5 minutes. To stain the nucleus, To-Pro3-Alexa Fluor 633 (Invitrogen) was used by covering the cells for 15 minutes and then washed three times with 1X PBS, 5 minutes. Finally, the coverslip was placed face down on the slide, and sealed with montage medium Mowiol (Dabco) and nail polish to be analyzed in the Fluorescence Microscope.
2.3.4 Gene Expression Analysis of ST6GALNACI by RT-PCR
2.3.4.1 RT-PCR Protocol
The first step of the RT-PCR protocol was the RNA extraction using GenEluateTM Mammalian Total RNA Miniprep Kit (Sigma-Aldrich). A lysis solution/2-ME was previously prepared with 10 µL of
2-Mercaptoethanol (Sigma) to 1 ml of lysis solution and the centrifuge was set at 4ºC. Cells were trypsinyzed and centrifuged at 0,4xg for 5 minutes and washed with 1X PBS. 250 µL of lysis
solution/2-ME was added to approximately 5x10⁶ cells and pipetted until no clumps were present. The cell lysate was then collected to a filtration column into a 2ml tube and centrifuged at 12000xg for 2 minutes. The filtration column was discarded and into the resulting lysate was added 250 µL of 70% ethanol and the
resulting solution mixed. Up to 700ml of the lysate/ethanol mixture was pipetted into a binding column in a 2ml tube and centrifuged at 12000xg for 2 minutes. The flow-through liquid was discarded but the collection tube was kept to repeat the previous step if the volume was more than 700ml. 250 µL of wash
DNase I (Quiagen) were added with 70 µL of digestion buffer (Quiagen) by inversion. From this mixture
80 µL were then added into the filter of the binding column and incubated at room temperature for 15
minutes. 250 µL of wash solution 1 was pipetted into the column, centrifuged at 12000xg for 2 minutes
and the flow-through was discarded. The washing step was repeated twice but with 500 µL of wash
solution 2. The biding column, now empty, was again centrifuged at 12000xg for 2 minutes because of the remaining liquid and transferred into a new 2ml collection tube. To this, 55µL of elution solution was
pipetted into the binding column and centrifuged at 12000xg for 2 minutes. The flow-through was again passed through the column and centrifuged at 12000xg for 2 minutes since the purified RNA was then in the flow through liquid.
The RNA conversion to cDNA was performed using a High-Capacity cDNA Reverse Transcription Kit as described in the following table.
Table 2.2Conversion mix content and respective amounts (µL)
Components Amounts (µL)
Purified RNA 50
Buffer 10
Primers 10
dNTPs 4
Reverse transcriptase enzyme 7,5
RNase free H2O 18,5
The thermocycler machine used was a Programmable Thermal Controller PTC-100TM (MJ Research, Inc.) and it was set according to the settings listed in table 2.3. After the cDNA conversion, the samples could be stored at -20ºC.
Table 2.3Settings of the used program to cDNA conversion
Step 1 Step 2 Step 3 Step 4
Temperature (ºC) 25 37 85 4
Time 10 min 120 min 5 secs
∞
The RT-PCR experiment was performed according to table 2.4 in RT-PCR tubes (Simport), to a 10µL
19 Table 2.4RT-PCR mix content and respective amounts
Components Amounts (µL)
Diluted probe 1:4 2
cDNA 2
RNase free H20 1
Master Mix Fast (Applied Biosystems) 5
Each experiment was performed in duplicates and using two endogenous controls. The probe of interest was ST6GALNACI (Applied Biosystems) and the endogenous were GAPDH (Applied Biosystems) and β-actin (Applied Biosystems). The samples were runned in RotorGene 6000 (Corbett) machine according to table 2.5 and the results were analyzed has previously described followed by GraphPad Prism 7 (GraphPad Software, Inc).
Table 2.5Conditions for RT-PCR assay
Step 1 (1 cycle) Step 2 (40-50 cycles)
Temperature (ºC) 95 95 60
Time 20 secs 3 secs 30 secs
2.3.5 Luciferase Expression Assessment
SW48 MOCK and SW48 ST6GAL I, SW948 MOCK and ST6GAL I, SW620 MOCK and SW620 FUT VI and HT29 MOCK and HT29 FUT VI were transduced with the lentiviral vector pLenti6/V5-D-TOPO containing luciferase gene from firefly that codes for luciferase enzyme, originating SW48 MOCK LUC, SW48 ST6GAL I LUC, SW948 MOCK LUC, SW948 ST6GAL I LUC, SW620 MOCK LUC, SW620 FUT VI LUC, HT29 MOCK LUC and HT29 FUT VI LUC.
2.3.5.1 Luciferase Detection Assay Protocol
To assess luciferase expression, a Luciferase Assay System Kit (Promega) was used. This kit can improve the kinetics of the chemical reaction to enhance the light intensity created after reaction by incorporating coenzyme A (CoA).
24 hours before the detection assay, 105 cells per well were cultured in a 96 well plate. The following day, the medium was removed, and the cells were washed with 1X PBS. 20 µl of 1X lysis buffer RLB
from the kit was added to each well and a single freeze-thaw cycle was performed to ensure the complete lysis. At room temperature, 100µl of luciferase assay reagent were added, composed by
2.3.5.2 Colony Picking for SW48 and SW948 Cell Lines
The luciferase enzyme used for transduction in this thesis was isolated from firefly (Photinus pyralis). SW948 MOCK, SW948 ST6GAL I, SW48 MOCK and SW48 ST6GAL I had to be selected by a colony picking method and not by the usual antibiotic one, since they were previously transduced with a plasmid with the same antibiotic resistance.
To performed it, the cell cultures were kept growing until they could form visible and isolated colonies. Twenty-four colonies were then picked by small papers imbibed in trypsin that would detach them. These colonies were cultured in 24 well plates (Greiner Bio-One Cellstar) and then tested to check for chemiluminescence as previously described.
2.3.6 Cell Growth Curves
To establish cell growth curves of each cell line, a first culture with 80/90% confluency was counted in a Neubauer Chamber (Marienfeld) at 1:2 dilution with trypan blue and ten T25 flasks were cultured with the initial number of 20000 cells/ml each. The medium was changed every five days and every day for 10 days, at the same hour, one flask was tripsinyzed and the number of cells were counted as explained above, using a Neubauer Chamber. The curves were then constructed using the Log10 value and analyzed in Excel (Microsoft).
21 A typical growth curve for cultured cells should have a sigmoid pattern of proliferation and the growth phases associated are defined as: Lag Phase, an adaptation period in which cells do not divide; Log Phase, where the cells are more active in proliferation and have an exponential increase of cell density; Plateau Phase, where proliferation slows due to confluency; and Decline Phase, where cells start dying due to the end of cell cycle46.
2.4 Statistical Analysis
Experimental data was analyzed using GraphPad Prism 7. Statistical differences were determined using Student’s t-test, considering a p-value < 0,05 statistically significant, denoted by “*”.
23 3 Results
In this work, we aimed to develop colorectal cancer (CRC) cell line models overexpressing both aberrant glycans and Luciferase to be used in tracking assays. For that purpose, CRC cells expressing aberrant glycans were established through overexpression of glycosyltransferases involved in the glycan biosynthesis and, transduced with LUCIFERASE (LUC) gene. These CRC cell line models can be used to assess the impact of glycan overexpression in cell functions and the bioluminescence produced by Luciferase enzyme can be used to track cells in vitro an in vivo. In this work, we were able to assess cell phenotype of a set of CRC cell lines. In the future, the cell line models here developed can be used to follow and evaluate tumor formation, proliferation, and metastasis development in living organisms. In particular, the project was developed in two separated parts presented in the following sections. The first part described in section 3.1 had a specific aim to establish a CRC cell line overexpressing the sialyl-Tn (STn) antigen. The work in this section thus consisted on the genetical medication of a CRC cell line that did not expressed STn, the LS174T cell line, by transducing it with the ST6GALNaC I gene. This transduced cell line was phenotyped to assess the expression of STn antigen.
The second part, described in section 3.2, had a specific role to establish CRC cell lines expressing the Luciferase enzyme. The work in this section, thus consisted on the genetical modification of several aberrant glycan expressing CRC cell lines, with the LUC gene. The resulting transduced cells were then phenotyped to assess their glyosidic profile together with Luciferase activity.
Table 3.1 Summary table for the used cell lines
CELLS TRANSDUCED TRANSFECTED NEEDED
LS174T ST6GALNaC I
LS174T ST6GALNAc I ST6GALNaC I LUCIFERASE
LS174T MOCK LUCIFERASE
SW948 ST6GAL I ST6GAL I LUCIFERASE
SW948 MOCK LUCIFERASE
HT29 FUT VI FUT VI LUCIFERASE
HT29 MOCK LUCIFERASE
SW48 ST6GAL I ST6GAL I LUCIFERASE
SW48 MOCK LUCIFERASE
SW620 FUT VI FUT VI LUCIFERASE
3.1 Establishment of a CRC cell line overexpressing STn Antigen
As mentioned before, in this part of the study, we aimed to establish a CRC cell line overexpressing the STn antigen. To asses this, the LS174T cell line was transduced with the ST6GALNaC I gene, a flow cytometry was performed using the mouse anti-STn antibody, B72.3, as described on section 2.3.1.1. The STn antigen was expected to be expressed in the ST6GALNaC I transduced LS174T cells and on MDA STn+ cells, a previous transduced cell line expressing STn used as positive control. Although the results observed were the expected for MDA STn+ cells, with a 67,9% of expression (presented in red in the graph below), LS174T ST6GALNac I did not show any STn expression at cell surface, since only 2,08% of the population were positive for the fluorescence read.
The ST6GALNaC I expression in the transduced cell lines was assessed using a Real Time Polymerase Chain Reaction (RT-PCR). The expression in the LS174T cell lines transduced or not with ST6GALNaC I gene was compared in between and also with a positive control, the breast cancer cell line, MDA STn+. As shown in Figure 3.2, through RT-PCR, the expression of ST6GALNaC I in the LS174T ST6GALNaC I transduced cell line was very low, 72,42. As expected, the positive control MDA STn+ cell line showed a positive expression and, the negative control, LS174T WT cell line showed a negative expression.
A
B
25 No STn expression does not necessarily have to be associated with ST6GalNAc 1 absence. Therefore, ST6GalNAc 1 presence was assessed. This assay was performed by Fluorescence Microscopy using an anti- ST6GalNAc 1 antibody that was recognized by a secondary, Cy5. ST6GalNAc 1 expression was observed in the Fluorescence Microscopy images on LS174T ST6GALNaC I transduced cells as presented above, by a red fluorescence around the cell nucleus (on green), being concordant with the Golgi Apparatus localization, where the glycosyltransferases are located. The controls used were LS174T WT variant with no red fluorescence and LS174T ST6GALNaC I stained with the secondary antibody only.
At this point the presence of the STn precursor had to be controlled and another flow cytometry was performed, using sialidase treatment to remove the sialic acid and uncover the Tn antigen. For this, the anti-Tn antibody used was 5F4. The results showed an absent expression of Tn on LS174T WT and LS174T ST6GALNaC I transduced cells, explaining why STn cannot be present in these cells, although the enzyme responsible for Tn sialylation is expressed.
1068,065408 15,70643969 72,41839434 0 200 400 600 800 1000 1200
MDA STn LS174T WT LS174T ST6GalNac I
Re lat iv e m RN A l ev e ls
ST6GALNACI Expression
LS174T WT LS174T
A
Nuclei – ToPro3
ST6GalNAc 1 – Cy5
Nuclei – ToPro3
ST6GalNAc 1 – Cy5
Nuclei – ToPro3
ST6GalNAc 1 – Cy5
LS174T WT LS174T ST6GALNaC I IIAb LS174T ST6GALNaC I anti-ST6GalNAc 1
A B C
Figure 3.2 ST6GALNaC I Expression Assessment by RT-PCR. In the presented graph is shown the relative mRNA levels of the ST6GALNaC I gene. The yy axis represents the relative mRNA levels and the xx axis the cell line in study.
A
B
C
D
27 To check the cell line transduction efficiency, the transduction was repeated in HEK293 Star, a cell line well known to be efficiently transdusable and the results observed were slightly positive for STn expression with the same anti-STn antibody used before, by flow cytometry.
3.2 Luciferase Expression and Luciferase Cell Lines Characterization
After lentiviral transduction with LUCIFERASE gene and transduced cells respective selection methods, SW948 MOCK LUC, SW948 ST6GAL I LUC, SW48 MOCK LUC, SW48 ST6GAL I LUC, SW620 MOCK LUC, SW620 FUT VI LUC and HT29 MOCK LUC and HT29 FUT VI LUC cell lines were tested for Luciferase expression through bioluminescence emission after cell lysis and substrates addition. The C
A
B
C
D
lysates were tested in Chemidoc with a 50 seconds exposition period in a 96 well plate where the cells were cultured the previous day in a concentration of 105 cells. As bioluminescence baseline control, a well with only luciferin reagent was added for each assay.
3.2.1 SW948 MOCK LUC Cell Line
In SW948 MOCK LUC cell line, from twenty-four isolated colonies, only four were positive for luciferase what was observed by a higher bioluminescence emission as shown in figure 3.6. After two weeks in culture, from these four colonies, only two of these maintained Luciferase expression.
It was also necessary to confirm that Luciferase expression in the cells did not interfer with some tumour associated glycans that our research group is interetsed in. To assess it, the CRC cell lines SW948 MOCK expressing or not the LUC gene were phenotyped by flow cytometry using several antibodies reactive against glycans. For this purpose, the B72.3 antibody was used to assess STn, the CA19.9 antibody was used to asses SLea, the CD15s to assess SLex, CD15 to assess Lex, anti-Lewis Y to assess Lewis Y, the 5F4 antibody to assess Tn, and the HECA-452 to assess SLex/a. Two proteins known to be potentially carriers of theses glycans were also analysed, namely CD44 and the carcinoembryonic antigen, using the appropriate antibodies. No significant differences were observed when comparing SW948 MOCK and SW948 MOCK LUC cells as observed in the histograms above. HECA-452 and anti-CD44 stainings manteined their expression as expected.
CTRL
SW948 MOCK LUC Lysates SW948 MOCK LUC Lysates
29 Two ten-day cell growth curves, along with the correspondent photo report was also carried out to compare both cell lines in terms of proliferation rates and confluency. The point correspondent to Day 2 show a higher number of cells/mL in SW948 MOCK LUC cell growth curve, in comparison to SW948 MOCK. Nevertheless, no remaining differences were observed in the cell growth curves and in the photo report.
A
B
C
D
4 4,5 5 5,5 6 6,5 7
0 2 4 6 8 10
Lo g 10 ( Ce ll s/mL ) Days
SW948 MOCK Luc
4 4,5 5 5,5 6 6,5 7 7,50 2 4 6 8 10
Lo g 10 ( Ce ll s/mL ) Days
SW948 MOCK
31 Table 3.2 Cell Morphology During Prolonged Culture. Table shows microscope images comparing the confluency and cell morphology in two cell lines the SW948 MOCK and SW948 MOCK LUC. The left columns correspond to the 40x magnification and the ones on the right the 100x magnification.
SW948 MOCK 40x
SW948 MOCK LUC 40X
SW948 MOCK 100X
SW948 MOCK LUC 100X
Day 1
Day 2
Day 3
Day 4
Day 5
3.2.2 SW620 MOCK, SW620 FUT VI, HT29 MOCK, HT29 FUT VI, SW948 ST6GAL I, SW48 MOCK and SW48 ST6GAL I Cell lines
For all the remaining cell lines, the same luciferase expression analysis was performed. For SW620 MOCK and SW620 FUT VI LUCIFERASE transduced, no expression was observed. To SW48 MOCK and SW48 ST6GAL I LUCIFERASE transduced, the same absence of Luciferase expression was observed. Despite these negative results, eight isolated colonies from SW948 ST6GAL I LUC, HT29 MOCK LUC and HT29 FUT VI LUC were positive for luciferase expression as presented on image 3.9. From SW948 ST6GAL I LUC the chosen colonies were those correspondent to wells G8, G9, H1, H8, H9 and H10.
Day 7
Day 8
Day 9
33 HT29 MOCK LUC Lysates
HT29 FUTVI LUC Lysates
CTRL
CTRL
SW948 ST6GAL I LUC Lysates
Figure 3.9 Luciferase expression in HT29 MOCK LUC, HT29 FUT VI LUC and SW948 ST6GAL I LUC