15ª Conferência da Associação Portuguesa de Sistemas de Informação (CAPSI 2015) 02 e 03 de Outubro de 2015, Lisboa, Portugal
270 Nuno Silva, Instituto Superior Técnico, Portugal, [email protected]
Marcelo Silva, INOV INESC Inovação, Portugal, [email protected] Carlos Mendes, INOV INESC Inovação, Portugal, [email protected]
Miguel Mira da Silva, Instituto Superior Técnico, Portugal, [email protected]
Abstract
Process discovery provides a set of methods and techniques to help understand the reality of operating processes in an organization. Process Mining is a well-recognized method by academia and the industry that focuses on workflow discovery. By analysing event data from running processes it is possible to discover workflow models that, despite being executed, were not completely known and understood in detail by the stakeholders. In this paper we describe a field study in which we applied the Process Mining approach to a different target than the usual business processes: career progression based on categories. The field study took place in a public entity with 585 workers. After a results analysis that included an interview with a stakeholder we found the advantages of applying Process Mining techniques to this context. Some of these findings were somewhat predictable, while others raised some interesting thoughts.
Keywords: Process Mining, Process Discovery, Workflow Management, Field Study, Career progression
1.
INTRODUCTION
Nowadays the term workflow management is widely used throughout the world either in organizations as means of conducting the management of its business processes or in academia where new modelling techniques and capabilities concerning this area are proposed or existing ones improved. By making graphical process definitions, one can configure workflow management systems to support business processes [Van Der Aalst 2004].
Workflow mining, most commonly known as Process Mining, is to construct a workflow model (as means of a Petri net) given a workflow log with all the instances (cases), activities, timestamps, resources and other data that are part of a process. These event logs are provided by workflow management systems.
Process Mining is useful for finding out how people and/or procedures really work and for Delta analysis, i.e., comparing the actual process with some predefined process. Such a model
specifies how people and organizations are assumed/expected to work. By comparing the descriptive or prescriptive process model with the discovered model, discrepancies between both can be detected and used to improve the process [Van Der Aalst 2004].
The Process Mining techniques were chosen in the context of the First Sight Model (FSM) project to extract the processes of the applications developed using Genio. Genio is the rapid development solution from Quidgest, the FSM project promoter. These processes correspond to the layer with highest level of abstraction of the framework that was developed in the FSM project. By using Process Mining we saved time in the process elicitation step, since it gave us the initial process models that were used as the basis of the workflow engine.
The contribution of this paper is not focused on the Process Mining algorithm used, but on the application of the most used algorithms in an unusual context: career paths. Therefore, we are not focused on finding new algorithms or proposing improvements to existing ones, instead we are analysing which are the results of applying existing Process Mining techniques to career path progress data. Accordingly, this paper objective is to answer to following question:
Is Process Mining suitable as a process discovery method to analyse career progress?
In order to answer this question we applied Process Mining techniques to career progress data of a public institute. We retrieved results of the field study concerning career progress speed (average time between career categories), most current career paths, outlier career paths, number of employees that passed between categories, and between which categories the progression is faster.
The paper is structured as follows. We start by describing the related work of this research (Section 2). In Section 3, we describe the field study at a Portuguese public organization. In Section 4, we explain the evaluation process and discuss the results. Finally, we present our conclusions (Section 5).
2.
RELATED WORK
In this section we make an overview on the principle of Process Mining (also known as Workflow Mining) and the main methods and applications supporting this principle from which value can be gathered.
2.1. Process Mining
Workflow management offers a set of capabilities necessary for automating structured business processes. Workflow management systems are tools for supporting workflow management that can be configured through the use of models describing the life-cycle of a workflow instance.
Besides pure workflow management systems, other systems have adopted workflow technology such as ERP (Enterprise Resource Planning) systems like SAP, CRM (Customer Relationship Management) software, etc. [Van Der Aalst 2004].
Some issues typically arise when applying this type of workflow technology. One of the problems is that these systems require a workflow design. Modeling a workflow is not a trivial task. To design a proper model one requires deep knowledge of the workflow language and understanding of what is required through stakeholder discussion. Therefore, instead of starting by the workflow design, we start by gathering information about the workflow processes in runtime. For that one assumes that it is possible to record events such that [Van Der Aalst 2004]:
1.
“each event refers to a task (i.e., a well-defined step in the workflow),”2.
“each event refers to a case (i.e., a workflow instance), and”3. “events are totally ordered (i.e., in the log events are recorded sequentially, even though tasks may be executed in parallel).”
Transactional systems (e.g., ERP, CRM), or workflow management systems offer this information in some form. This information called workflow logs are then used to construct a process specification, which adequately models the behaviour registered. The term Process Mining is used for the method of discovering a structured process description from a set of real executions [Van Der Aalst 2004].
Process Mining is useful for finding out how people and/or procedures really work. Take for example processes supported by an ERP system like SAP (e.g., a procurement process). Such a system logs all transactions, but in many cases does not enforce a specific way of working. In such an environment, Process Mining could be used to gain insight in the actual process [Van Der Aalst 2004].
Furthermore, Process Mining is a useful tool for Delta analysis, i.e., comparing the actual process with some predefined process. In many situations, there is a descriptive or prescriptive process model. Such a model specifies how people and organizations are assumed or expected to work. By comparing the defined process model with the discovered model, discrepancies between both can be detected and used to improve the process [Van Der Aalst 2004].
There are many other benefits of using Process Mining related to process resources and other types of process data that can help increase process awareness, finding bottlenecks caused by resources, etc. This and the comparison between actual processes and predefined processes can be used to trigger Business Process Reengineering (BPR) efforts [Van Der Aalst 2004].
In the next subsections we discuss in more detail some of the methods and techniques of Process Mining.
2.2. Methods and techniques of Process Mining
Process Mining provides a wide range of methods and techniques from which valuable insight concerning processes can be achieved. In the next subsections we briefly describe some of the most popular techniques.
2.2.1. Conformance Checking
Conformance dictates, in the Process Mining context, whether or not there is a good match between the recorded events and the model [Rozinat 2008]. Consider Figure 1, where conformance checking is positioned in the broader context of Process Mining techniques. While discovery aims at the automatic extraction of a process model from log data, conformance checking is concerned with the comparison of an existing process model and a corresponding log.
Figure 1 - Conformance checking in the boarder context of Process Mining (from [Rozinat 2008])
An organization typically documents its processes in some form. As stated in the previous section, a process model may be of a descriptive or of a prescriptive nature. Descriptive models try to capture existing processes without being normative. Prescriptive models describe the way that processes should be executed. Even if the process model and the event log are fully compliant, it is interesting to see how frequent specific parts in the model are actually used, and to potentially remove obsolete parts which otherwise would need to be maintained [Rozinat 2008].
quantifiable metric ranging from 0 to 1. Unfortunately, a good fitness does not imply conformance. It is easy to construct Petri nets that are able to parse any event log. Although such Petri nets have a fitness of 1 they do not provide meaningful information as illustrated by Figure 2 [Rozinat 2008].
Figure 2 - Fitting models do not need to be a good representation of the observed behaviour (from [Rozinat 2008])
Therefore, a second dimension was introduced: appropriateness. Appropriateness tries to capture the idea of Occam’s razor, i.e., “one should not increase, beyond what is necessary, the number of entities required to explain anything” [Rozinat 2008]. So, if one wants to analyse conformance these two dimensions must be considered. First, the fitness between the log and the model needs to be ensured and second, the appropriateness of the model can be analysed with respect to the log [Rozinat 2008]. Together they allow for the quantification of conformance.
2.2.2. Social Network Discovery
Process Mining uses sociometry methods [Wasserman 1994], [Scott 1994] e [Burt 1983] to discover the interpersonal relationships of the resources executing the process. The end result is a Social Network (SN) of all the process resources and their respective relations.
Many enterprise information systems store relevant events in a more structured form such as the enabling, start and completion of activities [Van Der Aalst 2005], [Leymann 2000], [Jablonski 1996] [Fischer 2001] e [Van Der Aalst 2002] . When people are involved in events, logs will typically contain information on the person executing or initiating the event.
Aalst [Van Der Aalst 2005] states that “An event may be denoted by (c, a, p) where c is the case, a is the activity, and p is the person. Events are ordered in time allowing the inference of causal relations between activities and the corresponding social interaction. For example, if (c, a1, p1) is directly followed by (c, a2, p2), there is some handover of work from p1 to p2 (note that both events refer to the same case). If this pattern occurs frequently but there is
never a handover of work from p1 to p3 although p2 and p3 have identical roles in the organization, then this may indicate that the relation between p1 and p2 is stronger than the relation between p1 and p3 [Van Der Aalst 2005].”
By considering the above one can build a social network expressed in terms of a graph as illustrated in Figure 3.
Figure 3 - Sociogram based on an event log (from [Van Der Aalst 2005])
To sum up, Social Network Analysis (SNA) extracts information from event logs and constructs a sociogram that can be used to analyse interpersonal relationships in an organization. These sociograms are based on the observed behaviour from the log and uses events like the delegation of work from one individual to another. Figure 4 shows a discovered SN using a SNA tool.
2.2.4 Process Mining applications to career progress
We did not found direct applications of Process Mining techniques to career progression data. This absence does not undermines our motivation in taking this research. Indeed, the application of Process Mining to unusual contexts is endorsed by the community and there are several researches in that case [Edgington 2010], [Nakatumba 2010] e [Van Der Aalst et al.
2010].
The most common analysis applied to career progression data is data mining, such as in [De Bruin 2006]. Data mining applied to these kind of contexts is suitable for finding correlations between career paths, however, by applying Process Mining techniques one can derive more clear career paths, as we show in this paper.
2.3.
Summary
In this section we provided a brief related work on the subject of Process Mining. Process Mining has the goal of extracting information from transaction logs and with it discovering process models that reflect the reality of the operating process. Furthermore, besides this play-in approach, Process Mplay-inplay-ing uses the discovered process and the event log to pplay-inpoplay-int deviations regarding a normative process and from there, propose extensions to the running process or refinements to the normative one based on what is performed in reality (if those deviations prove to be beneficial to the outcome of the process). Finally, by combining Process Mining and SNA approaches, it is possible to discover the processes Social Network and perceive how the processes workload is being handled across all the process resources.
3.
FIELD STUDY - APPLYING PROCESS MINING TECHNIQUES TO CAREER
DEVELOPMENT DATA
The field study described in this paper took place in the context of the First Sight Model (FSM) project 1 . FSM project, Quidgest’s individual QREN project number 30283, has the
objective to build a framework based on multiple abstraction layers that facilitates the software development and the Information Systems evolution. Process Mining was used to identify the processes behind the applications developed with Genio (the rapid development solution from Quidgest).
Process Mining is typically applied to “process-based” cases, i.e, field studies where the software or reality observed are following well-defined processes. In those cases, the objective of the
Process Mining analysis is to take conclusions about the performance and sequence of activities, always taking into account the standard processes defined previously.
In this paper, the objective is to apply Process Mining to unexplored field studies where this type of analysis brings added value to the organizations, providing conclusions that would be difficult to obtain without this.
Within Quidgest and Genio software applications, we found some cases where the application of Process Mining would be innovative, one of them, the Career Progression of a Portuguese Public Organization. This organization is accountable for promotion, enhancement and sustainability of Tourism activities and in 2014 had 585 employees.
The Career Progression was chosen because it is not a process "as-is", but it can be seen as a process if we consider that each employee is an instance/case of the process and each professional category is an activity. The date when an employee passed from a category to another is the timestamp.
3.1. Collect Data
As mentioned before, we used data from Quidgest, more specifically, from Genio software. After the decision of using Career Progression as field study to this paper, the next step was to collect the right data to apply the right Process Mining algorithms. Quidgest has many clients with his Human Resources software deployed. For this research we used the data of one client that uses the HR software since 35 years ago, i.e, has data from 35 years of careers. So, to collect the data about the careers of the employees of that organization, we met with the head of Human Resources from Quidgest because the experience of someone inside of business is important to collect and understand the right data. With him we extracted the data from Genio to an excel spreadsheet.
After exporting, data formatting was done, because data was not in the correct format. One of the problems was the accuracy of the names of categories, because there was not a coherence between the names of all categories. After that, we had to normalize the career progressions, since the rules of the progression have been changed over the years. Lastly, some errors in the data (loops in categories) were fixed in the final export excel spreadsheet. All these corrections were done with the help of Human Resources chief from Quidgest and these were found by importing the excel spreadsheet to Disco [Gunther 2012] and analyzing quickly the overview Map that Disco produced.
3.2. Apply Process Mining using Disco
The purpose of this paper is to apply Process Mining to unexplored field studies, as mentioned before. So, we focused on the quality of the data collected and on a deep analysis
to take useful conclusions to the Process Mining research. We decided to use a software which already has the algorithms implemented and is simple and intuitive to use - Disco [Gunther 2012].
Disco uses an intuitively understandable and 100% truthful process map visualization. The thickness of paths and coloring of activities show the main paths of the process flows, and wasteful rework loops are quickly discovered [Gunther 2012].
The Disco miner is based on the Fuzzy miner, but has been further developed in many ways. The Fuzzy Miner was the first mining algorithm to introduce the “map metaphor” to Process Mining, including advanced features like seamless process simplification and highlighting of frequent activities and paths [Gunther 2012].
Disco matched the expectations and with it, we have made all the analysis we needed.
3.3. Results
In this section we present the results obtained from the application of Process Mining in the career progression of a public organization. First we describe a set of statistics that provided initial insight of the reality of the organization and what could be expected from the discovered process map. Then, we analyse the discovered process map in terms of frequency, performance and the relationship between both. In the end, we summarize the results and state some conclusions.
3.3.1 Event Log Statistics
As a first approach, after importing the event log into the Disco tool, we analysed the respective log from a statistics perspective. The event log was composed of 714 events, a total of 51 different career categories, and 585 cases (people associated to the organization). The log timeline goes from 17-06-1980 up to 01-04-2015.
By analysing the number of events per case we came to the conclusion that most people (cases) only have registered a single change in category. To be more precise, 482 people only have one category registration, 86 people have two registrations, 12 people with three registrations, 2 people with 4 and 5 category registrations and finally, only 1 person had six registrations. Figure 5 Illustrates these findings.
Figure 5 - Events per case chart
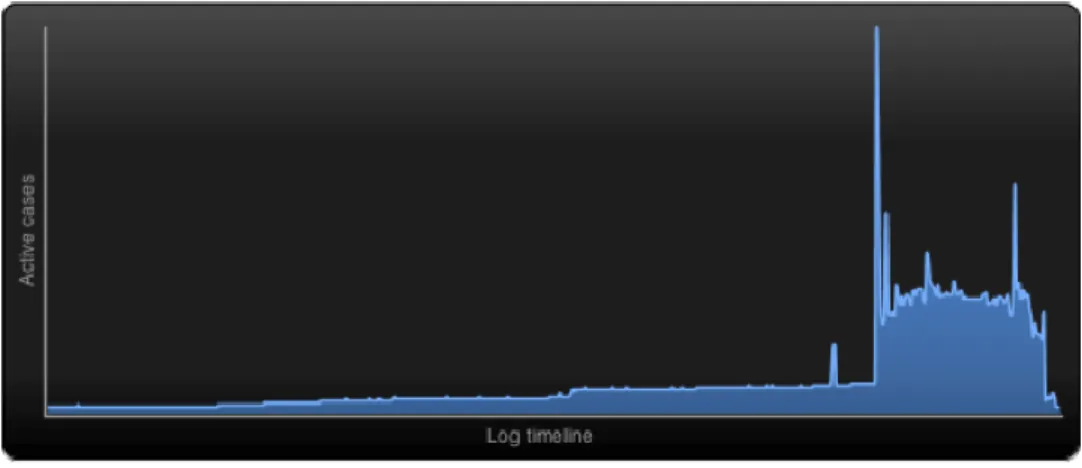
We can conclude from these statistics that, although the records are from a period of 35 years, there are indeed few records of the career progression of the organization’s employees, meaning that, concerning this particular organization, people do not change their category as frequently as it would be expected. Probably in the private sector we could observe a completely different scenario since private organizations tend to be more dynamic in terms of career progression than in the public sector. Would be interesting to compare both perspectives in future work. Furthermore, by analysing the active cases over time, we observed that most active cases (employees) are distributed in the last period of the log timeline. Figure 6 illustrates this.
Figure 6 - Active cases over time chart
This might have a direct relation with the production year of the career progression system. That would explain the drastic change in the chart regarding the number of active cases after the year of 2008. Next we analyse the discovered process map.
3.3.2. Discovered Process Map
In order to obtain an understandable and well-defined process map that clearly showed the category progressions of the organization, a detail filter was applied to the initial process map shown in Figure 7.
Figure 7 - Discover Process Map (Overview)
As it is clearly observed in the figure above the discovered process in its “as-is” state is hard to understand from a workflow perspective. Therefore, we applied a detail filter that would filter the discovered process map by its most frequent activities (categories) and most frequent paths between those activities. We used a percentage of 20% for both activities and paths resulting in the process map illustrated in Figure 8.
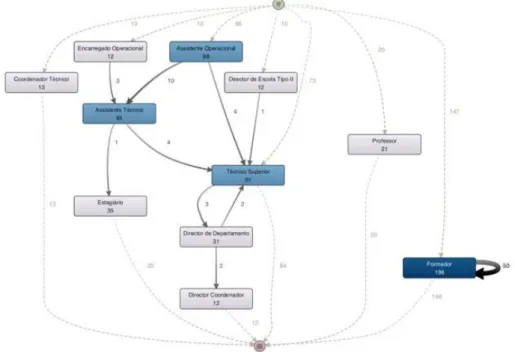
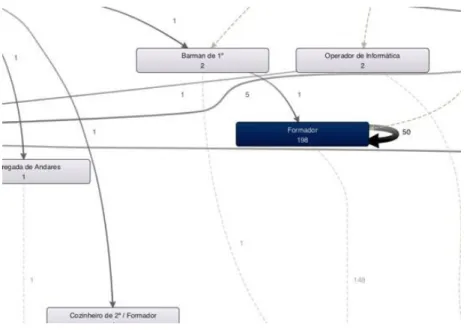
The process is mainly composed of 11 different categories and 10 paths connecting those categories. Some categories do not possess any kind of relation with the remaining categories, which is why they are only connected to the source and sink nodes (e.g. Coordenador Técnico – Technical Coordinator, Professor - Professor, etc.). The more bluish and darker nodes correspond to the categories with a higher number of registrations. Each number below the name of the category is the number of people registered in that category. The number next to each path represents the number of people that progressed from a category A to a category B. In this scope of frequency we are only considering the absolute frequency. The categories with the highest number of employees, in descendent order, are as follows:
Formador - Trainer (198 employees)
Técnico Superior - Senior Technician (91 employees)
Assistente Operacional - Operational Assistant (88 employees) Assistente Técnico - Technician Assistant (85 employees)
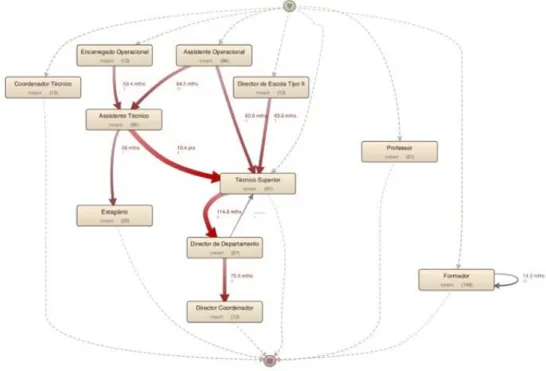
Concerning performance, we took into consideration the mean duration of each category progression, i.e., the average of all path durations between every two categories. We observed that there were two main paths that would stand out from the remaining ones as Figure 9 illustrates, those being:
Assistente Técnico -> Técnico Superior (10,4 years)
Técnico Superior -> Diretor de Departamento – Department Director (114,6 months~ 4.5 years)
By considering the mean duration between the category progressions of an employee’s career based on the process map shown above, one can verify category progression duration of approximately 5 years between the first set of categories. The duration of these progressions becomes considerably higher in the medium set of categories now being of approximately 10 years (two times higher than the initial set of categories). Although, there are exceptions such as the progression from Assistente Técnico to Estagiário – Intern with an estimated duration of 4 years. At the end phase of the progression process, the progression duration becomes again smaller as observed in Figure 9 from Director de Departamento to Director Coordenador – Coordinator Director (approximately 6 years). Being a public organization and considering that most of the records were made in the last few years, it is somewhat expected that the mean duration of progression between mainly the middle categories is considerably high, mostly due to the economical crisis of the country.
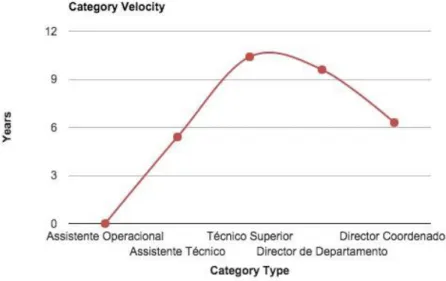
We also performed a velocity analysis to one career to see if the career progression of one employee follows a regular velocity when passes through all categories. The career analyzed was Assistente Operacional -> Assistente Técnico -> Técnico Superior -> Director de
Departamento -> Director Coordenador. The conclusion is illustrated in Figure 10 and as we
can see the velocity is not constant. In the beginning of the career passing from Assistente Operacional to Assistente Técnico took 5.4 years, then the velocity decreased passing to Técnico Superior, which took almost twice, 10.4 years. From Técnico Superior to Director de Departamento the velocity remained almost constant, decreased 0.8 years, to 9.6 years. Finally the last passage from Director de Departamento to Director Coordenador again increased the velocity to 6.3 years.
We can conclude that career progressions start with a high velocity, then the velocity decreases in the middle categories of the career and in the final phase of the career, the velocity increases again until the end.
Figure 10 - Velocity Graph of Career Progression
In the end we tried to correlate both Absolute Frequency and Mean Duration to understand if they had some sort of relation with each other. We noticed that in most paths, regardless of the mean duration being high or low, the path frequency was low. This has to do with the few case variants that were obtained from the long, i.e. the diversity of cases was low. Furthermore, we only collected 585 cases (employee registrations) and from those 585 cases, only 359 actually relate to the discovered process model. Not only that, the fact that this log is from a public organization, it is known that the progression hierarchy is relatively slow and bureaucratic, which is why the 35 years of collected data are possibly not enough to clearly understand a complete career progression of a public employee in this specific context.
Despite all the above, one can see that the paths Assistente Operacional -> Assistente Técnico and Formador -> Formador are the ones that happen more frequently and with less duration (10 times – 64,3 months and 50 times – 14,5 months respectively). Figure 11 shows the relation between the frequency of the categories and the mean duration of each category progression
Figure 11 - Discovered Process Map (Relationship Between Frequency and Performance Views)
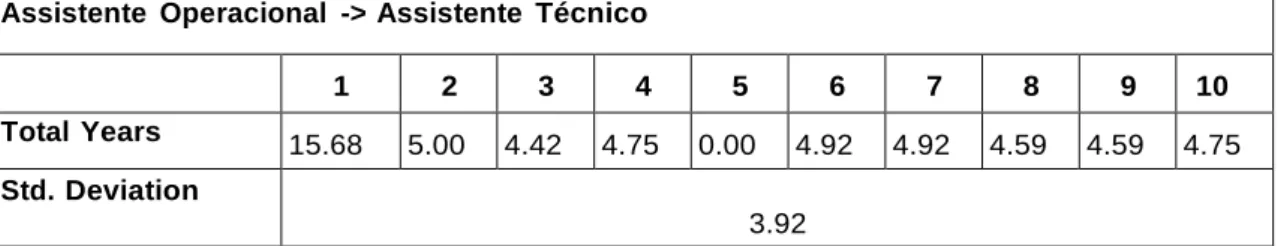
To assess whether the discovered career process represents the reality in an accurate and trustworthy manner, the quality of the event log data must be taken into account. For that reason, we used the standard deviation statistical metric to analyse the data quality of the log. This is a proper metric to quantify the amount of dispersion of a set of data values which is precisely what we want to assess. We considered the career progression Assistente Operacional
-> Assistente Técnico -> Técnico Superior -> Director de Departamento -> Director Coordenador to assess data quality since it represents the career path with most flow of data
according to the discovered process frequency-wise and performance-wise. We sampled this workflow into four samples representing each of the four category transitions that compose that same workflow.
Assistente Operacional -> Assistente Técnico Assistente Técnico -> Técnico Superior
Técnico Superior -> Director de Departamento Director de Departamento -> Director Coordenador
For each sample we considered all cases concerning them. After computing the standard deviation for each sample we calculated the average deviation in order to have a single value form where conclusions concerning the log quality could be made. The approach we used for computing the
standard deviation was to calculate the total transition years of each sample’s instance. The Tables 1, 2, 3 and 4, below represent the total years of each transition sample for each of its instances and its respective standard deviation.
Assistente Operacional -> Assistente Técnico
1 2 3 4 5 6 7 8 9 10
Total Years 15.68 5.00 4.42 4.75 0.00 4.92 4.92 4.59 4.59 4.75 Std. Deviation
3.92
Table 1 – Total Years and Standard Deviation to transition: Assistente Operacional -> Assistente
Técnico
Assistente Técnico -> Técnico Superior
1 2 3 4
Total Years 30.39 4.59 4.34 2.2
Std. Deviation
13.39
Table 2 – Total Years and Standard Deviation to transition: Assistente Técnico -> Técnico Superior
Técnico Superior -> Director de Departamento
1 2 3
Total Years 9.09 19.55 0.0028
Std. Deviation
9.78
Table 3 – Total Years and Standard Deviation to transition: Técnico Superior -> Director de
Departamento
Director de Departamento -> Director Coordenador
1 2
Total Years 5.24 7.34
Std. Deviation
1.49
Table 4 – Total Years and Standard Deviation to transition: Director e Departamento -> Director
Average Std. Deviation: 7.14
The average standard deviation value of 7.14 years (being the highest deviation of 13.39 years and lowest deviation of 1.49) reveals a considerable dispersion of data according to the mean of the data set. Knowing that a standard deviation of approximately 0 would classify the data as being accurate, this value shows that the given data set is somewhat inaccurate and must not be completely reliable. A reason for this (discussed below) has to do with the incorrect insertion of data in the IS responsible for managing the career progression data. Next we state the main conclusions of our analysis.
4.
DISCUSSION
In the previous section we covered an analysis of the Process Mining approach applied in a public organization. The goal was to analyse a set of factors concerning career progression. We analysed the discovered process map from two scopes: absolute frequency and performance. In the frequency scope we could observe the number of employees related to each category and how many progressed from a specific category to another. In the performance view, we used as main criteria of analysis the mean time a person would take from progressing from a category to another. Here we saw two main paths where the duration of progression was considerably higher than the remaining progression paths; those were Assistente Técnico -> Técnico Superior (10,4 years) and Técnico Superior -> Diretor de Departamento (114,6 months ~ 4.5 years). We also tried to find a correlation between both scopes. However, regardless of the mean duration value, the number of times each path was crossed is low (3-4 passages), therefore we could not clearly distinguish any kind of relation between absolute frequency and mean duration.
We gathered a set of main conclusions concerning this field study based on the previous analysis, the discovered process map and considering Quidgest’s HR management system used by the public organization, after applying a variation of replay (a Conformance Checking technique) to the model (i.e. reproducing the event log in the discovered model but also taking into account the system’s business rules) and the system’s business rules. The replay analysis was made with the contribution of Quidgest system’s manager. Apart from delivering the required event log to do process discovery, he also provided us with insight concerning the discovered map transitions between categories and the business rules that compose the system. In this analysis we used the entire discovered process (i.e. both the Activities and Paths detail filters were removed). The main conclusions were as follows:
We observed 7 deviations between the process model and the business rules all of the same type (cyclical transitions to the same category);
A possible reason for 5 of these deviations has to do with an employee returning to the organization. Take the Formador category for example as illustrated in Figure 12. Here we have 50 re-entries of the ‘Formador’ category in the system. One can assume that from all the 198 employees of this category type, 50 were re-employed to do more training events;
One of the 6 cyclical deviations was found to be a false positive. The reason for this particular deviation (Secretária Geral - Secretary) had to do mostly with incorrect register insertion. Despite on a business level not being possible for an employee to have two registers of a same category in the same date, the software does not verify cases when data is introduced incorrectly. This issue makes the discovered process incoherent with the organization business rules. Figure 13 illustrates this scenario; The above-mentioned situation does not occur only when an employee gets two registers
of a same category in the same day. It also occurs when an employee gets two registers for different category types in the same day, which also violates, in a more serious manner, the organization business rules. This deviation happened in the same category type as the false positive deviation (possibly being the same employee). Figure 13 illustrates the last two mentioned deviations.
Figure 12 - Discovered Process Map Overview (Zoomed View)
Figure 13 - Discovered Process Map Overview (Zoomed View)
After this analysis we can identify some limitations about applying Process Mining to this type of cases - Career Progression. The first limitation is concerned with the amount of data available. The limitation occurs if the number of events, activities or instances is small. For example, in this case, we had 585 instances (employees) and only 714 events, what does mean that almost all employees only have one event associated to their career. Actually, there are 482 instances with just 1 event and only 1 instance with 6 events. This can be a limitation because there are few instances with a full career registered and, because of it, the results may be less adapted to the reality.
Another limitation is related with changes in the number of employees. If an organization increases the number of employees in the last years, even if there are many employees already working, it will be
difficult to capture the usual career progression, because there are insufficient data to the algorithm find the usual progression. As is a public organization, the progression is slow and there is insufficient data, i.e, the majority of employees only changed one time of category. To discover a real career progression through this type of analysis, a large number of years of data is necessary.
The last limitation is data quality and is transversal to all field studies in Process Mining. But, in Career Progression systems, this becomes even worse because in the majority of cases the categories and change dates (timestamps) are manually placed in the information system. This situation creates many problems, for example: three or more categories that represents only one major category and an employee that belongs to more than one category at the same time, violating the business rules.
5.
CONCLUSION
In this paper we applied Process Mining techniques to career progression data of a Portuguese public organization. By performing deep analysis of career progression, we found evidence that Process Mining is suitable to analyse career development and provide insights about employees that would be difficult to achieve only with the raw data about the passages of each employee between different categories. Conclusions like the mean duration of each passage of category or how the development of career along time is, are two of many conclusions that Process Mining analysis provides. However, limitations related to the accuracy and the amounts of data needed were also identified and these are important to alert analysts that, before start analyzing results, the normalization of data is needed. As future work it will be important to apply Process Mining analysis to different organizational contexts like private organizations, where the career progression is usually faster and there are more subcategories. Furthermore, it will be interesting to compare the analysis results of two different organizations with the same context, to see if a pattern can be assumed or if the results are different between organizations of the same industry. Finally, another comparison that can be done is to see if exists any relation between career progression and performance evaluation. It would be interesting to analyse if performance evaluation has any influence in the career progression of employees.
6.
ACKNOWLEDGEMENTS
We would like to thank to Filipe Santos from Quidgest who helped us to collect and analyse the data. The authors also wish to express their appreciation to Rodrigo Serafim, whose comments and suggestions positively contributed to this paper.
REFERENCES
Burt, R. e Minor M., Applied Network Analysis: A Methodological Introduction, Newbury Park CA: Sage http://www.cbpweb.nl/index.htm, 1983.
De Bruin, J. S. Cocx T. K. Kosters W. A. Laros J. F. J. e Kok J. N., "Data Mining Approaches to Criminal Career Analysis," ICDM '06. Sixth International Conference on Data Mining, 2006, 171-177. Edgington, T. M. Raghu T. S. e Vinze A. S., Using Process Mining to identify coordination patterns in IT
service management, Decision Support Systems, Volume 49, Issue 2, 2010, 175-186.
Fischer, L. (Eds.), Workflow Handbook 2001, Workflow Management Coalition, Lighthouse Point, FL: Future Strategies, 2001.
Gunther, C. W. e Rozinat A., BPM 2012 Demonstration Track of the 10th International Conference on Business Process Management (BPM 2012) Tallinn, Estonia, 2012, 40-44.
Jablonski, S. e Bussler C., Workflow Management: Modeling Concepts, Architecture, and Implementation, London, UK: International Thomson Computer Press, 1996.
Leymann, F. e Roller D., Production Workflow: Concepts and Techniques, vol. 26. 2000.
Nakatumba, J. e Van Der Aalst W., Analyzing Resource Behavior Using Process Mining, Lecture Notes in Business Information Processing, Springer, 2010.
Rozinat, A. e Van Der Aalst W., “Conformance checking of processes based on monitoring real behavior,” Inf. Syst., vol. 33, no. 1, 2008, 64-95.
Scott, J., Social Network Analysis, vol. 22, no. 1, 1994.
Van Der Aalst, W. e Van Hee K. M., Workflow Management: Models, Methods, and Systems, Cambridge, MA: MIT press, 2002.
Van Der Aalst, W. Reijers H. A. e Song M., “Discovering social networks from event logs,” Comput. Support. Coop. Work, vol. 14, no. 6, 2005, 549-593.
Van Der Aalst, W. Van Hee K. M. Van Werf J. M. e Verdonk M., "Auditing 2.0: Using Process Mining to Support Tomorrow's Auditor," IEEE Computer , vol.43, no.3, 2010, 90-93.
Van Der Aalst, W. Weijters T. e Maruster L., “Workflow mining: Discovering process models from event logs”, in IEEE Trans. Knowl. Data Eng., vol. 16, no. 9, 2004, 1128-1142.
![Figure 1 - Conformance checking in the boarder context of Process Mining (from [Rozinat 2008]) An organization typically documents its processes in some form](https://thumb-eu.123doks.com/thumbv2/123dok_br/17029640.766537/4.892.287.609.583.802/conformance-checking-process-rozinat-organization-typically-documents-processes.webp)
![Figure 2 - Fitting models do not need to be a good representation of the observed behaviour (from [Rozinat 2008])](https://thumb-eu.123doks.com/thumbv2/123dok_br/17029640.766537/5.892.228.669.239.384/figure-fitting-models-need-representation-observed-behaviour-rozinat.webp)
![Figure 4 - A discovered Social Network (from [Van Der Aalst 2005])](https://thumb-eu.123doks.com/thumbv2/123dok_br/17029640.766537/6.892.258.629.689.1007/figure-discovered-social-network-from-van-der-aalst.webp)