WORKING PAPER SERIES
Universidade dos Açores Universidade da Madeira
CEEAplA WP No. 07/2008
Basel II: Operational Risk Measurement in the
Portuguese Banking Sector and an Evaluation of
the Quantitive Impacts
Gualter Couto Kevin Bulhões
Basel II: Operational Risk Measurement in the
Portuguese Banking Sector and an Evaluation of
the Quantitive Impacts
Gualter Couto
Universidade dos Açores (DEG)
e CEEAplA
Kevin Bulhões
Universidade dos Açores (DEG)
Working Paper n.º 07/2008
Junho de 2008
RESUMO/ABSTRACT
Basel II: Operational Risk Measurement in the Portuguese Banking Sector and an Evaluation of the Quantitive Impacts
The present work is aimed at understanding the general notion and origin of the New Basel Accord, which intends to attain international bank stability, emphasizing the convergence between regulatory capital and economic capital, applying its risk sensitive methodologies. This work focuses on one of the principal novelties of Basel II – operational risk and its respective methodologies for calculating minimum capital requirements. The New Capital Accord encourages financial institutions to gradually evolve from basic to sophisticated methodologies. Institutions using more sophisticated methods will be rewarded by deductions on the capital allocated for the calculation of the capital ratio. The methodologies associated to operational risk will be applied to a group of national banking institutions. These methodologies are referred to in Pillar I of the New Capital Accord: (i) basic indicator approach, (ii) the standardized approach and (iii) the alternative standardized approach. The purpose of this practical application is to evaluate and quantify the impact due to the introduction of Basel II.
JEL Classification: G14, G21, G28, G32.
Keywords: Basel II, Operational Risk, Regulatory Capital and Economic Capital.
Gualter Couto
Departamento de Economia e Gestão Universidade dos Açores
Rua da Mãe de Deus, 58 9501-801 Ponta Delgada
Kevin Bulhões
Departamento de Economia e Gestão Universidade dos Açores
Rua da Mãe de Deus, 58 9501-801 Ponta Delgada
BASEL II: OPERATIONAL RISK MEASUREMENT IN THE PORTUGUESE BANKING SECTOR AND AN EVALUATION OF THE QUANTITIVE
IMPACTS
Gualter Couto
Department of Economics and Management, and CEEAplA, University of the Azores, Portugal
Kevin Medeiros Bulhões
Department of Economics and Management, University of the Azores, Portugal [email protected]
Abstract
The present work is aimed at understanding the general notion and origin of the New Basel Accord, which intends to attain international bank stability, emphasizing the convergence between regulatory capital and economic capital, applying its risk sensitive methodologies. This work focuses on one of the principal novelties of Basel II – operational risk and its respective methodologies for calculating minimum capital requirements. The New Capital Accord encourages financial institutions to gradually evolve from basic to sophisticated methodologies. Institutions using more sophisticated methods will be rewarded by deductions on the capital allocated for the calculation of the capital ratio. The methodologies associated to operational risk will be applied to a group of national banking institutions. These methodologies are referred to in Pillar I of the New Capital Accord: (i) basic indicator approach, (ii) the standardized approach and (iii) the alternative standardized approach. The purpose of this practical application is to evaluate and quantify the impact due to the introduction of Basel II.
JEL Classification: G14, G21, G28, G32.
Introduction
The present work aims at transmitting a general idea of the New Basel Capital Accord, also known as Basel II, focusing specifically on its main novelty - operational risk.
The main objectives of Basel II are to maintain international stability in the banking system and to create a unique methodology for calculating minimum capital requirements for internationally active banks. With the complex and consecutive transformations in the banking sector, this methodology was adapted to the banking reality, fortifying the minimum capital requirements in financial institutions. With these ongoing transformations in the banking activity, different types of losses began to occur, diverging from the losses due to the traditional risks, consequently appearing operational risk.
This work investigates the benefits of the application of different methodologies introduced by Basel II, for operational risk, in the Portuguese banking sector. We intend to evaluate the impact of a more sophisticated methodology versus a basic one, registering both the advantages and disadvantages.
Basel II, fortifies the minimum capital requirements in financial institutions. These minimum requirements can be calculated through several methodologies and are more sensible to the existing risk in each institution, stimulating more efficient risk management. Basel II, besides the objectives already mentioned, has also introduced the following concepts:
1. Improve risk measurement and management, keeping adequate levels of liquidity, solvency and solidity;
3. Increase the dialogue between the National Supervisor and the financial institutions, referring risk measurements and management; and
4. Increase market discipline, bank transparency and information.
The New Basel Accord aims at converging economic capital and regulatory capital. The use of more sophisticated methods for calculating an institutions risk will be rewarded with less levels of capital (IFB, 2006).
According to Jaime Caruana (2005), the previous President of the Basel Committee, the more risk sensible the methodology is for calculating minimum capital requirements, regulatory capital will be better adjusted to the institutions risks and will be closer to economic capital.
Basel II was implemented on January 1, 2007 in the G10 countries. It is built on three pillars as can be observed in Figure 1 [Insert Figure 1].
Pillar III of the New Basel Accord has the objective to assure better transparency on the financial situation and solvency of the institutions, allowing the market to create a more precise analysis of banks´ profile and risk, applying incentives to fortify financial institutions risk management and levels of capital (IFB, 2006).
In Pillar II, the national supervisor, the Bank of Portugal, has the objective to assure that all national banks have sufficient minimum capital to face all incurred business risks. The national supervisor must also stimulate the development of techniques that improve risk management in banks.
Finally, Pillar I, assures that banking institutions withhold minimum capital requirements, sufficient to cover all existing risks.
According to Chorafas (2005), despite the concept of operational risk only having appeared now, these occurrences, associate to this type of risk, exist for a long time.
Fontnouvelle et al. (2003), refers to the importance of operational risk in regulatory capital, referring that the minimum capital requirements for operational risk, in some cases, can exceed the capital requirements for market risk.
There are two versions of the definition of operational risk. The first version, belonging to the BCBS, as expressed in its documents, defines operational risk as the risk of loss resulting from inadequate or failed internal control, human resources and systems or from external events, including legal risk (BCBS, 2006). The second version, expressed by the Bank of Portugal in Aviso n.º 3/2006, will have that to converge to the definition in the Basel II framework. This Aviso defines operational risk as being the risk of losses as a result of the inadequate or negligent application of internal procedures, human resources and systems or from external causes.
Similarly as what happens to credit risk, financial institutions will also be able to choose between three methods for calculating minimum capital requirements for operational risk, each more sophisticated and risk sensitive (IFB, 2006).
As pointed out by Mori and Harada (2001); Sundmacher (2004); Currie (2004a, 2004b and 2005); and Jobst (2007), with even bigger relevance the BCBS (2006), the calculation of the minimum capital requirements is effectuated by three distinct methods.
The Basic Indicator Approach (BIA), as the name indicates, is the simplest. Capital charge is a fixed percentage of the annual gross income, as indicated by the BCBS. In the standardized approach (TSA), institutions must map their activities in eight distinct Business Lines (BL). In this situation, the annual gross income for each BL is multiplied by a specific β, associated to each activity. Finally, the advanced measurement approach (AMA), institutions will be able to use internal models with capacity to measure operational risk and the minimum capital to be allocated.
With the intention to seek existing information on operational risk, the Risk Management Group (RMG), a specific branch of the BCBS, proceeded to obtaining data from 89 financial institutions from 19 countries in Europe, North and South America, Asia and Australia. The treatment of this data had the objective to gather information concerning operational losses during 2001, the allocation of capital for operational risk, and the expected operational losses associated to each banks BL (RMG, 2003).
With this investigation the RMG concluded that the banking sector is evolving quickly in what relates to the retraction of data for operational risk purposes. On the other hand, financial institutions are still developing methods for properly retrieving this data (RMG, 2003).
Moscadelli (2004) used the data collected by the RMG in 2002, and treated this data statistically. With this work, Moscadelli (2004) obtained a relationship between the average gross income and capital charge for each BL. This contribution by Moscadelli (2004) makes it possible to calculate the average gross income per BL, these values are still difficult obtain in a financial institution´s annual report.
Both authors, Fontnouvelle et al. (2003) and Moscadelli (2004), concluded that there exists two obstacles when analyzing operational losses. In first place, the quality of the retracted data can be dubious and in second place, there are operational losses that are not registered by the financial institutions.
Sundmacher (2004) begins his work from the idea that there are advantages to applying a more advanced methodology, meaning that less capital will be allocated for operational risk, as referred by the BCBS. The author questions the situation where a bank generates activities primordially with superior β´s. In this case, the institution will have to allocate more capital when using TSA than the BIA, without having any
incentives in developing advanced models for operational risk. Sundmacher (2004) concluded that there should exist a system of rewards, this is, an incentive for financial institutions to progress and develop advanced methodologies.
As referred before, the use of a more sophisticated method in calculating minimum capital requirements, is rewarded by a lower level of capital to be allocated. Sundmacher (2007) effectuated simulations, estimating the amount of capital to be allocated for the National Australia Bank. Using the banks annual gross income from its annual reports from 2001 to 2004, the author calculated the capital charge for operational risk for both the BIA and TSA. For TSA, Sundmacher (2007) distributed the annual gross income equally into the eight BL, elaborating different scenarios.
This author concluded that the financial incentive to evolve from the BIA to the TSA was minimum. Of the three elaborated scenes, only in one situation existed benefits in evolving from the BIA to TSA, differing from the concept that the application of a more sophisticated method consumes less capital.
The remainder of the paper is organized as follows. Section 2 presents the methodologies for calculating the minimum capital requirements for operational risk. The third section referrers to the empirical application of the methodologies developed by the BCBS and the concluding remarks are provided in the last section.
Methodology
Basic Indicator Approach
According to BCBS (2006), the capital requirements for operational risk must be equal to the average over three years of a fixed percentage of the annual Gross Income (GI) denoted as α. GI is defined as net interest income plus net non-interest income.
After concluding the Quantitative Impact Studies (QIS), the Basel Committee fixed α as 15%. The BIA is expressed by the following equation:
α
× = GI
KBIA (1) where:
KBIA = the capital charge under the Basic Indicator Approach;
GI = annual gross income, where positive, over the previous three years; and α = 15%.
The BIA does not consist of any specific criteria to eligible for applying, however, banks are encouraged to comply with the committee´s guidance on Sound Practices for the Management and Supervision of Operational Risk (February of 2003) (BSBC, 2006).
The Standardized Approach and Alternative Standardized Approach
The Standardized Approach
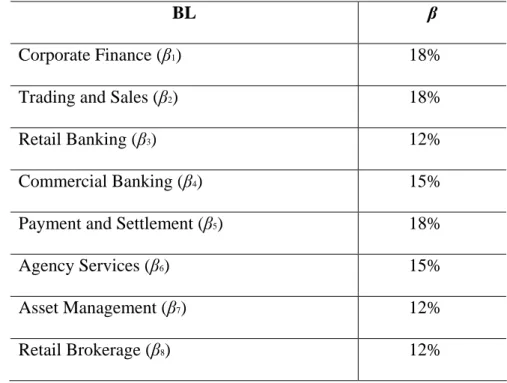
As stipulated by the BCBS (2006), this method foresees that banks´ activities are mapped into eight specific BL. Each BL is assigned a factor denoted as β, as can be observed in Table 1 [Insert Table 1].
The factor β for each BL was previously defined by the Basel Committee, and reflects historical operational losses. The capital charge for TSA is the sum of the GI of each BL multiplied by its respective β. TSA can be expressed by the following equation:
(
)
∑
× = i i TSA GI K β (2) where:GIi = annual gross income in a given year, as defined above in the BIA, for each of the
eight BL, where i= 1, 2, 3… 8; and
β i = a fixed percentage, set by the Committee for each of the eight business lines,
where i= 1, 2, 3… 8.
The Alternative Standardized Approach
The Alternative Standardized Approach (ASA) is similar to TSA, except for the treatment given to two BL: retail and commercial banking. For these BL the variable GI is substituted by the variable Loans and Advances (LA), which can be retracted from the banks´ annual reports. The values of LA associated to retail banking and commercial banking are multiplied by a fixed factor m (3.5%) and then multiplied by there respective β´s, 12% and 15%. It is permitted to join the two BL applying a β of 15%. The capital charge can be expressed by the following equation:
(
) (
)
∑
× + × × = i i RB CB RB CB ASA GI LA m K β / β / (3) where:KASA = the capital charge under the Alternative Standardized Approach;
GIi = annual gross income in a given year, as defined above in the BIA, for each of the
eight BL, where i= 1, 2, 3… 8;
β i = a fixed percentage, set by the Committee for each of the eight business lines,
where i= 1, 2, 3… 8;
βi/RB/CB = a fixed percentage, set by the Committee for each BL, retail banking and
commercial banking, where i= 1, 2, 3…8;
LARB/CB = loans and advances (average of the last three years) for retail and
m = 3,5%.
For both TSA and ASA it is of great importance to classify an institutions activities in there respective BL as shown in Table 2 [Insert 2 Table].
Advanced Measurement Approach
This last method foresees that financial institutions elaborate an internal operational risk measurement system using quantitative a qualitative criteria. Institutions will calculate capital charge as the sum of expected losses (EL) and unexpected losses.
The following equation expresses how to calculate capital charge under de AMA:
(
)
∑
+= EL UL
KAMA (4) where:
KAMA = the capital charge under the Advanced Measurement Approach;
EL = Expected Losses; and UL = Unexpected Losses.
Empirical Results
Although the Portuguese economy has grown at moderate levels, the banking sector continues to register a quick expansion. The continuous expansion in the Portuguese banking sector is due to, essentially, to the growth in loans and advances. This growth in the banking sector was accompanied by higher solvency levels and greater levels of bank return (Relatório de Estabilidade Financeira, 2006).
The methodologies used for calculating capital charge for operational risk was applied to seven, well known financial institutions in Portugal:
2. Banco Internacional do Funchal (BANIF); 3. Banco Português de Investimentos (BPI); 4. Caixa Geral de Depósitos (CGD);
5. Millenium BCP (BCP); 6. Montepio Geral (MG); and
7. Sistema Integrado Crédito Agrícola Mútuo (SICAM).
Due to the impossibility of retraction of internal data on operational losses, as referred by authors such as Rowe (2004), Currie (2005) and Sundmacher (2007), the AMA will not be applied to these banks in the Portuguese sector.
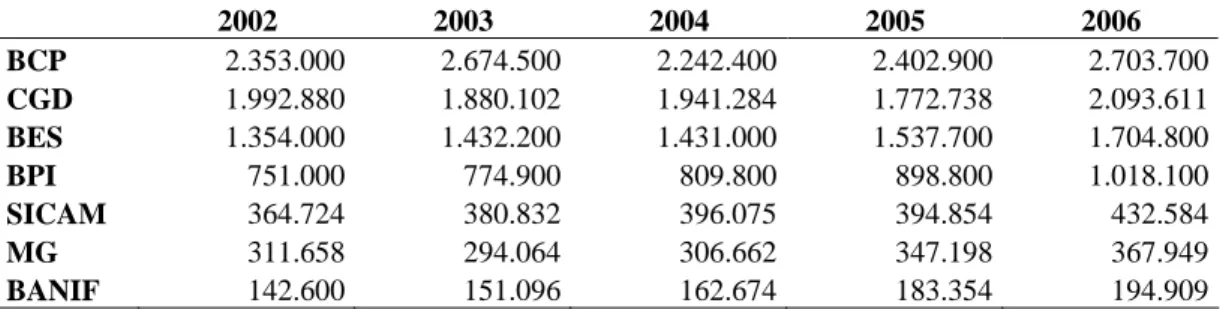
The value of the GI was extracted from the banks´ annual reports between 2002 and 2006, as can be observed in Table 3 [Insert Table 3].
BCP leads with the highest GI, attaining 2.703.700 thousands of euros in 2006, distinguishing itself from the remaining institutions. CGD and BES rank second and third positions. Ranking last is BANIF with a GI of 194.909 thousands of euros, in 2006.
As referred in the previous chapter, GI is the average of the last three years when positive. For example, the GI for 2007 is the average GI during 2004, 2005 and 2006, as can be observed in Table 4 [Insert Table 4]. At this point it is possible to calculate capital charge for the BIA and TSA.
For the ASA we must first extract the values for LA from the annual reports and calculate the average of the last three years for both retail and commercial banking.
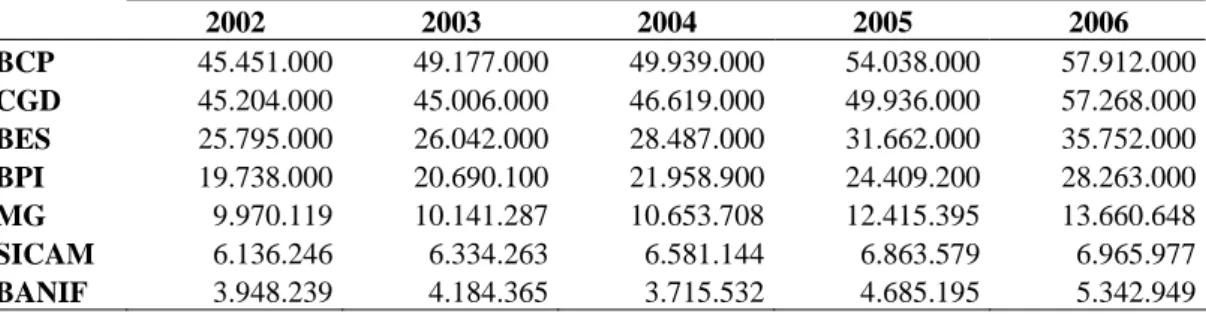
As observed in Table 5 [Insert Table 5], BCP leads with 57.912.000 thousands of euros in LA, while CGD and BES rank, once again, second and third. Ranking last, as observed with GI is BANIF. The ranking in this table is similar to the ranking of GI with the exception of MG and SICAM which invert position. The data in Table 6 [Insert
Table 6] shows the average of the last three years of LA. At this point it is also possible to calculate capital charge of these Portuguese institutions using the ASA.
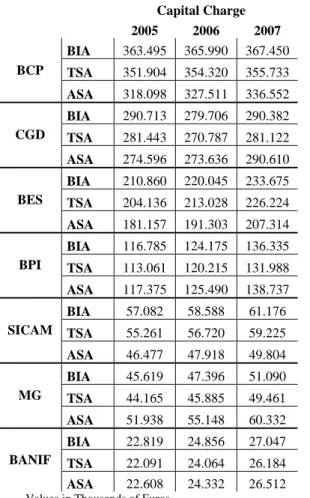
Basic Indicator Approach
In accordance with the BCBS (2006) and the Aviso n.º 9/2007 of the Bank of Portugal, the capital charge using equation 1 from the previous chapter was applied, resulting the data in Table 7 [Insert Table 7].
This Table shows the capital charge for the seven Portuguese banks using the BIA. With this analysis we can easily observe a linear relation between GI and capital charge, due to the fact that capital charge is a fixed percentage of GI. We can verify that BCP will allocate the most capital for operational risk with 367,450 thousands of euros in 2007. Ranking in last place is BANIF, allocating 27,047 thousands of euros in 2007.
The Standardized Approach
To apply this methodology financial institutions must map there activities accordingly into eight BL as pointed out in the previous chapter. GI will also have to be divided into each BL, every fraction being multiplied by a fixed percentage β as defined for every BL. Capital charge is equal to the sum of multiplication between the eight fractioned GI and there respective β´s.
Basel II introduced some difficulties into the banking sector, that is, banks were not prepared for more advanced methodologies. In this section we face the obstacle of the majority of institutions not having the necessary information in there annual reports for analysis. The decomposition of GI per BL, that is, the classification of activities per BL as introduced by Basel II is still not complete in many institutions.
In the study elaborated by Moscadelli (2004), the author concluded on the decomposition of GI per BL as seen in Table 8 [Insert Table 8], he concluded these results having based himself on data retrieved from the RMG. This contribution by Moscadelli (2004), makes it possible to calculate, in average terms, the fraction of an institutions GI belonging to each BL and simultaneously calculating capital charge for operational risk for TSA and ASA.
As a result of the application of equation 2, we deduced Table 9 [Insert Table 9], with the capital charge to be allocated according to TSA.
In this case, the ranking of capital charge per institution is identical to the one of the BIA, that is, BCP continues to rank first place and BANIF ranks last. This is due to the fact that the decomposition of GI per BL is identical for all the financial institutions, as Moscadelli (2004) pointed out, in reality this is not so linear, bank activities can differ significantly from institution to institution.
Alternative Standard Approach
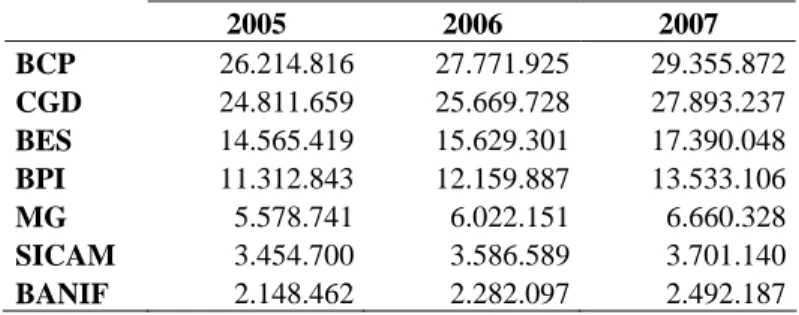
In this methodology, such as in the previous one, financial institutions must classify there activities accordingly into the eight BL. This methodology differs from previous one in what respects retail and commercial banking. For these two BL, GI will be substituted by the value of LA associated to these two BL. Similar to what happened in TSA, in this approach we notice that LA are not divided into BL in banks´ annual reports, being therefore used for this effect the results obtained by Moscadelli (2004) for GI, as decomposed in Table 8. As can be observed in the Table, the combined weight of GI for retail and commercial banking is 54,4%. This reference was used to distinguish the fraction of LA for both retail and commercial banking. This decomposition of LA may not be a rigorous representation of reality but significant divergences are not
expected. Table 10 [Insert Table 10] represents the values referring to 54.4% of the initial value obtained for LA for every institution.
Appling equation 3 results in Table 11 [Insert Table 11], which represents capital charge for the ASA.
As can be observed in Table 11, capital charge for the ASA results in a ranking similar to TSA, with the exception of MG and SICAM, which invert positions. This is due to the fact that MG has a greater amount of LA than SICAM.
This occurred because an independent variable (LA) was introduced to the equation. The more independent variables are introduced to the equations used to calculate minimum capital requirements, capital charge begins to converge with the banking reality. Basic methodologies, based in fixed values, result in capital charges which may not be a clear image of the operational risk existing in a bank.
Results Analysis
As can be observed, the results of the application of the three methodologies, BIA, TSA and ASA are presented in Table 12 [Insert Table 12], we verify that the impact in progressing from BIA to TSA is identical in all the institutions. This occurrence is due to the fact of the decomposition of GI, being identical for every institution. We can observe a decrease of approximately 3.20% in capital charge in using TSA. The ASA showed that the introduction of LA to the equation had significant results in the various institutions. Specifically, BCP, BES and SICAM, decreased there capital charge, varying from 5% to 16%. The inverse situation also occurs, the cases of BPI, MG and BANIF showed an increase in capital charge which varies from 1% to 22%. The case of CGD is peculiar, capital charge starts by decreasing in 2005 and then increases in 2006
and 2007. Another analysis also evidenced here, is the option of an institution progressing directly from BIA to the ASA. This analysis shows that this option is favorable to all the financial institutions, with the exception of BPI and MG. BPI would have an increase in capital charge of about 1%, which is insignificant. The case of MG is more severe, the increase in capital charge would reach 18% in 2007. Maintaining TSA in this case is more advantageous for MG. The increases in capital charge of BPI and MG are due to the introduction of the variable LA. The remaining institutions showed significant reductions in capital, in some cases, as for example SICAM, the decrease reached 18.5%.
Concluding Remarks
Basel I satisfied its initial objectives during many years, guaranteeing financial stability of the international banking system. However, the fast transformation in the banking sector requested that Basel I revised its framework. The New Capital Accord, Basel II, came to fortify minimum capital requirements in financial institutions, improving the levels of solvency and solidity of each institution.
In the present work, beyond the application of the methodologies for operational risk, we verified the axiom that is constantly referred to in the Basel Framework and studies elaborated by other authors. This axiom is based on the fact that the application of an advanced or sophisticated methodology will benefit a bank, decreasing capital charge for operational risk.
According to the elaborated analysis in the previous chapter and considering the results pointed out by Moscadelli (2004), we verify that, when abdicating of the BIA and adopting TSA, the financial institutions will benefit of a capital charge reduction of,
approximately, 3.2%. This conclusion was similar to the one Sundmacher (2007) obtained, opting for TSA over the BIA, capital charge will decrease although insignificantly.
On the other hand, we must be conscious that these results will depend on the activities dominated by each institution. As Sundmacher (2004) referred in his study, an institution that dominates BL with greater β´s , for example, 18%, will allocate more capital in an advanced methodology, being more advantageous applying the BIA, which has an α of 15%. The opposite may also occur, when institutions dominate BL with smaller β´s, for example, 12%. In this last situation, the institution will allocate less capital using TSA.
In the last methodology, ASA, we verified diversified results, the introduction of the variable LA influenced capital charge to increase or decrease in comparison to TSA. We also verified that in the majority of the banks, progressing from BIA to ASA is, in general, advantageous, that is, less volume of capital to allocate.
The contribute of this work consisted on evaluating the benefits of the use of a more sophisticated methodology set out by the Basel Committee for each one of the seven Portuguese banking institutions. As referred previously, progressing from BIA to TSA is beneficial for all institutions, the second choice, progressing directly from BIA to ASA is equally favorable. The use of the more advanced methodologies TSA and ASA are limited to the mapping of banks´ activities, which as we can observe in there annual reports are still in need of some structuring.
In what says respect to the application of the ASA, institutions will have to evaluate its situations better. In the case of four institutions, CGD, BPI, MG and Banif, it is preferable to remain in TSA, especially in the case of MG where capital charge increases, approximately 22%. On the other hand, BCP, BES and SICAM benefited
with the application of the ASA, SICAM benefited with a decrease of approximately 16%. In the case of progressing directly from BIA to ASA, institutions can save up to 18,5% of capital, which is the case of SICAM, however, they can lose up to 18%, such as MG.
As Currie (2004b) referred in her work, significant increases in capital charge can have negative consequences in institutions, that is, they may desire to increase the general level of prices which can result in a credit crunch.
Although there have been significant progresses in recent years, Holmes (2003) refers that there are still obstacles when analyzing operational risk. First, operational risk is very hard to be correctly quantified. Second, while credit risk can easily be identified, it is difficult to evaluate if all operational risk situations have been included. In third place, certain risks can lose there relevance in an institution throughout time. Finally, the difficulty in validating a good method of calculating capital charge decreases its own reliability.
Currie (2005) refers that the greatest obstacle in operational risk is that, non-measurable factors cannot be controlled and that quality cannot be measured, therefore, cannot be controlled.
Throughout the years, Basel II will undergo various changes, improving every detail. Information for analysis will become easier to retrieve from annual reports due to the rigidness of both the Supervisory Review Process and Market Discipline. In this perspective, it is important to analyze the advanced methodologies (AMA) and conclude on there impacts on financial institutions.
Banco Comercial Português, Relatório e Contas de 2002 a 2006. Banco de Portugal, (2006a). Aviso n.º 3/2006
Banco de Portugal, (2006b). Relatório de Estabilidade Financeira – 2006 Banco de Portugal, (2007a). Aviso n.º 9/2007
Banco Espírito Santo, Relatório e Contas de 2002 a 2006.
Banco Internacional do Funchal, Relatório e Contas de 2002 a 2006. Banco Português de Investimentos, Relatório e Contas de 2002 a 2006.
Basel Committee on Banking Supervision, (2003a). Sound Practices for the Management and Supervision of Operational Risk. Working Paper, Basel, BIS. Basel Committee on Banking Supervision, (2003b). The 2002 Loss Data Collection
Exercise for Operational Risk: Summary of the Data Collected. Working Paper, Basel, BIS.
Basel Committee on Banking Supervision, (2006). Internal Convergence of Capital Measurement and Capital Standards – A Revised Framework – Comprehensive Version. Working Paper, Basel, BIS.
Caixa Geral de Depósitos, Relatório e Contas de 2002 a 2006.
Chorafas, D. N., (2005). Operational Risk Control with Basel II. Oxford: Elsevier. Crédito Agrícola, Relatório e Contas de 2002 a 2006.
Currie, C., (2004a). Basel II and Operational Risk – Overview of Key Concerns. Working Paper no. 134. School of Finance and Economics. University of Technology of Sydney.
Currie, C., (2004b). Potential Effect of the New Basel Operational Risk Capital Requirements. Working Paper no. 137. School of Finance and Economics. University of Technology of Sydney.
Currie, C., (2005). A Test of the Stategic Effect of Basel II Operational Risk Requirements on Banks. Working Paper no. 143. School of Finance and Economics. University of Technology of Sydney.
Fontnouvelle, P., Rueff, V. J., Jordan, J., e Rosengren, E. (2003). Using Loss Data to Quantify Operational Risk. Working Paper, Federal Reserve Bank of Boston. Holmes, M. (2003). Measuring Operational Risk: a Reality Check. Risk Management.
Instituto Formação Bancária (IFB), 2006. Acordo de Basileia II – Noções Fundamentais.
Jobst, A. A. (2007). Constraints of Consistent Operational Risk Measurement and Regulation: Data Collection and Loss Reporting. Journal of Financial Regulation and Compliance.
Montepio Geral, Relatório e Contas de 2002 a 2006.
Mori, T., e Harada, E. (2001). Internal Measurement Approach to Operational Risk Capital Charge. Working Paper, Bank of Japan.
Moscadelli, M. (2004). The Modelling of operational risk: experience with the analysis of the data collected by the Basel Committee. Temi di discussion del Servizio Studi. Working Paper, Banca D´Italia, Number 517.
Rowe, D. (2004). Operational Risk and Black Swans. Risk. September 2004. Volume 17 n.º 9.
Sundmacher, M. (2004). Operational Risk Measurement in Banks: Arbitrage, Adjustments and Alternatives. Working Paper, University of Western Sydney.
Sundmacher, M. (2007). The Basic Indicator Approach and the Standardised Approach to Operational Risk: An Example and Case Study Based Analysis. Working Paper, University of Western Sydney.
Appendices
Figure 1. Basel II Pillars
Table 1. Business Lines and β Factors
BL β
Corporate Finance (β1) 18%
Trading and Sales (β2) 18%
Retail Banking (β3) 12%
Commercial Banking (β4) 15%
Payment and Settlement (β5) 18%
Agency Services (β6) 15% Asset Management (β7) 12% Retail Brokerage (β8) 12% Source: BCBS (2006) Basel II Framework PILLAR I: Minimum Capital Requirements PILLAR II: Supervisory Review Process PILLAR III: Market Discipline
Table 2. Mapping of Business Lines
BL Activity Groups
Corporate Finance 1. Mergers and acquisitions, underwriting, privatisations, securitisation, research, debt (government, high yield), equity, syndications, IPO, secondary private placements
Trading and Sales 1. Fixed income, equity, foreign exchanges, commodities, credit, funding, own position securities, lending and repos, brokerage, debt, prime brokerage
Retail Banking 1. Retail lending and deposits, banking services, trust and estates 2. Private lending and deposits, banking services, trust and estates, investment advice
3. Merchant/commercial/corporate cards, private labels and retail Commercial Banking 1. Project finance, real estate, export finance, trade finance,
factoring, leasing, lending, guarantees, bills of exchange Payment and Settlement 1. Payments and collections, funds transfer, clearing and
settlement
Agency Services 1. Escrow, depository receipts, securities lending (customers) corporate actions
2. Issuer and paying agents
Asset Management 1. Pooled, segregated, retail, institutional, closed, open, private equity
2. Pooled, segregated, retail, institutional, closed, open Retail Brokerage 1. Execution and full service
Source: BCBS (2006)
Table 3. Annual Gross Income
2002 2003 2004 2005 2006 BCP 2.353.000 2.674.500 2.242.400 2.402.900 2.703.700 CGD 1.992.880 1.880.102 1.941.284 1.772.738 2.093.611 BES 1.354.000 1.432.200 1.431.000 1.537.700 1.704.800 BPI 751.000 774.900 809.800 898.800 1.018.100 SICAM 364.724 380.832 396.075 394.854 432.584 MG 311.658 294.064 306.662 347.198 367.949 BANIF 142.600 151.096 162.674 183.354 194.909
Values in Thousands of Euros.
Table 4. Three Year Average of Gross Income
2005 2006 2007 BCP 2.423.300 2.439.933 2.449.667 CGD 1.938.089 1.864.708 1.935.878 BES 1.405.733 1.466.967 1.557.833 BPI 778.567 827.833 908.900 SICAM 380.544 390.587 407.838 MG 304.128 315.975 340.603 BANIF 152.123 165.708 180.312 Values in Thousands of Euros.
Table 5. Loans and Advances 2002 2003 2004 2005 2006 BCP 45.451.000 49.177.000 49.939.000 54.038.000 57.912.000 CGD 45.204.000 45.006.000 46.619.000 49.936.000 57.268.000 BES 25.795.000 26.042.000 28.487.000 31.662.000 35.752.000 BPI 19.738.000 20.690.100 21.958.900 24.409.200 28.263.000 MG 9.970.119 10.141.287 10.653.708 12.415.395 13.660.648 SICAM 6.136.246 6.334.263 6.581.144 6.863.579 6.965.977 BANIF 3.948.239 4.184.365 3.715.532 4.685.195 5.342.949
Values in Thousands of Euros.
Table 6. Three Year Average of Loans and Advances
2005 2006 2007 BCP 48.189.000 51.051.333 53.963.000 CGD 45.609.667 47.187.000 51.274.333 BES 26.774.667 28.730.333 31.967.000 BPI 20.795.667 22.352.733 24.877.033 MG 10.255.038 11.070.130 12.243.250 SICAM 6.350.551 6.592.995 6.803.567 BANIF 3.949.379 4.195.031 4.581.225
Values in Thousands of Euros.
Table 7. Capital Charge for BIA
2005 2006 2007 BCP 363.495 365.990 367.450 CGD 290.713 279.706 290.382 BES 210.860 220.045 233.675 BPI 116.785 124.175 136.335 SICAM 57.082 58.588 61.176 MG 45.619 47.396 51.090 BANIF 22.819 24.856 27.047 Values in Thousands of Euros.
Table 8. Fraction of Gross Income per BL
BL % PB
Corporate Finance 10,6% Trading and Sales 17,3%
Retail Banking 36,0%
Commercial Banking 18,4% Payment and Settlement 3,0%
Agency Services 3,8%
Asset Management 4,6%
Table 9. Capital Charge for TSA 2005 2006 2007 BCP 351.904 354.320 355.733 CGD 281.443 270.787 281.122 BES 204.136 213.028 226.224 BPI 113.061 120.215 131.988 SICAM 55.261 56.720 59.225 MG 44.165 45.885 49.461 BANIF 22.091 24.064 26.184
Values in Thousands of Euros.
Table 10. LA for Retail and Commercial Banking
2005 2006 2007 BCP 26.214.816 27.771.925 29.355.872 CGD 24.811.659 25.669.728 27.893.237 BES 14.565.419 15.629.301 17.390.048 BPI 11.312.843 12.159.887 13.533.106 MG 5.578.741 6.022.151 6.660.328 SICAM 3.454.700 3.586.589 3.701.140 BANIF 2.148.462 2.282.097 2.492.187 Values in Thousands of Euros.
Table 11. Capital Charge for ASA
2005 2006 2007 BCP 318.098 327.511 336.552 CGD 274.596 273.636 290.610 BES 181.157 191.303 207.314 BPI 117.375 125.490 138.737 MG 51.938 55.148 60.332 SICAM 46.477 47.918 49.804 BANIF 22.608 24.332 26.512 Values in Thousands of Euros.
Table 12. Results Analysis
Capital Charge Percentage Variation
2005 2006 2007 2005 2006 2007
BIA 363.495 365.990 367.450 BIA/TSA -3,19% -3,19% -3,19%
TSA 351.904 354.320 355.733 TSA/ ASA -9,61% -7,57% -5,39%
BCP
ASA 318.098 327.511 336.552
BCP
BIA/ ASA -12,49% -10,51% -8,41%
BIA 290.713 279.706 290.382 BIA/TSA -3,19% -3,19% -3,19%
TSA 281.443 270.787 281.122 TSA/ ASA -2,43% 1,05% 3,38%
CGD
ASA 274.596 273.636 290.610
CGD
BIA/ ASA -5,54% -2,17% 0,08%
BIA 210.860 220.045 233.675 BIA/TSA -3,19% -3,19% -3,19%
TSA 204.136 213.028 226.224 TSA/ ASA -11,26% -10,20% -8,36%
BES
ASA 181.157 191.303 207.314
BES
BIA/ ASA -14,09% -13,06% -11,28%
BIA 116.785 124.175 136.335 BIA/TSA -3,19% -3,19% -3,19%
TSA 113.061 120.215 131.988 TSA/ ASA 3,82% 4,39% 5,11%
BPI
ASA 117.375 125.490 138.737
BPI
BIA/ ASA 0,51% 1,06% 1,76%
BIA 57.082 58.588 61.176 BIA/TSA -3,19% -3,19% -3,19%
TSA 55.261 56.720 59.225 TSA/ ASA -15,90% -15,52% -15,91%
SICAM
ASA 46.477 47.918 49.804
SICAM
BIA/ ASA -18,58% -18,21% -18,59%
BIA 45.619 47.396 51.090 BIA/TSA -3,19% -3,19% -3,19%
TSA 44.165 45.885 49.461 TSA/ ASA 17,60% 20,19% 21,98%
MG
ASA 51.938 55.148 60.332
MG
BIA/ ASA 13,85% 16,36% 18,09%
BIA 22.819 24.856 27.047 BIA/TSA -3,19% -3,19% -3,19%
TSA 22.091 24.064 26.184 TSA/ ASA 2,34% 1,11% 1,25%
BANIF
ASA 22.608 24.332 26.512
BANIF
BIA/ ASA -0,92% -2,11% -1,98%
Values in Thousands of Euros.