PROGNOSTIC FACTORS IN PATIENTS WITH APPENDICULAR
MYXOFIBROSARCOMA
FATORES DE PROGNÓSTICO EM PACIENTES COM
MIXOFIBROSSARCOMA APENDICULAR
J
uanP
abloZ
umárraga1, F
eliPea
ugustor
ibeirob
atista1, a
ndrém
athiasb
aPtista1, m
arcelot
adeuc
aiero1,
l
uisP
ablodelar
osam
artino1, o
lavoP
iresdec
amargo21. Universidade de São Paulo, Faculdade de Medicina, Hospital das Clinicas HCFMUSP, Orthopedics and Traumatology Institute, Orthopedic Oncology Group, São Paulo, SP, Brazil. 2. Universidade de São Paulo, Faculdade de Medicina, Orthopedics and Traumatology Institute, São Paulo, SP, Brazil.
Citation: Zumárraga JP, Batista FAR, Baptista AM, Caiero MT, Martino LPR, Camargo OP. Prognostic factors in patients with appendicular myxofibro-sarcoma. Acta Ortop Bras. [online]. 2018;26(5):320-4. Available from URL: http://www.scielo.br/aob.
Work conducted at Orthopedics and Traumatology Institute, Hospital das Clinicas HCFMUSP, Faculdade de Medicina, Universidade de São Paulo, São Paulo, SP, Brazil. Correspondence: Juan Pablo Zumárraga. Rua Ovídio Pires de Campos, 333, Cerqueira Cesar, São Paulo, SP, Brasil. 05403-010. [email protected]
Original article
DOI: http://dx.doi.org/10.1590/1413-785220182605208644
All authors declare no potential conflict of interest related to this article.
Article received in 07/19/2018, approved in 07/24/2018. ABSTRACT
Objective: Myxofibrosarcoma (MFS) is a common soft tissue sar-coma (STS) that affects the extremities in elderly patients. The objective was to analyze the prognostic factors and outcomes of patients with MFS treated at a single institution. Methods: We retrospectively reviewed the records of 75 patients with MFS. We compared age, sex, tumor size and location, grade and stage of the disease. Median age was 49.7 years (range, 1 to 88 y). Location: upper extremity (25.4%), lower extremity (66.6%) and pelvis (8%). Patients had high-grade tumors in 46.7% of the reports. Margins were negative in 76% of the cases. Bivariate Cox regression analysis was used to determine associations between clinical and treatment factors with local recurrence (LR). Results: Median follow-up time was 30.7 months (range, 1.8 to 383.8 m). We found 26.7% of LR. Distant metastasis (DM) was reported in 27 (36%) patients. Lung was the most common site of DM, reported in 92.6% of patients. Overall survival (OS) with metastasis was 21.2 months (range, 4.8 to 114.8 m). Predictors of OS were grade, LR (hazard ratio [HR] 5.13, 95% confidence interval, 2.15-12.24, P <0.001), and DM (HR 540.97, 95% confidence interval, 5.04-58112.03, P< 0.001). Conclusions: Tumor grade, LR, positive margins and DM were significant predictors of
poor OS prognosis. Level of Evidence IV, Case Series.
Keywords: Sarcoma. Excision margins. Recurrence. Radiotherapy. Neoplasm metastasis.
RESUMO
Objetivos: O mixofibrossarcoma (MFS) é um sarcoma de partes moles (SPM) frequente em idosos, que afeta os membros. O objetivo foi analisar os fatores prognósticos e os desfechos dos pacientes diagnosticados com MFS em uma única instituição. Métodos: Foram analisados retrospectivamente prontuários de 75 pacientes com MFS. Comparamos idade, sexo, tamanho e localização do tumor, grau histológico e o estádio da doença. A media da idade foi 49,7 anos (faixa de 1 a 88 anos). A localização foi: membro superior (25,4%), membro inferior (66,6%) e pelve (8%). Dos tumores, 46,7% foram de alto grau. As margens foram negativas em 76%. A análise de regressão de Cox bivariada foi usada para determinar as associações entre os fatores clínicos e de tratamento com a recorrência local (RL). Resultados: A media do acompanhamento foi 30,7 meses (faixa de 1,8 a 383,8 meses) e 26,7% dos pacientes tiveram RL. Metástases a distância (MD) foram relatadas em 27 (36%) pacientes. O local mais comum de MD foi o pulmão (92,6%). A sobrevida geral (SG) com metástase foi 21,2 meses (faixa de 4,8 a 114,8 meses). Os fatores preditivos de SG foram grau, RL (razão de probabilidades [HR] 5,13, intervalo de confiança de 95%, 2,15-12,24, P < 0,001) e MD (HR 540,97, intervalo de confiança de 95%, 5,04-58.112,03, P < 0.001). Conclusões: Grau histológico do tumor, margens comprometidas, RL e MD foram fatores preditivos de pior prognóstico da SG. Nível de Evidencia IV, Série de Casos.
Descritores:Sarcoma. Margens de excisão. Recidiva. Radioterapia. Metástase neoplásica.
INTRODUCTION
MFS is one of the most common STS of elderly patients. Histological-ly, is defined as a spectrum of fibroblastic lesions with variable myx-oid stroma, pleomorfism and a distinctive curved-shaped vascular pattern.1 It was classified as a unique entity by the World Health
Or-ganization (WHO) in 2002, due to its own clinical pattern and patho-logical behavior.2 Commonly they rise in the extremities, but they can
be found in the abdomen, retroperitoneum and in the head as well.3
Surgery continues to be the gold standard treatment for MFS. To achieve wide surgical margins during the procedure, is not only the desirable goal of every surgeon, but also remains a challenge due to its poorly understood behavior.3-4 Chemotherapy (CT) and
radiotherapy (RT) can be used as adjuvant or neoadjuvant settings, but the definitive role of both are not totally defined. They can be also used as palliative therapies for metastatic patients.5-6 But still,
the creation of treatment guidelines, the outcomes and prognostic factors for MFS, remain uncertain.2 They exhibit a relatively better OS
rate than the other STS, however, their propensity for LR, which can be as high as 60%, still remains as an important issue.8-9 Also, LR
is directly associated with tumor grade and DM. Some studies, with poor casuistry, suggest that tumor size, positive surgical margins at resection and necrotic percentage, are possible prognostic factors for OS.10 Nevertheless, an advantage in the prognosis of MFS, is
a low risk of DM with reports in between 20-30% and an OS with reports in between 70-80% in five years.11-12 However, no large
publications have yet totally investigated or defined the prognostic factors of MFS. Then, in an effort to improve the understanding of the clinical outcomes and the prognosis of appendicular MFS, we conducted a retrospective study, evaluating a series of 75 patients, with the purpose of describing the factors associated with the poor prognosis of the disease after surgical treatment.
MATERIALS AND METHODS
A retrospective study was performed after we obtained the approval from the ethical committee review board from our institute. We identify the clinical records from every patient diagnosed with MFS that underwent surgery, in the division of orthopedic oncology, in the last 25 years. A total of 75 patients with MFS in the extremities were included in this study. All the patients with incomplete data in the medical files, with the tumor located in the trunk or the head and that didn’t received surgery as treatment, were excluded from our investigation. Diagnoses were performed by the pathology division of our institute, based on the WHO classification of STS. Demographic data including: gender, age, tumor location, surgery and number of surgeries, surgical margins, histologic grade, adjuvant or neoadjuvant therapy, LR and time to develop LR, DM and time to develop DM, follow up and oncologic status were collected. Histologic grade was determined based on French Federation of Cancer Centers (FNCLCC). The decision on using CT and RT for each patient was studied in multidisciplinary meetings. Of these patients, 44 were female and 31 were male, with a mean age of 53 (range, 1-88years). Most of the tumors (56%) appeared on the right side of the body. The thigh was the most affected anatomical location with 31 cases, followed by the calf 16 cases, forearm 10 cases, pelvis 6 cases, shoulder 4 cases and arm, hand and foot with 3 cases each (Table 1). The size of the tumor was divided in four groups in accordance with the American Joint Committee on Cancer (AJCC) staging system. Group II had 32 patients, group III had 19 patients, group IV had 14 patients and group I had 10 patients reported (Table 1). Sixty four (85.3%) patients received tumor wide resection surgery, while 11 (14.7%) patients underwent limb amputation. Margins were microscopically positive in 18 (24%) cases and negative in 57 (76%) cases. Most cases, 35 (46.7%), had grade 3 (FNCLCC) tumor report. LR was found in 20 (26.7%) cases, of which, 16 (80%) underwent multiple surgical procedures (MSP). Also, we had 27 (36%) reports of DM, being the lungs 25 (97%), lymph nodes 5 (18.5%), abdominal cavity 2 (7.4%) and brain 1 (3.7%) the affected sites (Table 1). Twenty (26.7%) patients received neoadjuvant RT. Median follow up in this study was 30.7 months (range, 1.8-383.8 months among surviving patients). Median survival time was 29 months, OS rate was 59.3%. Twenty three (30.7%) patients died of the disease (Table 1). Pathology reports of surgical margins, LR and OS after the first surgery, were considered the principal objectives of this study. Time for LR, single or multiple, was calculated from the first surgical procedure. OS was estimated using the Kaplan-Meier method. The relation between single surgical procedure (SSP), LR, DM and oncologic status were investigated using the log-rank test for categorical variables. Differences of the p < 0.05 were considered statistically significant. Disease free overall survival (DFOS) was also
estimated using the Kaplan-Meier method. MSP, DM and deaths were considered the secondary objectives of this study. Also, we calculated the OS, time to LR and DFOS using Kaplan-Meier functions and log-rank tests to compare the outcomes of the qualitative variables. The influence of age on the outcomes of the patients was tested using the Cox bivariate regression. The not adjusted HR with their respective confidence interval of 95%, were calculated using the Cox bivariate regression. All the variables, that in the bivariate tests presented significant level of 0.10 (p < 0.1) with the use of multiple Cox regression, were tested in multiple models. The selected variables that when together presented significant level of 5% in the final model,
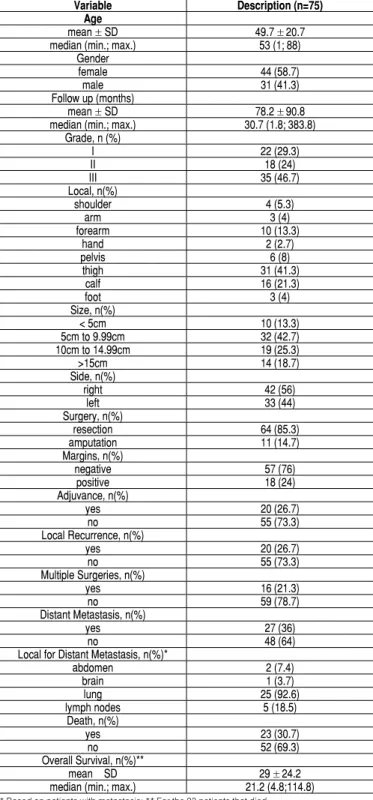
Table 1. Patient demographics and clinical characteristics. Variable Description (n=75)
Age
mean ± SD 49.7 ± 20.7 median (min.; max.) 53 (1; 88)
Gender
female 44 (58.7)
male 31 (41.3)
Follow up (months)
mean ± SD 78.2 ± 90.8 median (min.; max.) 30.7 (1.8; 383.8)
Grade, n (%)
I 22 (29.3)
II 18 (24)
III 35 (46.7)
Local, n(%)
shoulder 4 (5.3)
arm 3 (4)
forearm 10 (13.3)
hand 2 (2.7)
pelvis 6 (8)
thigh 31 (41.3)
calf 16 (21.3)
foot 3 (4)
Size, n(%)
< 5cm 10 (13.3)
5cm to 9.99cm 32 (42.7) 10cm to 14.99cm 19 (25.3)
>15cm 14 (18.7)
Side, n(%)
right 42 (56)
left 33 (44)
Surgery, n(%)
resection 64 (85.3)
amputation 11 (14.7)
Margins, n(%)
negative 57 (76)
positive 18 (24)
Adjuvance, n(%)
yes 20 (26.7)
no 55 (73.3)
Local Recurrence, n(%)
yes 20 (26.7)
no 55 (73.3)
Multiple Surgeries, n(%)
yes 16 (21.3)
no 59 (78.7)
Distant Metastasis, n(%)
yes 27 (36)
no 48 (64)
Local for Distant Metastasis, n(%)*
abdomen 2 (7.4)
brain 1 (3.7)
lung 25 (92.6)
lymph nodes 5 (18.5)
Death, n(%)
yes 23 (30.7)
no 52 (69.3)
Overall Survival, n(%)**
mean ± SD 29 ± 24.2
were tested in multiple models also. For all the statistical analyses, we used the IBM-SPSS software for Windows version 20.0. For tables and charts, we used the Microsoft Excel 2008 version software. All the tests were realized with a significant level of 5%.
RESULTS
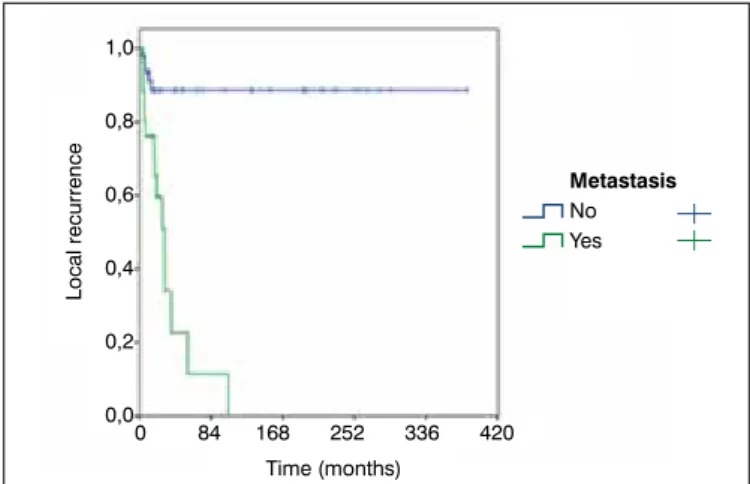
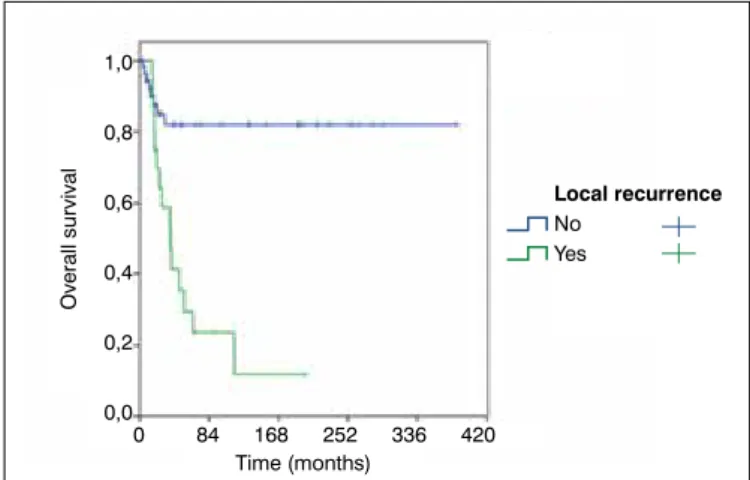
LR was statistically influenced by tumor margins, MSP and DM (p < 0.001) (Figures 1-3). FDOS was statistically influenced by tu-mor grade (FNCLCC), tutu-mor margins, MSP and DM (p < 0.05). LR suffered statistical influence by MSP alone or by tumor margins and DM together. Patients with MSP had 18.82 times a higher risk of LR than patients that had SSP. Positive microscopically margins with DM had 2.84 times a higher risk of LR than negative microscopically margins. Patients with DM had 6.59 times a higher risk of LR than patients without metastasis. DFOS was statistically influenced by MSP and DM. Patients with MSP had 3.11 times a higher risk of diminished DFOS, and patients with reports of DM had 8.17 times a higher risk of diminished DFOS (Figure 4). OS was statistically influenced by tumor grade (FNCLCC), LR, MSP and DM (p < 0.05) (Table 2-3) (Figure 5-6). Together, tumor grade (FNCLCC) and LR had a negative influence in the OS of the patients, being grade III (FNCLCC) 5.79 times a higher risk of death than grade I (FNCLCC) (p = 0.022), and patients with LR had 3.72 times a higher risk of death than patients with no report of LR (p = 0.003). DM is probably the most important prognostic factor to explain OS in patients with MFS, but we were not able to use this variable since none of the patients without metastasis died.
DISCUSSION
MFS it’s a rare tumor that represents 5% of all STS. Considered as the most frequent STS in elderly patients, it has a high rate of LR when compared with other sarcomas. MFS is usually reported as a high grade tumor, with an important potential of DM.13 It is
also often inappropriate excised, due to its variable presentation, infiltrative growth pattern and multiple onset location.3,11,14 The
reasons of the high rates of LR are not completely understood. Some authors believe that MFS cause an extensive invasion on the neighbor tissues, fact that is not visible during surgery.3
Reports of small superficial MFSs, excised in not oncologic centers, treated as benign tumors, which end up being referred to specialized center with LR, is a common finding.11 Some facts,
described in few studies, can be considered to be important for the prognosis of MFS: tumor grade, surgical inadequate or positive margins, LR and DM.15-17 To our knowledge, this is the first
study that describes MFS as a unique entity, in a Latin American hospital, and the casuistry in this case series, is among the largest found in the investigated studies. In our study, 75 patients with pathologically confirmed diagnosis of MFS, and a median follow up of 30.7 months presented: 25% had positive surgical margins, 46.7 % had high grade tumors, 26.7 % had reports of LR and 36% presented DM. This study had a number of limitations. First, the lack of studies on this disease as a unique entity becomes a major difficulty on the research for information. Also the publications are Figure 1. Kaplan-Meier curve for local recurrence according to
sur-gical margins.
Figure 2. Kaplan-Meier curve for local recurrence according to multiple surgeries.
Figure 3. Kaplan-Meier curve for local recurrence according to distant metastasis.
Figure 4. Kaplan-Meier curve for disease free overall survival according to metastasis.
Time (months)
Time (months)
Local recurrence
0 84 168 252 336 420
0 84 168 252 336 420 1,0
0,8
0,6
0,4
0,2
0,0
Margins
Negative Positive
Local recurrence
1,0
0,8
0,6
0,4
0,2
0,0
Multiple
No Yes
Surgeries
Time (months)
Time (months)
0 84 168 252 336 420
0 84 168 252 336 420
Local recurrence
Disease free overall survival
1,0
0,8
0,6
0,4
0,2
0,0
1,0
0,8
0,6
0,4
0,2
0,0
Metastasis
No Yes
Metastasis
Table 2. Analysis of the estimated overall survival of patients according to the different characteristic.
Variable Estimated mean time (months)
CI 95% HR not adjusted
IC 95%
Death Total N % p Inferior Superior Inferior Superior
Gender 0.166
female 246.82 181.85 311.78 1.00 11 44 25.0
male 162.55 111.93 213.17 1.77 0.78 4.02 12 31 38.7
Age (years) 1.02 1.00 1.04 0.108*
Grade 0.002
I 340.98 285.18 396.77 1.00 2 22 9.1
II 183.11 107.12 259.10 3.54 0.68 18.31 5 18 27.8
III 121.71 70.09 173.34 8.70 1.98 38.17 16 35 45.7
Local 0.883
shoulder 200.73 89.87 311.58 0.98 0.11 8.74 1 4 25.0
arm 160.23 46.08 274.39 0.96 0.11 8.58 1 3 33.3
forearm 102.93 67.52 138.35 1.02 0.19 5.62 2 10 20.0
hand 65.57 65.57 65.57 # 0 2 0.0
pelvis 38.08 24.41 51.57 1.73 0.31 9.63 2 6 33.3
thigh 176.07 123.67 228.47 1.22 0.39 3.83 11 31 35.5
calf 258.64 157.97 359.31 1.00 4 16 25.0
foot 40.41 10.34 70.49 3.15 0.57 17.39 2 3 66.7
Size 0,110
<5cm 337.53 252.75 422.31 1.00 1 10 10.0
5 to 9.99cm 158.06 111.70 204.42 3.56 0.45 27.92 10 32 31.3
10 to 14.99cm 177.91 112.21 243.61 4.04 0.50 32.87 7 19 36.8
>15cm 41.73 23.91 59.64 9.11 1.05 79.14 5 14 35.7
Side 0.129
right 165.80 118.40 213.20 1.00 16 42 38.1
left 272.38 203.11 341.65 0.51 0.21 1.24 7 33 21.2
Surgery 0.688
resection 234.23 182.39 286.08 1.00 20 64 31.3
amputation 173.94 76.86 271.02 1.28 0.38 4.35 3 11 27.3
Margins 0.067
negative 274.12 222.87 325.36 1.00 13 57 22.8
positive 73.44 49.32 97.57 2.13 0.93 4.87 10 18 55.6
Adjuvance 0.840
yes 185.10 122.87 247.34 0.91 0.38 2.22 7 20 35.0
no 239.95 182.96 296.95 1.00 16 55 29.1
L. Recurrence <0.001
yes 61.85 32.67 91.03 5.13 2.15 12.24 15 20 75.0
no 317.40 274.99 359.81 1.00 8 55 14.5
M. Surgeries 0.005
yes 71.98 36.63 107.02 3.04 1.33 6.92 11 16 68.8
no 288.06 240.52 355.60 1.00 12 59 20.03
Metastasis <0.001
yes 31.11 20.73 41.49 540.97 5.04 58112.03 23 27 85.2
no 383.77 383.77 383.77 1.00 0 48 0.0
Total 236.82 188.17 285.47 24 75 32.0
Log-rank test; *Cox bivariate regression results.
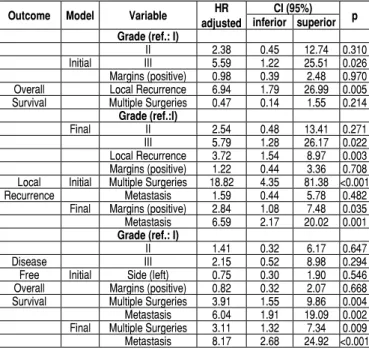
Table 3. Results of the adjusted models for overall survival, local recur-rence and disease free overall survival.
Outcome Model Variable HR adjusted
CI (95%) p inferior superior Grade (ref.: I)
II 2.38 0.45 12.74 0.310 Initial III 5.59 1.22 25.51 0.026 Margins (positive) 0.98 0.39 2.48 0.970 Overall Local Recurrence 6.94 1.79 26.99 0.005 Survival Multiple Surgeries 0.47 0.14 1.55 0.214
Grade (ref.:I)
Final II 2.54 0.48 13.41 0.271 III 5.79 1.28 26.17 0.022 Local Recurrence 3.72 1.54 8.97 0.003 Margins (positive) 1.22 0.44 3.36 0.708 Local Initial Multiple Surgeries 18.82 4.35 81.38 <0.001 Recurrence Metastasis 1.59 0.44 5.78 0.482
Final Margins (positive) 2.84 1.08 7.48 0.035 Metastasis 6.59 2.17 20.02 0.001 Grade (ref.: I)
II 1.41 0.32 6.17 0.647
Disease III 2.15 0.52 8.98 0.294
Free Initial Side (left) 0.75 0.30 1.90 0.546 Overall Margins (positive) 0.82 0.32 2.07 0.668 Survival Multiple Surgeries 3.91 1.55 9.86 0.004 Metastasis 6.04 1.91 19.09 0.002 Final Multiple Surgeries 3.11 1.32 7.34 0.009 Metastasis 8.17 2.68 24.92 <0.001 Cox multiple regression.
often focused on specific subjects of MFS, instead of describing general information on the disease. Second, there are limitations for the applicability of this retrospective study. The information represents those of a single institution, and although it’s the only documented paper of MFS in Latin America, we found a limited capacity of describing prognostic factor with narrow confidence intervals. Third, the information on the medical files is not always complete or understandable, which makes the number of cases included less representative. And fourth, the fact that the follow up time of 30.7 months is short, given that a five year OS is the expected in MFS, it becomes an inherent bias for this study. Clinically, MFS tend to have higher rates of LR when compared with other STS. In older publications, when MFS was known as Malignant Fibrous Histiocytoma (MFH), LR rates ranged from 22% to 79%.16 In newer studies, this range is reported as lower, from
16% to 31%.16-17 The present study reports a LR rate of 26.7%,
corresponding to the reports of modern papers. It seems that LR has a direct relation with tumor grade, surgical margins and DM. Most of the pathological reports for MFS are high grade tumors (FNCLCC). In a series of three different studies, we found that high grade MFS was predominant with 71%, 67% and 88% respective-ly.3,12,14 In our study, high grade tumors were also predominant,
specifically when they are inadequate.15 But evidence supports that
positive margins, in fact, increases LR, affecting the DFOS.10,11,18 As
for DM, most of the studies report low rates with a range varying from 15% to 30%. The most common affected organ is the lung. In accordance to the findings in literature, our rate of DM was 36%, also being the lung the predominant affected organ. Although, the prognostic factors for MFS haven’t been totally defined, there are some facts about the disease that have a direct connection with OS. Authors agree that tumor grade and surgical margins have a close relation with LR, being grade III tumors and reports of positive or not adequate margins, important factors for increasing the rates of LR.11,18 Another important fact is that the LR also increases the
potential for DM, which has a direct effect on follow up time and
Figure 5. Kaplan-Meier curves for overall survival according to tumor grade. Figure 6. Kaplan-Meier curves for overall survival according to local recurrence.
REFERENCES
1. Randall RL. Malignant soft-tissue tumors. In: Schwartz HS, editor. Orthopaedic knowledge update 2: musculoskeletal tumors. 2ed. Rosemont: American Aca-demy of Orthopaedic Surgeons; 2007. p. 277-87.
2. Silverstein E, Gibbs CP. Classification and imaging of soft-tissue tumors. In: Schwartz HS, editor. Orthopaedic knowledge update 2: musculoskeletal tumors. 2ed. Rosemont, IL: American Academy of Orthopaedic Surgeons; 2007. p. 289-99. 3. Sawamura C, Springfield DS, Marcus KJ, Perez-Atayde AR, Gebhardt MC.
Factors predicting local recurrence, metastasis, and survival in pediatric soft tissue sarcoma in extremities. Clin Orthop Relat Res. 2010;468(11):3019-27. 4. Stacchiotti S, Verderio P, Messina A, Morosi C, Collini P, Llombart-Bosch A, et
al. Tumor response assessment by modified Choi criteria in localized high-risk soft tissue sarcoma treated with chemotherapy. Cancer. 2012;118(23):5857-66.
5. Quimby A, Estelle A, Gopinath A, Fernandes R. Myxofibrosarcoma in Head and Neck: Case Report of Unusually Aggressive Presentation. J Oral Maxillofac Surg. 2017;75(12):2709.el-2709.e12.
6. 6. Weiss SW, Enzinger FM. Myxoid variant of malignant fibrous histiocytoma. Cancer. 1977;39(4):1672–85.
7. Kikuta K, Nakayama R, Yoshida A, Sasaki A, Kameyama K, Chuman H, et al. A histological positive margin after surgery is correlated with high local re-recurrence rate in patients with recurrent myxofibrosarcoma. Jpn J Clin
Oncol. 2017;47(4):334–41.
8. Emori M, Tsukahara T, Murata K, Sugita S, Sonoda T, Kaya M, et al. Prognostic im-pact of CD109 expression in myxofibrosarcoma. J Surg Oncol. 2015;111(8):975-9. 9. Look Hong NJ, Hornicek FJ, Raskin KA, Yoon SS, Szymonifka J, Yeap B, et al. Prognostic factors and outcomes of patients with myxofibrosarcoma. Ann Surg Oncol. 2013;20(1):80-6.
10. Sakamoto A, Shiba E, Hisaoka M. Short-term spontaneous regression of
myxofibrosarcoma in the scapular region. Skeletal Radiol. 2014;43(10):1487-90. 11. Sambri A, Bianchi G, Righi A, Ferrari C, Donati D. Surgical margins do not affect prognosis in high grade myxofibrosarcoma. Eur J Surg Oncol. 2016;42(7):1042-8. 12. Scoccianti G, Ranucci V, Frenos F, Greto D, Beltrami G, Capanna R, et al. Soft Tissue Myxofibrosarcoma: A Clinico-Pathological Analysis of a Series of 75
Pa-tients With Emphasis on the Epithelioid Variant. J Surg Oncol. 2016;114(1):50–5.
13. Neagu TP, Sinescu RD, Enache V, Achim SC, Ţigliş M, Mirea LE. Metastatic
high-grade myxofibrosarcoma: review of a clinical case. Rom J Morphol Embryol.
2017;58(2):603–9.
14. Imanishi J, Slavin J, Pianta M, Jackett L, Ngan SY, Tanaka T, et al. Tail of Superficial Myxofibrosarcoma and Undifferentiated Pleomorphic Sarcoma After Preoperative Radiotherapy. Anticancer Res. 2016;36(5):2339-44.
15. Hoang K, Gao Y, Miller BJ. The Variability in Surgical Margin Reporting in Limb Salvage Surgery for Sarcoma. Iowa Orthop J. 2015;35:181-6.
16. Hong NJL, Hornicek FJ, Raskin KA, Yoon SS, Szymonifka J, Yeap B, et al. Prognostic Factors and Outcomes of Patients with Myxofibrosarcoma. Ann Surg Oncol. 2013;20(1):80-6.
17. Odei B, Rwigema JC, Eilber FR, Eilber FC, Selch M, Singh A, et al. Predictors of local recurrence in patients with myxofibrosarcoma. Am J Clin Oncol. 2017. 18. Tsuchie H, Kaya M, Nagasawa H, Emori M, Murahashi Y, Mizushima E, et al. Distant metastasis in patients with myxofibrosarcoma. Ups J Med Sci. 2017;122(3):190-3. 19. Bonvalot S, Levy A, Terrier P, Tzanis D, Bellefqih S, Cesne A, et al. Primary
Extremity Soft Tissue Sarcomas: Does Local Control Impact Survival? Ann
Surg Oncol. 2017;24(1):194–201.
20. le Grange F, Cassoni AM, Seddon BM. Tumour volume changes following pre-operative radiotherapy in borderline resectable limb and trunk soft tissue sarcoma. Eur J Surg Oncol. 2014;40(4):349-401.
AUTHORS’ CONTRIBUTIONS: Each author made significant individual contributions to this manuscript. JPZ (0000-0001-5941-7714)*, FARB (0000-0002-6691-8901)*, AMB (0000-0002-0830-4602)*, MTC (0000-0003-4891-0276)*, LPRM (0000-0002-4280-4053)*, OPC (0000-0002-1128-7292)*, were the main contributors in writing this work. JPZ participated in: research, design, writing and data collection; FARB participated in: concept, research, writing and data collection; AMB participated in: concept, research, writing and data collection; MTC participated in: writing, concept, design, and analysis; LPRM participa-ted in: concept, research, writing and data collection; OPC participaparticipa-ted in: concept, writing and analysis. *ORCID (Open Researcher and Contributor ID).
consequently OS.4,19-20 In our study, we identified that high grade
tumors and positive margins, alone or together, directly increase the rates of LR. Also, we observed that LR has a principal role on the DM appearance. Interestingly, these facts separately or in group affect directly the OS of the patient with MFS. Anyhow, future studies are needed, to see whether these results are similar or not to the new information obtained.
CONCLUSION
In this institutional series of MFS, positive margins and DM were significantly associated with a higher risk of LR. Tumor grade, positive margins LR and DM are significant predictors of OS poor prognosis.
Time (months) Time (months)
Overall survival Overall survival
1,0
0,8
0,6
0,4
0,2
0,0
1,0
0,8
0,6
0,4
0,2
0,0
Tumor grade
I II III
Local recurrence
No Yes