Ciências da Saúde
Awareness, perception and usage of mobile
applications for health and wellness
Diogo Calçada
Dissertação para obtenção do Grau de Mestre em
Medicina
(ciclo de estudos integrado)
Orientador: Prof. Doutor Henrique Martins
ii
"Vem por aqui" — dizem-me alguns com os olhos doces
Estendendo-me os braços, e seguros
De que seria bom que eu os ouvisse
Quando me dizem: "vem por aqui!"
Eu olho-os com olhos lassos,
(Há, nos olhos meus, ironias e cansaços)
E cruzo os braços,
E nunca vou por ali...
A minha glória é esta:
Criar desumanidades!
Não acompanhar ninguém.
— Que eu vivo com o mesmo sem-vontade
Com que rasguei o ventre à minha mãe
Não, não vou por aí! Só vou por onde
Me levam meus próprios passos...
Se ao que busco saber nenhum de vós responde
Por que me repetis: "vem por aqui!"?
iii
Agradecimentos
Porque o meu percurso não foi feito de forma solitária, alguns agradecimentos são devidos.
A quem me criou porque ser mãe ou pai não é só ter um filho mas guia-los nas encruzilhadas da vida, rir com ele mas também chorar por ele.
À minha mana pela sua irreverência e pelos debates bibliófilos.
Ao meu irmão pelas aventuras que desbravamos em vários mundos.
A toda a minha família com especial carinho e saudade à Maria e Inês.
À menina dos meus olhos por seres o que de melhor eu sou.
Não podia deixar de agradecer ao meu orientador, Dr. Henrique Martins pelo apoio e paciência para guiar este jovem inexperiente.
Queria também agradecer à minha segunda família que encontrei na Covilhã a Tuna-Mus, pelo apoio, companheirismo e experiências que levo para a vida.
Aos amigos de sempre e aos que estes seis anos na Covilhã me permitiram conhecer um muito obrigado.
Aos meus colegas de casa que sempre me apoiaram e viram o meu trabalho se desenvolver dia-a-dia.
À FCS, na pessoa do diretor professor Dr. Luís Taborda Barata, pela ajuda que me foi concedida para enriquecer este projeto.
Aos funcionários da faculdade, em especial à Dra. Marta Duarte e senhoras da biblioteca, pelo carinho com que sempre me receberam.
iv
Resumo Alargado
Introdução: Hoje em dia os serviços de saúde enfrentam um grande desafio devido à falta de
pessoal e a difícil acessibilidade. Para preencher essa lacuna é necessário o envolvimento do paciente de forma a gerir a sua doença para que tratamentos mais dispendiosos não sejam necessários. Com o desenvolvimento dos smartphones e disponibilidade de rede sem fios, existe a possibilidade de as plataformas móveis se tornarem um veículo de prestação de cuidados de saúde.
mHealth ou saúde móvel foi definida pelo Global Observatory for eHealth como a prática médica com o auxilio de dispositivos móveis. Estes aplicativos são vistos como ferramentas muito úteis na prevenção e gestão das principais causas de mortalidade. Como o
empowerment dos pacientes é fulcral para que os serviços de saúde cheguem à maioria da
população, as aplicções mHealth (mHealth apps) devem ser posicionadas como uma das principais plataformas de prestação de cuidados de saúde.
O objetivo deste estudo é avaliar o conhecimento, perceção e uso relatado de mHealth apps nos estudantes de medicina em Portugal e numa amostra de conveniência de cidadãos portugueses.
Metodologia: Este estudo tem uma metodologia quantitativa. O seu foco de estudo foi a
população de estudantes de medicina de cada escola médica portuguesa e os habitantes portugueses. A colheita de dados foi feita através de um questionário.
Resultados: Foram obtidas 528 respostas válidas a partir de estudantes de medicina e 301 de
habitantes portugueses.
Na amostra de estudantes de medicina, 65,6% (n = 258) alegou que sabia o que era uma mHealth app e 88,4% afirmaram que conheciam pelo menos uma mHealth app. Na amostra da população portuguesa, 62,9% (n = 159) alegou que sabia o que era uma mHealth app e 74,2% afirmaram que conheciam pelo menos uma mHealth app. As mHealth apps mais conhecidas foram sobre o exercício físico - 86,0% em estudantes de medicina e 87,1% na população portuguesa.
79,4% (n = 181) da amostra de estudantes de medicina e 78,8% (n = 93) da amostra da população portuguesa já utilizou alguma mHealth app. A frequência de utilização das mHealth apps foi elevada em ambas as amostra, com 64,9% de utilizadores frequentes (usando pelo menos 3 vezes por semana) na amostra de estudantes de medicina e 69,9% na amostra da população portuguesa. Dividindo as mHealth apps nas principais causas de morte,
v é verificado que 39,2% (n = 71) da amostra dos estudantes de medicina e 24,4% (n = 20) da amostra da população portuguesa utilizavam este subgrupo de mHealth apps.
Foi encontrada significância estatística entre "ser estudante de medicina" e a perceção de mHealth apps (p = 0,001) e entre o primeiro e a utilização de mHealth apps sobre as principais causas de morte (p = 0,019). A associação entre faixa etária e perceção de mHealth apps também foi estatisticamente significativa (p = 0,030). Também foi encontrada uma tendência para a significância estatística entre o nível de educação e a perceção de mHealth apps (p = 0,065) e entre a faixa etária e o uso de mHealth apps (p = 0,053).
Discussão: As apps são uma ferramenta com muitas potencialidades, pouca necessidade de
investimento monetário ou de ensinar como utilizar. O fator mais importante para a sua utilização é o dispositivo móvel. Por agora, o principal motor do desenvolvimento das mHealth apps são empresas privadas o que pode ter levado a que as apps sobre exercício físico fossem as mHealth apps mais populares (conhecidas e utilizadas). Não se pode excluir a possibilidade da utilização das mHealth apps nas escolas médicas. Como a maioria do trabalho feito está no campo comercial, os criadores concentraram-se em doenças típicas dos países desenvolvidos. Assim, as doenças cardíacas são das mais estudadas e com mais aplicativos juntamente com VIH/SIDA.
A perceção pode ser influenciada por outros fatores como interação com o meio, colegas, poder de compra e predisposição para este tipo de tecnologia. Quase todos os que conhecem e têm alguma perceção das mHealth apps acabam por usa-las. Apesar da elevada aceitação das novas tecnologias entre os grupos etários mais jovens, o fator monetário apenas é superado no grupo etário [23; 28[. A partir do ponto que adquirem o smartphone as pessoas tendem a mantê-lo o tempo todo com elas levando a um grande numero de utilizadores frequentes.
Muito poucas pessoas usam mHealth apps sobre as principais causas de morte. A grande discrepância entre o uso de mHealth apps e o uso deste subconjunto de mHealth apps levanta a possibilidade de o questionário não ter sido claro e/ou o inquirido não estar familiarizado com a expressão. Esta possibilidade também é suportada pela literatura pois existe uma elevada aceitação e difusão de programas de saúde baseados em mHealth apps.
Conclusão: Há um alto nível de conhecimento, perceção, utilização e frequência de
utilização das mHealth apps sendo o smartphone o elemento chave para a utilização destas ferramentas. As mHealth apps parecem ter uma aplicabilidade no Sistema Nacional de Saúde, contudo novos estudos são necessários para aferir se essa possibilidade é custo-efectiva. Por outro lado, esta tecnologia pode ser uma potencial plataforma de ensino nas escolas de médicas.
vi a adaptação das apps existentes à faixa etária ou a utilização com apoio pode dissolver essa relutância.
Foi encontrada uma queda entre o uso de mHealth apps e mHealth apps sobre as principais causas de morte. Esta informação abre uma janela de intervenção para o sistema nacional de saúde de forma a aumentar a utilização deste subconjunto de mHealth apps. Mais estudos são necessários para desvendar a verdadeira natureza desta variável.
Palavras-Chave
vii
Abstract
Introduction: Nowadays, health services face great challenge due to lack of staff and difficult
accessibility. To fill this gap is necessary the patient involvement through the managing of his disease to not need more expensive treatments. With the development of smartphones and availability of wireless network, there is a possibility of mobile platforms to become a health care delivery vehicle.
mHealth or mobile health was defined by Global Observatory for eHealth as a medical practice supported by mobile devices. These applications are seen as very useful tools in the prevention and management of the main mortality causes. As the empowerment of patients is a key element so that health services reach the majority of the population, mHealth applications (mHealth apps) should be positioned as one of the main health care delivery platforms.
The purpose of this study is evaluate the awareness, perception and reported use of mHealth apps in the medical students in Portugal and in a convenience sample of portuguese citizens.
Methodology: This study is a quantitative methodology. The focus of study was the
population of medical students of portuguese medical schools and the portuguese population. Data collection was done through a questionnaire.
Results: It was obtain 528 valid responses from medical students and 301 of the Portuguese
citizens.
In the sample of medical students, 65,6% (n=258) claimed that knew what was a mHealth app and 88,4% said they knew at least one mHealth app. In the sample of the portuguese population 62,9% (n=159) claimed that knew what was a mHealth app and 74,2% said they knew at least one mHealth app. The best known mHealth apps were about physical exercise – 86,0% in the medical students and 87,1% in the portuguese population.
79,4% (n=181) of the sample of medical students and 78,8% (n=93) of the sample of the portuguese population has used some mHealth app. The frequency of use of mHealth apps was high in both sample, with 64,9% of high frequent users (using at least three times per week) in the sample of medical students and 69,9% in the sample of the portuguese population. Dividing the mHealth apps on leading causes of death, it is found that, 39,2% (n=71) of the sample of medical students and 24,4% (n=20) of the sample of the portuguese population were using this subset of mHealth apps.
viii mHealth apps (p=0,001) and the use of mHealth apps on the main causes of death (p=0,019). The association between age and mHealth apps perception was also statistically significant (p=0,030). A trend toward statistical significance between the level of education and the perception of mHealth apps (p=0.065) and between the age group and the use of mHealth apps (p=0.053) was also found.
Discussion: The apps are a tool with great potential, little need for monetary investment or
to teach how to use and the most important factor for its use is the mobile device. For now, the main engines of development of mHealth apps are private companies which may have led to the apps on exercise being the most popular mHealth apps (known and used). One can not exclude the possibility of using these apps in medical schools. As most of the work is done in the commercial field, the developers have focused on diseases typical of developed countries. Thus, the heart disease is one of the most studied and with more applications with HIV/AIDS.
The perception may be influenced by other factors such as interaction with the environment, peers, purchasing power and predisposition for this type of technology. Almost all of those who know and have some perception of mHealth apps use them. Despite the high acceptance of new technologies among younger age groups, the monetary factor is only surpassed in age group [23; 28[. From the point that smartphone is acquired people tend to keep it all the time with them leading to a large number of high frequent users.
Very few people use mHealth apps of the main causes of death. The large discrepancy between the use of mHealth apps and the use of this subset of mHealth apps raises the possibility that the questionnaire was not clear and/or the respondent was not familiar with the term. This possibility is also supported by the literature as there is a high acceptance and dissemination of health programs based on mHealth apps.
Conclusion: There is a high level of awareness, perception, use and frequency of use of
mHealth apps being the smartphone the key to use these tools. The mHealth apps seem to have applicability in the National Health System, but further studies are needed to assess if this option is cost-effective. Moreover, this technology can be a potential teaching platform in medical schools.
It seems that the older age groups have some reluctance to use apps. Possibly the adaptation of existing apps to age group or use with support can dissolve this reluctance.
A break between the use of mHealth apps and mHealth apps of the main causes of death was found. This information opens a window of intervention to the national health system in order
ix to increase the use of this subset of mHealth apps. More studies are needed to uncover the true nature of this variable.
Keywords
x
Index
AGRADECIMENTOS ... III RESUMO ALARGADO ... IV ABSTRACT ... VII GRAPH INDEX ... XI TABLE INDEX ... XIII INDEX OF ACRONYMS ... XIVINTRODUCTION ... 1
METHODOLOGY ... 3
1. TYPE OF STUDY ... 3
2. THE STUDY POPULATION ... 3
3. QUESTIONNAIRE ... 3
4. DATA COLLECTION METHOD ... 4
5. VARIABLES ... 4 6. ANALYSIS PROCEDURE ... 5 RESULTS ... 6 1. DESCRIPTIVE STATISTICS ... 6 1.1. Student population ... 6 1.2. Portuguese population ... 16 2. STATISTICAL INFERENCE ... 26
1.1. Comparing level of education with: ... 28
1.2. Comparing both samples... 29
1.3. Comparing age groups ... 30
RESULTS DISCUSSION ... 32 CONCLUSION ... 36 REFERENCES ... 38 ANNEXS ... 40 ANNEX A ... 41 ANNEX B ... 49 ANNEX C ... 57
xi
Graph index
Figure 1 - age distribution in medical students’ sample ... 6
Figure 2 - college distribution in medical students’ sample ... 7
Figure 3 - year distribution in medical students’ sample ... 7
Figure 4 - mobile devices usage except cellphone in medical students’ sample ... 8
Figure 5 - frequency of usage of apps by the medical students’ sample ... 8
Figure 6 - perception of mHealth apps in medical students’ sample ... 10
Figure 7 - forms to contact with mHealth apps in the medical students’ sample ... 11
Figure 8 - reasons to not use mHealth apps in non-users of mHealth apps group in medical students’ sample ... 11
Figure 9 - desired mHealth apps by non-users of mHealth apps group in medical students’ sample ... 12
Figure 10 - ways of introduction to mHealth apps in users of mHealth apps group in medical students’ sample ... 12
Figure 11 - usage of mHealth apps by theme in medical students’ sample ... 13
Figure 12 - reasons to use mHealth apps in medical students’ sample ... 14
Figure 13 - frequency of usage of mHealth apps by the medical students’ sample ... 15
Figure 14 - usage of mHealth apps by leading death causes in medical students’ sample ... 15
Figure 15 - age distribution in the sample and in the portuguese population ... 16
Figure 16 - mobile devices usage except cellphone in Portuguese population’s sample ... 18
Figure 17 - frequency of usage of apps by the Portuguese population’s sample ... 18
Figure 18 - perception of mHealth apps in portuguese population’s sample ... 20
Figure 19 - forms to contact with mHealth apps in the Portuguese population’s sample ... 21
Figure 20 - reasons to not use mHealth apps in non-users of mHealth apps group in Portuguese population’s sample ... 21
Figure 21 - desired mHealth apps by non-users of mHealth apps group in portuguese population’s sample ... 22
Figure 22 - ways of introduction to mHealth apps in users of mHealth apps group in Portuguese population’s sample ... 22
Figure 23 - usage of mHealth apps by theme in Portuguese population’s sample ... 23
Figure 24 - reasons to use mHealth apps in portuguese population’s sample ... 24
Figure 25 - frequency of usage of mHealth apps by the Portuguese population’s sample ... 25
Figure 26 - usage of mHealth apps by leading death causes in Portuguese population’s sample ... 25
Figure 27 - grouped age distribution of medical students’ sample ... 26
Figure 28 - grouped age distribution of Portuguese population’s sample ... 26
Figure 29 - grouped level of education of Portuguese population’s sample ... 27
xiii
Table Index
Table 1 - thematic analysis of the open response question of the time of use of apps of the
medical students’ sample ... 9
Table 2 - thematic analysis of the open response question of the apps already used of the medical students’ sample ... 9
Table 3 - thematic analysis of the open response question of the known mHealth apps of the medical students’ sample ... 10
Table 4 - thematic analysis of the open response question of the mHealth apps already used of the medical students’ sample ... 13
Table 5 - thematic analysis of the open response question of the time of use of mHealth apps of the medical students’ sample ... 14
Table 6 - gender distribution in the sample and Portuguese population ... 16
Table 7 - gender distribution in the sample and Portuguese population ... 17
Table 8 - thematic analysis of the open response question of the profession in the Portuguese population’s sample ... 17
Table 9 - thematic analysis of the open response question of the time of use of apps in the Portuguese population’s sample ... 19
Table 10 - thematic analysis of the open response question of the apps already used in the Portuguese population’s sample ... 19
Table 11 - thematic analysis of the open response question of the known mHealth apps in the Portuguese population’s sample ... 20
Table 12 - thematic analysis of the open response question of the mHealth apps already used in the Portuguese population’s sample ... 23
Table 13 - thematic analysis of the open response question of the time of use of mHealth apps in the Portuguese population’s sample ... 24
Table 14 - inferential statistics comparing level of education with dependent variables ... 28
Table 15 - inferential statistics comparing both populations with dependent variables ... 29
xiv
Index of Acronyms
AIDS Acquired immunodeficiency syndrome App Mobile application
e-mail Electronic mail
FMUC Faculdade de Medicina da Universidade de Coimbra FMUL Faculdade de Medicina da Universidade de Lisboa FMUP Faculdade de Medicina da Universidade do Porto GOe Global Observatory for eHealth
GPS Global Positioning System
GSMA Groupe Speciale Mobile Association HIV Human Immunodeficiency Virus
ICBAS Instituto de Ciências Biomédicas Abel Salazar ICT Information and Communications Technology
iPod Portable media player designed and marketed by Apple Inc. ITU International Telecommunication Union
mHealth Mobile health
NMS-FCM NOVA Medical School – Faculdade de Ciências Médicas PDA Personal Digital Assistant
PwC Price Waterhouse and Coopers & Lybrand
UAlg-DCBM Universidade do Algarve – Departamento de Ciências Biomédicas e Medicina UBI-FCS Universidade da Beira Interior – Faculdade de Ciências da Saúde
UM-ECS Universidade do Minho – Escola de Ciências da Saúde UN United Nations
1
Introduction
In the 21th century, healthcare continues to be a challenge, not only because of the costs but also due of the lack of staff and difficult access. The current rate of medical training only supplies four physicians for every 1000 patients worldwide (1). In developed countries, with the ageing population and sedentary life style, the impact of chronic diseases is growing every day, overloading the healthcare systems. On the other hand, in the developing countries, access to the healthcare continues to be a challenge (2).
Given such a disparity between the offer and demand, and the limited response capacity of health services, there is the risk of increasing undiagnosed diseases and also poorly controlled chronic diseases like diabetes (3). In order to fill this gap, self-management has become one of the main concerns of health authorities and providers. Patient engagement in the disease management it has the potential to provide the necessary care and decrease the demand for expensive treatment (1).
In contrast to the healthcare access, the mobile access is becoming almost world wide spread. According to the International Telecommunication Union (ITU) there are approximately 5 billion mobile phone subscriptions in the world, with over 85% of the world’s population covered by a commercial wireless signal and over 70% of them residing in low and middle income countries (4).
Through the development of smartphones and the availability of wireless signal almost everywhere, the stage is set for the development of mobile platforms as vehicle of healthcare services. The Global Observatory for eHealth (GOe) named mHealth or mobile health to the medical and public health practice supported by mobile devices, such as mobile phones, patient monitoring devices, personal digital assistants (PDAs), and other wireless devices (4).
According to the report from GSMA/PwC, about 50% of mobile phone and tablet users will have downloaded mHealth applications (mHealth apps) within five years (2). The potential for mHealth apps is rather well-documented (5–7) and they are seen as very useful tools in the prevention and management of the leading mortality causes (8).
Since nowadays empowerment is considered a new tool to bring health services to the majority of the population, we must position mHealth as one of the main platforms to provide this new paradigm of ubiquitous health care.
The aim of this work is assess the knowledge, perception and reported use of mHealth apps in two subpopulations - students of medicine in Portugal and a convenience sample of the
2 were chosen because the medical students are the physicians of tomorrow so, certainly, they will need this technology to provide a good healthcare service; on the other hand, the general population is the end user of this kind of product and if there is no awareness or a low rate of use the benefit of this technology will be limited. The specific objectives of this study were:
a) To explore the level of awareness and usage of mHealth apps in medical students population and general population, and;
b) To investigate the relationship between awareness, perception and usage of mHealth apps in general and for looking up information about the main causes of mortality and the following variables:
a. Age, level of education; b. being a medical student;
Considering the proposed objectives, the following hypotheses were established:
Hypothesis 1: There is a relationship between level of education and the contact with
mobile applications for health and well-being.
Hypothesis 2: There is a relationship between being a medical student and the
contact with mobile applications for health and well-being.
Hypothesis 3: There is a relationship between age group and the contact with mobile
3
Methodology
1. Type of study
This study uses a mostly quantitative methodology. The intention is to collect and process the data in a systematic fashion, while also statistically establishing relationships between variables to address the hypotheses of this thesis. The data were collected in a single moment. This constituted a cross-sectional study.
2. Study population
This work focused in two different sets of populations. One population was the estimated universe of 7520 medical students of every portuguese medical school. Per year, it is estimated that there are 970 new medical students and the total of students in each moment, assuming that each course are six years (except in UAlg-DCBM which is four years), estimated to be 7520. The other was the universe of 10.562.178 portuguese inhabitants1.
The total sample of medical students was constituted of 528 (380 female). The representativeness by gender would imply the verification student-to-student so it was not made. However, by empirical finding of the great proportion of female students, it was considered that the sample is a trustworthy representation of the population.
The total sample of Portuguese inhabitants was constituted of 301 (157 female). The gender, age and level of education of Portuguese population it not aim to be fully representative of the Portuguese Population but rather a subsample of active population, as it can be seen through empirical finding.
3. Questionnaire
The data collection was made through an anonym and auto-reply questionnaire (Annex A and B), that was built for that purpose with four parts:
Sociodemographic data;
Contact with mobile devices;
Contact with apps;
4 o Non-users of mHealth apps;
o Users of mHealth apps.
Some information about mobile operative systems used by the responders were gathered, however, as it was not immediately useful in this study, it was not displayed in the results section.
4. Data collection method
The survey was sent to the mailing list of every medical student through collaboration of administrative systems of each college and was available between the 7th of January and 1st of March, 2014.
Regarding the distribution of questionnaire in the Portuguese population, the social network Facebook® was used to obtain a convenience sample during the same time interval of the medical students’ population.
The timing for the application of the survey was defined taking into account the school calendar in order to avoid the evaluation periods while not delaying the study.
The questionnaire was built in the Google forms allowing the criterion of anonymity (it was not possible to connect the answers to who answered). This platform also allowed the questionnaire to be filled only once and the inability to access the questionnaire by anyone outside the database.
5. Variables
In this study, the dependent variables were: knowing what is a mHealth app, knowing at least one mHealth app, use of mHealth app, groups of mHealth apps used, frequency of use of mHealth apps, use of mHealth apps categorized in one of the main causes of death on Portugal.
The independent variables were: age, gender and being a medical student; in the sample of medical students, the year and college one attended; in the sample of Portuguese population was also level of education, profession and living in Portugal.
5
6. Analysis procedure
The data analysis was made as shown in the scheme of the annex C.
The analysis of the data was made with the software Statistical Package for the Social Sciences® version 22.0.
A first approach was made with descriptive statistical analysis of the variables and an exploratory analysis of the continuous variables (mean and standard deviation) as well as analysis of the categorical variable frequencies. The variable’s distribution was analyzed graphically through bar charts.
The second approach of the analysis corresponded to the inferential study of the data through non-parametric tests, with the objective of assessing the relation between the variables and check if there are significant differences between the studied subpopulations. In this phase bar charts were also used to analyze the behavior of some variables between the study groups’.
To assess the relation between categorical variables, the chi square test was used. The chi square test of independence allows analyze the relationship independence between qualitative variables – this test reports the relationship independence, but don’t report the degree of association.
The null hypothesis of the tests of independence considers that the variables analyzed are independent for a significance level of 5%. Thereby, if the obtained p value is higher than 0,05 (p≥0,05) the differences between the obtained values and the expected values are considered not significant and, therefore, the variables do not correlate.
However, the chi square test presupposes that no table cell has an expected frequency lower than 1 and that no more than 20% of table cells has an expected frequency lower that 5 units. If that happens the Fisher’s exact test is used with the same null hypothesis as the chi square test (9).
6
Results
1. Descriptive statistics
1.1. Student population
From the pool of responses obtained from medical students, four had less than eighteen years of age, and one did not have a cellphone. These were excluded from this study.
From the estimated universe of 7520 medical students from Portuguese medical schools, 528 valid responses were obtained. This is a sample size of 7,02%, from these, 380 (71,97%) were female.
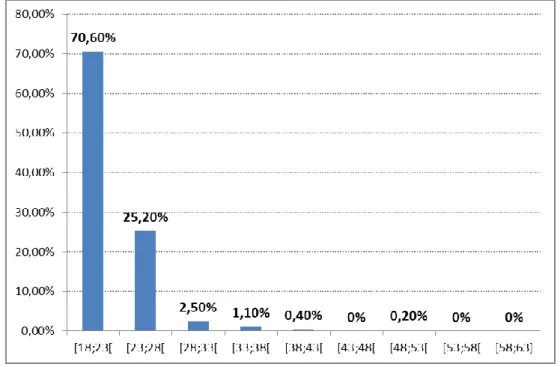
The average age was 21,50 ± 0,147 years and the age distribution can be seen in the chart below.
Figure 1 - age distribution in medical students’ sample
7
Figure 2 - college distribution in medical students’ sample
FMUC - Faculdade de Medicina da Universidade de Coimbra; FMUL - Faculdade de Medicina da Universidade de Lisboa; FMUP - Faculdade de Medicina da Universidade do Porto; ICBAS - Instituto de Ciências Biomédicas Abel Salazar; NMS-FCM - NOVA Medical School – Faculdade de Ciências Médicas; UAlg-DCBM - Universidade do Algarve – Departamento de Ciências Biomédicas e Medicina; UBI-FCS - Universidade da Beira Interior – Faculdade de Ciências da Saúde; UM-ECS - Universidade do Minho – Escola de Ciências da Saúde
The number of responses per year was roughly equal.
Figure 3 - year distribution in medical students’ sample
As to other mobile devices except cellphone, 96,9% uses laptop too as can be seen in the graph.
8
Figure 4 - mobile devices usage except cellphone in medical students’ sample
From the initial sample, 417 (79%) had smartphone constituting the subpopulation in which will focus this study. In this sample 21% never used a Smartphone, 94,2% claimed to know what an app was.
Additional results will focus on the set respondents that claim to know what an app is. In this new group, 99,2% knew someone that uses apps. Most part of these people (92,1%) had a daily use of apps and 6,9% uses 2 to 3 times a week.
Of those that know what an app is, 94,9% already used an app. From these, the majority (82,8%) were using apps daily.
9 Table 1 and 2 show results of answers to the open response:
Table 1 - thematic analysis of the open response question of the time of use of apps of the medical students’ sample
Time Number of responses
Less than 1 year 17
Less than 2 year 26
Less than 3 year 18
Less than 4 year 14
Less than 5 year 10
Less than 6 year 8
Less than 10 year 4
More than 10 years 4
Total of valid responses 101
Table 2 - thematic analysis of the open response question of the apps already used of the medical students’ sample
Apps’ category Number of responses
Social network 272
Entertainment 130
Communication 122
Games 86
Medicine’s information and games 86
E-mail 57
Office apps and organizers 49
Public transport 38
Virtual drives 32
Maps / GPS 30
Total of valid answers 1199
In the group of apps’ users, 258 (65,6%) claimed to knew what was a mHealth app.
From this point on, it will be considered only those that knew what a mHealth app was. In this subpopulation, 88,4% claimed to knew at least one mHealth app.
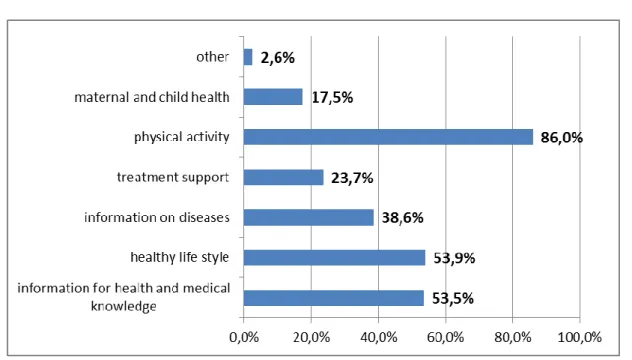
From this point on, it will be considered only those that knew at least one mHealth app. The mHealth app with the best known theme was about physical exercise (86,0%).
10
Figure 6 - perception of mHealth apps in medical students’ sample
The analysis of the answers to the open response question “mHealth apps that knows” can be seen in the following table.
Table 3 - thematic analysis of the open response question of the known mHealth apps of the medical students’ sample
mHealth apps’ category Number of responses
Physical exercise 80
Support of diagnosis and treatment 77
Healthy life style 25
Vital signs 7
Medical guidelines 6
Articles search 6
Therapeutic records 5
Healthy sleep habits 4
Medications reminders 3
Medical dictionary 3
Total of valid responses 250
The most common way in which it entered in contact with the mHealth apps was through research in the applications stores (75,4%) and the less common way was through medical advice.
11
Figure 7 - forms to contact with mHealth apps in the medical students’ sample
From this population with perception of mHealth apps, 181 (79,4%) already used some mHealth apps. With this response it was created two subpopulations, one with those that already used mHealth apps that we defined as users of mHealth apps and another with those that never used that we defined as non-users of mHealth apps.
Non-users of mHealth apps
The main reason why this sample had not used mHealth apps was not feeling the need to use it (69,6%).
Figure 8 - reasons to not use mHealth apps in non-users of mHealth apps group in medical students’ sample
12 physical exercise and healthy life style (both with 50%).
Figure 9 - desired mHealth apps by non-users of mHealth apps group in medical students’ sample
Users of mHealth apps
The majority of this sample was introduced to the mHealth apps through themselves (98,3%).
Figure 10 - ways of introduction to mHealth apps in users of mHealth apps group in medical students’ sample
13 The analysis of the answers to the open response question “mHealth apps that already used” can be seen in the following table.
Table 4 - thematic analysis of the open response question of the mHealth apps already used of the medical students’ sample
mHealth apps’ category Number of responses
Physical exercise 49
Support of diagnosis and treatment 47
Healthy life style 13
Medical games 7 Scientific journals 5 Vital signs 5 Medical guidelines 4 Women’s health 4 Therapeutic records 4 Medical books 3
Total of valid responses 158
The most used mHealth app was about physical exercise (79,4%).
Figure 11 - usage of mHealth apps by theme in medical students’ sample
The main reason to use mHealth apps was to support physical exercise (65%), curiosity (66,1%) and the less frequent reason was medical advice (12,4%).
14
Figure 12 - reasons to use mHealth apps in medical students’ sample
The analysis of the answers to the open response question “how long was using mHealth apps” can be seen in the following table.
Table 5 - thematic analysis of the open response question of the time of use of mHealth apps of the medical students’ sample
Time Number of responses
Less than 1 year 33
Less than 2 year 57
Less than 3 year 29
Less than 4 year 15
Less than 5 year 8
Less than 6 year 3
More than 6 year 4
No longer uses 1
Total of valid responses 150
15
Figure 13 - frequency of usage of mHealth apps by the medical students’ sample
Dividing the mHealth apps in the ten leading death causes we see that 39,2% (n=71) was using this subgroup of mHealth apps and the theme with most used apps was ischemic heart disease (74,6%).
16
1.2. Portuguese population
From de pool of responses obtained, nine had less than eighteen years, sixteen lived outside Portugal and three did not had cellphone therefor were excluded from this study.
Through a convenience sample were obtained 301 valid responses.
In the table below it can be seen the gender distribution in this sample and in the Portuguese population1.
Table 6 - gender distribution in the sample and Portuguese population
Sample Portuguese population
Male 47,8% 47,8%
Female 52,2% 52,2%
The average age of the sample was 29,53 ± 0,673 years. In the graph below is shown the age distribution of the sample and the corresponding age groups of the Portuguese population1.
Figure 15 - age distribution in the sample and in the portuguese population
In the table below it can be seen the level of education in this sample and in the Portuguese population1.
17
Table 7 - gender distribution in the sample and Portuguese population
Sample Portuguese population
Primary education 0,33% 44,65%
Secondary education 2,33% 21,28%
High School 36,54% 17,52%
College 60,80% 16,54%
Except to gender distribution, the age and level of education distributions in the sample do not reflect general portuguese population.
The analysis of the answers to the open response question “What do you do for living” can be seen in the following table.
Table 8 - thematic analysis of the open response question of the profession in the Portuguese population’s sample
Time Number of responses
Student 109
Security / armed forces 44
Health care 42 Teacher / educator 35 Operating assistant 17 Unemployed / retired 10 Engineer 10 Businessman 7 Merchant 7 Factory worker 4
Total of valid responses 305
As to other mobile devices except cellphone, 95,9% were using portable too.
18
Figure 16 - mobile devices usage except cellphone in Portuguese population’s sample
From the initial sample, 231 (76,7%) had smartphone. These constituted the subpopulation which was used for further study. In this sample of Portuguese population 23,3% never used a Smartphone. In this subpopulation, 96,5% claimed to knew what an app was.
From this point on, it will be considered only those that knew what an app was. In this new group 97,8% knew someone that was using apps. Most part of these people (87,2%) had a daily use of apps.
In this subpopulation, 95,5% already used an app. From these, the majority (79,8%) was using apps daily.
19 Table 9 and 10 show results of answers to the open response:
Table 9 - thematic analysis of the open response question of the time of use of apps in the Portuguese population’s sample
Time Number of responses
Less than 1 year 14
Less than 2 years 51
Less than 3 years 56
Less than 4 years 22
Less than 5 years 16
Less than 6 years 13
Less than 7 years 1
Less than 8 years 3
Less than 10 years 2
More than 10 years 7
Total of valid responses 185
Table 10 - thematic analysis of the open response question of the apps already used in the Portuguese population’s sample
Apps’ category Number of responses
Social network 127 Communication 55 Physical exercise 44 Games 37 Maps / GPS 37 Entertainment 33 E-mail 28 Online stores 21 Business 13 Browsers 12
Total of valid answers 531
In the group of apps’ users, 159 (62,9%) claimed to knew what was a mHealth app. From this point on, it will be considered only those that knew what a mHealth app was.
In this subpopulation, 74,2% claimed to knew at least one mHealth app. From this point on, it will be considered only those that knew at least one mHealth app.
20
Figure 18 - perception of mHealth apps in portuguese population’s sample
The analysis of the answers to the open response question “known mHealth apps” can be seen in the following table.
Table 11 - thematic analysis of the open response question of the known mHealth apps in the Portuguese population’s sample
mHealth apps’ category Number of responses
Physical exercise 57
Healthy life style 16
Support of diagnosis and treatment 11
Clinical diary 5 Pregnancy 4 Pharmacy 3 Anatomy 3 Quit smoking 2 Female calendar 1
Total of valid responses 102
The most common way in which responders made contact with the mHealth apps was through research in the applications stores (60,3%) and the less common way was through medical advice (1,7%).
21
Figure 19 - forms to contact with mHealth apps in the Portuguese population’s sample
From this population with perception of mHealth apps, 93 (78,8%) already used some mHealth app.
With this response it was created two subpopulations, one with those that already used mHealth apps that we defined as users of mHealth apps and another with those that never used that we defined as non-users of mHealth apps.
Non-users of mHealth
The main reason for this sample had not used the mHealth apps was not feeling the need to use it (56%).
Figure 20 - reasons to not use mHealth apps in non-users of mHealth apps group in Portuguese population’s sample
22 activity (48,1%).
Figure 21 - desired mHealth apps by non-users of mHealth apps group in portuguese population’s sample
Users of mHealth
The majority of this sample was introduced to the mHealth apps through themselves (94,4%).
Figure 22 - ways of introduction to mHealth apps in users of mHealth apps group in Portuguese population’s sample
The analysis of the answers to the open response question “mHealth apps that already used” can be seen in the following table.
23
Table 12 - thematic analysis of the open response question of the mHealth apps already used in the Portuguese population’s sample
mHealth apps’ category Number of responses
Physical exercise 31
Healthy life style 8
Pregnancy 3 Clinical diary 3 Quit smoking 2 Anatomy 2 Female calendar 1 Pharmacies 1
Total of valid responses 51
The most used mHealth app was about physical activity (88,4%).
Figure 23 - usage of mHealth apps by theme in Portuguese population’s sample
24
Figure 24 - reasons to use mHealth apps in portuguese population’s sample
The analysis of the answers to the open response question “how long was using mHealth apps” can be seen in the following table.
Table 13 - thematic analysis of the open response question of the time of use of mHealth apps in the Portuguese population’s sample
Time Number of responses
Less than 1 year 18
Less than 2 years 21
Less than 3 years 20
Less than 4 years 6
More than 4 years 5
Total of valid responses 66
25
Figure 25 - frequency of usage of mHealth apps by the Portuguese population’s sample
Dividing the mHealth apps in the ten leading death causes we see that 24,4% (n=20) was using this subgroup of mHealth apps and the theme with most used mobile applications was respiratory diseases (37,5%).
26
2. Statistical inference
Some variables were grouped in order to increase the strength of the test used.
So, it was created 3 age groups – [18;23[, [23;28[ and >= 28 - taking into account the distribution observed previously. Their distribution can be seen in the following charts.
Figure 27 - grouped age distribution of medical students’ sample
Figure 28 - grouped age distribution of Portuguese population’s sample
The degree of education of the sample of portuguese population was divided in those with a college degree and those with no college degree.
27
Figure 29 - grouped level of education of Portuguese population’s sample
The frequency of use of mHealth apps was grouped in high frequent users – which were using daily or two or three times a week – and low frequent users – which were using two to three times a month or almost never.
28
Figure 31 - grouped frequency of use of mHealth apps of Portuguese population’s sample
1.1. Comparing level of education with:
Table 14 - inferential statistics comparing level of education with dependent variables Level of education
Total No college degree College degree
Awareness of
mHealth apps Yes 50 56,2% 86 64,2% 136 61,0% No 39 43,8% 48 35,8% 87 39,0% Total 89 100,0% 134 100,0% 223 100,0% (qui2=1,438; gl=1; p=0,230 > 0,05) Perception of
mHealth apps Yes 33 66,0% 69 80,2% 102 75,0% No 17 34,0% 17 19,8% 34 25,0% Total 50 100,0% 86 100,0% 136 100,0% (qui2=3,416; gl=1; p=0,065 > 0,05) Usage of
mHealth apps Yes 26 78,8% 56 81,2% 82 80,4% No 7 21,2% 13 18,8% 20 19,6% Total 33 100,0% 69 100,0% 102 100,0% (qui2=0,080; gl=1; p=0,778 > 0,05)
29 Frequency of usage of mHealth apps High frequent user 19 73,1% 39 69,6% 58 70,7% Low frequent user 7 26,9% 17 30,4% 24 29,3% Total 26 100,0% 56 100,0% 82 100,0% (qui2=0,101; gl=1; p=0,750 > 0,05) Usage of mHealth apps about the main causes of mortality Yes 4 15,4% 16 28,6% 20 24,4% No 22 84,6% 40 71,4% 62 75,6% Total 26 100,0% 56 100,0% 82 100,0% (qui2=1,674; gl=1; p=0,196 > 0,05)
1.2. Comparing both samples
Table 15 - inferential statistics comparing both populations with dependent variables Sample
Total Students General
population Awareness of
mHealth apps Yes
258 65,6% 136 61,0% 394 64,0% No 135 34,4% 87 39,0% 222 36,0% Total 393 100,0% 223 100,0% 616 100,0% (qui2=1,342; gl=1; p=0,247 > 0,05) Perception of
mHealth apps Yes
228 88,4% 102 75,0% 330 83,8% No 30 11,6% 34 25,0% 64 16,2% Total 258 100,0% 136 100,0% 394 100,0% (qui2=11,705; gl=1; p=0,001 < 0,05) (phi= 0,172; p=0,001) Usage of
mHealth apps Yes
181 79,4% 82 80,4% 263 79,7% No 47 20,6% 20 19,6% 67 20,3% Total 228 100,0% 102 100,0% 330 100,0%
30 Frequency of usage of mHealth apps High frequent user 124 68,5% 58 70,7% 182 69,2% Low frequent user 57 31,5% 24 29,3% 81 30,8% Total 181 100,0% 82 100,0% 263 100,0% (qui2=0,131; gl=1; p=0,718 > 0,05) Usage of mHealth apps about the main causes of mortality Yes 71 39,2% 20 24,4% 91 34,6% No 110 60,8% 62 75,6% 172 65,4% Total 181 100,0% 82 100,0% 263 100,0% (qui2=5,489; gl=1; p=0,019 < 0,05) (phi=0,144; p=0,019)
1.3. Comparing age groups
Table 16 - inferential statistics comparing age groups with dependent variables Age groups
Total [18;23[ [23;28[ >= 28
Awareness of
mHealth apps Yes
228 63,0% 114 69,5% 52 57,8% 394 64,0% No 134 37,0% 50 30,5% 38 42,2% 222 36,0% Total 362 100,0% 164 100,0% 90 100,0% 616 100,0% (qui2=3,835; gl=2; p=0,147 > 0,05) Perception of
mHealth apps Yes
195 85,5% 98 86,0% 37 71,2% 330 83,8% No 33 14,5% 16 14,0% 15 28,8% 64 16,2% Total 228 100,0% 114 100,0% 52 100,0% 394 100,0% (qui2=7,004; gl=2; p=0,030 < 0,05) (phi=0,133; p=0,030) Usage of
mHealth apps Yes
150 76,9% 86 87,8% 27 73,0% 263 79,7% No 45 23,1% 12 12,2% 10 27,0% 67 20,3%
31 Total 195 100,0% 98 100,0% 37 100,0% 330 100,0% (qui2=5,894; gl=2; p=0,053 > 0,05) Frequency of usage of mHealth apps High frequent user 100 66,7% 65 75,6% 17 63,0% 182 69,2% Low frequent user 50 33,3% 21 24,4% 10 37,0% 81 30,8% Total 150 100,0% 86 100,0% 27 100,0% 263 100,0% (qui2=2,588; gl=2; p=0,274 > 0,05) Usage of mHealth apps about the main causes of mortality Yes 47 31,3% 36 41,9% 8 29,6% 91 34,6% No 103 68,7% 50 58,1% 19 70,4% 172 65,4% Total 150 100,0% 86 100,0% 27 100,0% 263 100,0% (qui2=3,006; gl=2; p=0,223 > 0,05)
32
Results discussion
Some considerations from data collected will be drawn before moving on to the analysis of the hypotheses proposed.
First, except for gender distribution, the age and level of education distributions in the sample of Portuguese population do not reflect general portuguese population. As is observed, the sample age distribution is biased towards the younger age groups and the level of education is biased towards the college degree group. This may be due the fact that the distribution of questionnaire was made through the social network Facebook®. Such bias may be because the sample reflected the social contacts of the observer which in turn were influenced by his gender, age and level of education.
An interesting detail obtained in the data is that the majority contacted for the first time with this technology through research (60,3%) or friends/family/neighbors (45,7%) and almost all subjects in the sample already used an app (94,9% student sample and 95,5% general population sample). This makes apps a very resourceful tool with many benefits and little need for monetary investment or need to teach how to use it because almost everyone already use it or learn to use it by themselves or through peers interaction. Through the analysis of literature, it can be seen that the most important factor for the use of apps is the mobile device (smartphone, tablet, etc.) that people have (10). Along with that, smartphone nowadays are seen almost as a dress part because people that have it keeps it with them at all time (11). This can be seen in both samples through a great number of high frequent users - 64,9% in medical students and 69,9% in portuguese population. Those findings give support to the premise that this technology might be used in the public healthcare system. This tool was recognized as such a valuable resource by the World Health Organization (WHO) and United Nations (UN) that was created the Global Observatory for eHealth (GOe). The mission of the GOe is to improve health by providing member states with strategic information and guidance on effective practices and standards in eHealth. According to his last survey, the “smartphone applications market phenomena” had a strong impact in many industries. One of these industries is healthcare where it can, not only improve its delivery, but also promote a fast dissemination of medical information (12). This utopia however is still taking its first steps.
For now, the main drivers of development of mHealth apps continue to be commercial companies (13) as it can be seen, for example, through a great bet in the apps about physical exercise (14).
33 This trend can be seen in the responses of both multiple choice questions and open-ended questions, where this kind of mHealth app is the most popular (known and used) in both samples. This tendency, seen not only in this study but also in the bibliography (3,14), may be due to social pressure towards keeping oneself in good physical shape. As these apps turn physical exercise into something more appealing and fun, it can induce/promote exercise. At the same time, it can provide a sense of integration since we keep abreast of the latest technological innovations shared among our peers who have an influence towards starting using apps and what kind of apps are used. One last reason to this subset of mHealth apps being the most used may lie in the large market supply due to not being required great scientific foundations owing to the lack of supervision of such apps (15).
A very interesting note is that the most used mHealth apps about the main causes of death are very different in the medical students sample and in the Portuguese population sample. The students’ sample had a higher usage of these kind of mHealth apps, a broader distribution and the themes most used were about ischemic heart disease and respiratory diseases. This kind of distribution may be due the field of study of this population because medical students need to have a general knowledge about the leading causes of death of the country where they study and this knowledge may be extendable to the preference of mHealth apps used. At the same time, this technology can provide support during the academic path which might lead to a greater awareness, perception and use of it. Mayfield, C. H. et al recommended that educational programs consider the use of mobile technology in some lessons like anatomy laboratory (16). So, it cannot be ruled out the importance that the possible use apps in medical schools as acomplement the training of students.
On the other hand, the general portuguese population sample had fewer responders using this kind of mHealt apps, and a more narrow distribution. The main themes of interest were respiratory diseases, nervous system diseases and ischemic heart diseases. This distribution reflects the main concerns of the population since this diseases have a great morbidity and mortality. The literature review on mHealth apps about the main causes of death points the use of this apps as a useful tool for the prevention and management of diseases that causes high rates of mortality (8). As the majority of the work done is in the commercial field instead of research field (17), the developers focus on typical diseases in high-income countries. So, heart diseases are one of the most researched and with more apps along with HIV/AIDS. The latter not because it is a major cause of death but due to it being a very popular disease in richer countries. On the other hand, lower respiratory infections and diarrheal diseases are among the main causes of death in low-income countries therefore, having much less research and fewer apps (8).
Comparing the level of awareness with any of the independent variables used it was not found a statistical significant relationship (college degree, p=0,230; medical student, p=0,247; age
34 mHealth apps are developed for commercial purposes (8). Thus, as every commercial product, the goal of the developers is to reach every person independently of their level of education making awareness of mHealth apps almost ubiquitous.
Turning the focus of attention to the perception of mHealth apps, a statistical significance with being a medical student (p=0,001) and with the age group below 28 years (p=0,030) and a tendency towards statistical significance with having a college degree (p=0,065) was found. This tendency and the weakness of the other two associations (medical student, phi=0,172; age group, phi=0,133) reveals the need for further study with sample that respects the population characteristics. As stated previously, the goal of the developers is to reach every person as can be seen through the high awareness and perception. However, the perception may be influenced by other factors as surroundings, peers interaction, purchasing power and predisposition to this kind of technology. With a higher level of education a higher salary is expected (18) and thus a higher purchasing power that allows an easier access to the technology needed. It is expected that the peers have a similar condition and thus an easy access to the technology. This together with a slight higher awareness may lead to a much greater perception of mHealth apps in the population with a college degree. Concerning the medical student sample, it is easily understandable that as this apps fall in the field of study and interest of this subpopulation, there will be a natural tendency towards a higher perception of these tools. As to the age group, in the older age groups is seen a lower acceptance towards the use of new technology (19). This lack of acceptance may lead to a lower perception of new technologies and consequently fewer mHealth apps.
Regarding the usage of mHealth apps, it can be seen that the usage of mHealth apps is roughly equal between those with college degree and without (81,2% and 78,8%, respectively) and between medical students and general population (79,4% and 80,4%, respectively) resulting in non-significant tests (p=0,778 and p=0,834, respectively). This indicates the importance of disseminate information about this new tool in the population to further increase his awareness and perception since almost all of those that are aware and have some perception of mHealth apps uses them. At the same time, it also supports the argument of a great cost-benefit ratio in implementing this tool since most of the population already is aware and have some perception of it and therefore can use it more. However, there is a tendency towards statistical significance to a greater use by the age group [23;28[ (p=0,053). Despite the high acceptance of new technologies among the younger age groups, their purchasing power is low due to a low employment rate2. The monetary factor may only be overcome in this age group and, combined with the high acceptance of new technologies, lead to easier access to mobile devices.
35 Focusing in the frequency of high frequent users of mHealth apps, it was not found statistical significance due to a similar frequency of usage between those with a college degree an those without (69,6% and 73,1%, respectively)(p=0,750) and between medical students and general population (68,5% and 70,7%, respectively)(p=0,718). In the case of age groups, it was also not found statistical significance (p=0,274) despite a greater number of high frequent users in the age group [23;28[. One might think that from the point where the smartphone is brought (main driver to the usage of mHealth apps) (10) people tend to keep it all the time with them leading to a high frequency of high frequent users (11). As this phenomenon cuts across all users (independently of level of education, age group and area of expertise) the frequency of use would not be influenced by those variables. Nevertheless, the greater high frequent users in the age group [23;28[ may be due the slight impact of high acceptance of this technology and increased purchase power which leads to a much important variable that is own a smartphone.
Finally, through statistical analysis it was not found a statistical significance between the use of mHealth apps about the main causes of death and having a college degree (p=0,196) or age groups (p=0,223). Still, a statistical significance with being a medical student (p=0,019) was found. Although there was a high awareness, perception and usage of mHealth apps, very few people uses mHealth apps about the main causes of death. This may be due a lack of awareness and/or perception of this subset of mHealth app. However, the large discrepancy between usage of mHealth app and usage of this subset of mHealth apps raises the possibility of the questionnaire not being clear and/or the responder not being conversant with the topic. This possibility is also supported by literature where, among those with a smartphone, there is a high acceptance and dissemination of health programs that are based on mHealth apps (20). This highlights the importance of this tool because it has a well-documented potential (5–7), the patients have an overall positive attitude towards it (21) and feel comfortable using it (22). Despite all of this, similarly to the perception of mHealth apps, this subset of mHealth apps are the main study focus of the medical student population and so, naturally, they feature a high frequency of users. However, this statistical significance is undermined by a low strength (phi=0,144) so, more studies are needed to ascertain the nature of this relationship.
36
Conclusion
Some of the conclusions of this study can be seen in the poster presented in the International Work-Conference on Bioinformatics and Biomedical Engineering 2015.
This study highlights some relevant questions not only about the awareness, perception and use of mHealth apps but also some applications of this technology in the medical practice.
Despite slight variations, a high awareness, perception and usage of mHealth apps independently of the sample was observed. The frequency of usage was also very high and it is though that the most important factor might be the mobile device, as seen in the available bibliography.
From the data collected, and review of the literature, it is clear that mHealth apps have a great applicability in the National Health System. It has a very good starting point with great awareness, perception and use by population and promising results so far taking into account the bibliography. Further studies must be done to assess the cost-effectiveness of these tools. On the other hand, this technology might be a potential learning platform in the medical schools as some data of this study as well as the review of literature points out.
It was visible that those with a smartphone have a high awareness, perception and usage of mHealth apps. It can be considered that possessing a smartphone is the key element to the use of those tools and therefor if their use in the population is a possibility to be considered, this must be taken into account.
The most popular mHealth app, in the literature and in this study, continues to be those concerning about physical activity. This reveals not only the result of social pressure to keep fit but also the work of commercial companies in the development of apps. It is this investment in this technology that needs to be done so it can be spread to the people becoming a new vehicle of care.
Despite all these benefits it seems that older age groups have some reluctance in using apps. This might compromise its use in these age groups and a different approach must be designed. Perhaps the adaptation of existing apps to the age group or use support might dissolve this reluctance.
In the data collected, a decline from the use of mHealth apps to the mHealth apps about the main causes of death was noted. This might be due to some limitations of this study, and despite the fact that some bibliography defies these results, this must not be taken lightly.
37 Since these mHealth apps can be presented as an added value in the prevention and management of the leading causes of death, this possibility opens a window of intervention by the national health system in an effort to increase the use of this subset of mHealth apps. Further studies are needed to unveil the real nature of this variable.
38
References
1. Bradway M, Årsand E, Grøttland A. Mobile Health: empowering patients and driving change. Trends Endocrinol Metab [Internet]. 2015;26(3):114–7. Available from: http://linkinghub.elsevier.com/retrieve/pii/S1043276015000028
2. Vishwanath S, Vaidya K, Nawal R, Parthasarathy S, Verma S. Touching lives through mobile health-Assessment of the global market opportunity. PwC, GSMA. India; 2012. 3. Sama PR, Eapen ZJ, Weinfurt KP, Shah BR, Schulman KA. An evaluation of mobile
health application tools. JMIR mHealth uHealth [Internet]. 2014;2(2):e19. Available from: http://mhealth.jmir.org/2014/2/e19/
4. World Health Organization. mHealth: New horizons for health through mobile
technologies [Internet]. Global Observatory for eHealth series. 2011. Available from: http://www.who.int/goe/publications/goe_mhealth_web.pdf
5. Logan AG. Transforming hypertension management using mobile health technology for telemonitoring and self-care support. Can J Cardiol. 2013;29(5):579–85.
6. Tamrat T, Kachnowski S. Special delivery: An analysis of mhealth in maternal and newborn health programs and their outcomes around the world. Matern Child Health J. 2012;16(5):1092–101.
7. Rajan SP, Rajamony S. Viable investigations and real-time recitation of enhanced ECG-based cardiac telemonitoring system for homecare applications: a systematic
evaluation. Telemed J E Heal [Internet]. 2013;19(4):278–86. Available from: http://online.liebertpub.com/doi/abs/10.1089/tmj.2012.0180
8. Martínez-Pérez B, De La Torre-Díez I, López-Coronado M, Sainz-De-Abajo B.
Comparison of mobile apps for the leading causes of death among different income zones: a review of the literature and app stores. J Med Internet Res. 2014;16(1):1–16. 9. Pestana MH, Gageiro JN. Análise de Dados para Ciências Sociais – a
complementariedade do SPSS. 6a ed. Robalo M, editor. Lisboa-Portugal: Edições Sílabo; 2014.
10. research2guidance. Mobile Health Market Report 2013-2017. 2012.
11. DiFilippo KN, Huang W-H, Andrade JE, Chapman-Novakofski KM. The use of mobile apps to improve nutrition outcomes: a systematic literature review. J Telemed Telecare [Internet]. 2015;0(0):1–11. Available from:
http://jtt.sagepub.com/lookup/doi/10.1177/1357633X15572203
12. Choi W, Park MA, Hong E, Kim S, Ahn R, Hong J, et al. Development of mobile
electronic health records application in a secondary general hospital in Korea. Healthc Inform Res. 2013;19(4):307–13.
13. De La Vega R, Miró J. mHealth: a strategic field without a solid scientific soul. A systematic review of pain-related apps. PLoS One. 2014;9(7).
14. Becker S, Miron-Shatz T, Schumacher N, Krocza J, Diamantidis C, Albrecht U-V. mHealth 2.0: experiences, possibilities, and perspectives. JMIR mHealth uHealth [Internet]. 2014;2(2):e24. Available from:
39 http://www.pubmedcentral.nih.gov/articlerender.fcgi?artid=4114478&tool=pmcentrez &rendertype=abstract
15. Shankar R, Prasad S, Bharti A, Talwar A, Jain N. Socio-economic impact of mHealth: an assessment report for the European Union. 2013.
16. Mayfield CH, Ohara PT, O’Sullivan PS. Perceptions of a mobile technology on learning strategies in the anatomy laboratory. Anat Sci Educ. 2013;6(2):81–9.
17. Martínez-Pérez B, De La Torre-Díez I, López-Coronado M. Mobile health applications for the most prevalent conditions by the world health organization: Review and analysis. Journal of Medical Internet Research. 2013.
18. Balassiano M, Seabra AA De, Lemos AH. Escolaridade, salários e empregabilidade: tem razão a teoria do capital humano? Rev Adm Contemp. 2005;9(4):31–52.
19. Arning K, Ziefle M. Understanding age differences in PDA acceptance and performance. Comput Human Behav. 2007;23(6):2904–27.
20. Bonome KADS, Santo CC Di, Prado CS, Sousa FS, Pisa IT. Disseminação do uso de aplicativos móveis na atenção à saúde. XIII Congr Bras em Informática em Saúde [Internet]. 2012; Available from: http://www.sbis.org.br/cbis2012/arquivos/807.pdf 21. Engel H, Huang JJ, Tsao CK, Lin CY, Chou PY, Brey EM, et al. Remote real-time
monitoring of free flaps via smartphone photography and 3G wireless internet: a prospective study evidencing diagnostic accuracy. Microsurgery. 2011;31(8):589–95. 22. Bravo C, O’Donoghue C, Kaplan CP, Luce J, Ozanne E. Can mHealth improve risk
assessment in underserved populations? Acceptability of a breast health questionnaire app in ethnically diverse, older, low-income women. J Health Dispar Res Pract. 2014;7(4):997–1003.
40