Telma Lúcia Pereira dos Santos Coelho
Trophic connectivity in coastal habitats
supporting fishery species
Universidade do Algarve
Faculdade de Ciências e Tecnologia
This dissertation is submitted to the University of Algarve, for the degree of Doctor of Philosophy, in Sciences of Sea, Earth and Environment, area Marine Sciences, specialization Marine Ecology
Supervisors: Prof. Luís Chícharo Prof. Colin Moffat Dr. Miguel Gaspar
Telma Lúcia Pereira dos Santos Coelho
Trophic connectivity in coastal habitats
supporting fishery species
Universidade do Algarve
Faculdade de Ciências e Tecnologia
i
Declaração da autoria do trabalho
Tese:
Trophic connectivity in coastal
habitats supporting fishery species
Declaro ser a autora deste trabalho, que é original e inédito. Autores e trabalhos consultados estão devidamente citados no texto e constam da listagem de referências incluídas.
© Copyright: Telma Coelho
A Universidade do Algarve reserva para si o direito, em conformidade com o disposto no Código do Direito de Autor e dos Direitos Conexos, de arquivar, reproduzir e publicar a obra, independentemente do meio utilizado, bem como de a divulgar através de repositórios científicos e de admitir a sua cópia e distribuição para fins meramente educacionais ou de investigação e não comerciais conquanto seja dado o devido crédito ao autor e editor respetivos.
ii
Apoio
A presente tese teve o apoio da Fundação para a Ciência e Tecnologia (FCT) através da bolsa SFRH/BD/44532/2008 em colaboração com a Instituição Marine Scotland
Science, Aberdeen, Scotland.
iii
Support
This thesis was funded by Portuguese Science Foundation (FCT) through the doctoral grant SFRH/BD/44532/2008 in cooperation with Marine Scotland Science, Aberdeen, Scotland.
iv
Acknowledgments
I would like to special thank Prof. Luís Chícharo for all his support in this PhD, comments and revision. I special recognize Dr. Miguel Gaspar for the comments, revision and discussion of topics. I also extend my gratitude to Prof. Colin Moffat for his time, comments, revision and discussions and shared knowledge at the Marine Scotland Science.
I thank all the people at the Marine Scotland Science who were involved in the biochemical analysis, especially: Pamela Walsham and Jean-Pierre Lacaze.
I would like to thank Dr. Domitília Matias at IPMA, Tavira for her help in the development of experimental studies with bivalves.
I thank Carlos Sonderblohm and Mestres Zé Maria and Isaltino and fishers from the boats for their participation in the octopus sampling; and Mestre Antero for the Guadiana fisheries.
I thank to my family for taking care of my kids while I was away in Aberdeen, and when recovering from several health issues, and in the many days of the writing and re-writing.
I thank Bjoern Brodherr, a tough friend throughout this thesis. I thank Carlos for his dark humor and shared knowledge at L20.
I thank Rodrigo, Rodolfo, Nelson S., João L. and Nuno S. for brainstorming and enlightenment.
I thank my field sampling partner, TobyWan (Tobias).
To Mafalda and Lucas, mission I’Mpossible
v
Abstract
The transfer of production along coastal habitats from migration of organisms and natural or anthropogenically caused environmental conditions create complex food webs between habitats.
A species is rarely independent from the resources of other habitats as nutrients and food supply flow easily in the aquatic environment developing strong habitat connections between food webs. These multiple trophic interactions are very susceptible to variability in the environmental conditions of the habitat that supplies the energy source. All this justifies additional investigation on coastal habitat specific food webs interactions and key energetic connections that extent from primary producers to top consumers.
Given the easy access and importance to achieve sustainability of species and their supporting habitats, explicitly for fisheries species that maintain local economy, this thesis aims to study energy sources, prey and consumers that transcend habitats in the eastern Algarve coastal area.
A General Introduction highlights the functioning of coastal food webs and the flow of nutrients and food with the movement of organisms between distinct habitats in the coastal area. The constant changes in the coastal landscape and the variability in environmental conditions create a knowledge gap in the functional role of different habitats in the complex web of coastal trophic interactions and secondary production that support coastal fisheries. Temporal and spatial variability in trophodynamics of fisheries species was performed with trophic markers: fatty acids and stable isotopes. These biomarkers determine the importance of the outwelling of terrestrial organic
vi
matter in trophic webs of adjacent coastal habitats and if movement of consumers results in the transfer of energy sources between habitats.
This introduction describes the most relevant aspects in trophic markers biochemistry and applications in ecology and detailed analytical procedures for the following chapters, as well as quality control of analysis. Applications in ecological studies are exemplified from the identification of energy sources, including terrestrial organic matter, microphytobenthos and different groups of phytoplankton that support the food webs of a wide variety of aquatic consumers.
Chapter 2 demonstrates how the wide range of primary producers and energy sources is reflected in the diet of coastal fish, estuarine fish and offshore fish. The relative contribution of energy sources determined the importance of upriver foraging behavior of marine fish for the transport of marine production upriver and the importance of the estuarine environment as feeding ground for coastal fishes. Estuary primary producers and vascular plants were recognized as a potential source of energy for mid estuary fishes against marine phytoplankton and microphytobenthos for coastal fishes.
Chapter 3 describes the role of terrestrial organic matter as energetic source for fish food webs in the estuary and adjacent coastal area. Organic detrital material of terrestrial origin flows in rivers towards coastal areas in a dynamic and continuous process but nevertheless it had a minor role in this connectivity between the estuarine and coastal trophic webs.
Chapter 4 evaluates several tissues of a cephalopod from the benthic coastal environment to define inter-tissue comparisons. Tissues with the same function represented the trophic markers in similar proportions and were ineffective to determine temporal and spatial diet variability. Mantle and digestive gland were the chosen tissues for the sequent analyses.
Chapter 5 demonstrates the main sources of nutrition in the diet of Octopus vulgaris from the coastal benthic environment. Here are described potential trophic pathways to other habitats, including the role of terrestrial production. This chapter explains the
vii
temporal variability in the contribution of the different production sources for the octopus food web in the area of the fishery and demonstrates octopuses depend mainly on local primary sources. The trophic markers supported a trophic web based in dinoflagellate production in the marine environment.
Chapter 6 shows the feeding behavior of the cephalopod O. vulgaris towards the input of allochthonous prey and how human interactions create a trophic coupling between the benthic and pelagic environment. The opportunistic behavior of this cephalopod was demonstrated for a food resource absent from the natural diet.
Chapter 7 is the general discussion from the overall results and conclusions of the case studies in this thesis under the subject of habitat trophic connectivity of coastal fishery species. Pros and cons of the chosen techniques are discussed as well as issues arising from the sample sizes and pooling of samples. Further research and techniques will improve studies on trophic dynamics and connectivity in these ecologically and economically important benthic habitats.
Keywords: coastal benthic trophic web, estuary, fish, Octopus vulgaris, diet variability, trophic markers, fatty acids, stable isotopes, terrestrial organic matter, allochthonous energy sources, primary producers.
viii
Sumário estendido
A transferência de produtividade ao longo de habitats costeiros através da migração de organismos e das condições ambientais naturais ou de origem antropogénica, desenvolvem redes tróficas complexas entre habitats.
Uma espécie é raramente independente dos recursos de outros habitats, pois o fluxo de nutrientes e alimento é constante no meio aquático o que origina fortes ligações entre redes tróficas. Estas múltiplas interações tróficas são suscetíveis à variabilidade nas condições ambientais do habitat que providencia a fonte energética. Estes factos justificam um maior desenvolvimento na investigação de interação entre redes tróficas de diferentes habitats costeiros e de ligações energéticas chave com efeito dos produtores primários até aos consumidores de topo.
O acesso fácil e a elevada importância para a sustentabilidade das espécies e dos seus habitats, especificamente devido à economia pesqueira local, fundamentam esta tese sobre as fontes de energia, presas e consumidores que ultrapassam diversos habitats costeiros na região este do Algarve.
Um Introdução Geral explica o funcionamento das redes tróficas costeiras no âmbito do fluxo de nutrientes e alimento com o movimento de organismos entre habitats distintos ao longo da zona costeira. As constantes alterações na paisagem e a variabilidade das condições ambientais provocam uma lacuna no conhecimento acerca dos diferentes habitats na rede complexa de interações tróficas na zona costeira e na produção secundária que sustenta as pescas costeiras. A variabilidade temporal e espacial na dinâmica trófica de espécies piscatórias foi realizada com marcadores tróficos: ácidos gordos e isótopos estáveis. Estes biomarcadores determinam a importância da exportação de matéria orgânica terrestre através dos rios em habitas costeiros e determinam se o movimento de consumidores resulta na transferência de energia entre habitats.
Esta introdução descreve os aspetos mais relevantes na bioquímica dos marcadores tróficos e exemplifica a aplicabilidade em ecologia e os procedimentos analíticos
ix
detalhados para os capítulos seguintes, tal como o controlo de qualidade nas análises. São exemplificados estudos de fontes energéticas, incluindo de origem terrestre, microfitobentos e diversos grupos de fitoplâncton que sustentam cadeias tróficas de vários consumidores aquáticos.
O capítulo 2 demonstra como uma grande variedade de produtores primários e fontes energéticas é refletida na dieta de peixes costeiros e estuarinos. A contribuição relativa das fontes de energia nos peixes no estuário determinou a importância do movimento dos peixes costeiros para montante no transporte da produção marinha para o estuário e da importância do estuário como local de alimentação. Produtores primários estuarinos e plantas vasculares foram reconhecidos como fontes de energia para a cadeia trófica dos peixes no estuário médio, enquanto fitoplâncton marinho e microfitobentos foram as fontes energéticas mais importantes para os peixes no baixo estuário e zona costeira.
O capítulo 3 descreve o papel da matéria orgânica de origem terrestre como fonte energética para peixes no estuário e na zona costeira adjacente. Os detritos de origem terrestre fluem nos rios em direção ao mar num processo dinâmico e contínuo mas no entanto o seu papel foi secundário na conectividade entre as redes tróficas de peixes na zona estuarina e costeira.
O capítulo 4 avalia diversos tecidos de um cefalópode da zona bentónica costeira com o objetivo de definir comparações sequentes entre tecidos. Tecidos com a mesma função representaram marcadores tróficos em proporções similares e a sua comparação é ineficaz para determinar variabilidade na dieta na escala temporal e espacial.
O capítulo 5 demonstra as principais fontes de nutrição na dieta do Octopus vulgaris da zona bentónica costeira. Aqui são descritas potenciais ligações tróficas a outros habitats, incluindo a importância de matéria orgânica de produção terrestre. Este capítulo explica a variabilidade temporal da contribuição de fontes de energia com origem distinta para a rede trófica do polvo na área da sua pesca e demonstra que os polvos dependem principalmente de fontes de produção primária locais. Os
x
marcadores tróficos confirmam que esta rede trófica tem como base dinoflagelados marinhos.
O capítulo 6 mostra o comportamento alimentar do polvo O. vulgaris em relação à importação de alimento de um ambiente distinto e o potencial das atividades humanas para criar ligações tróficas entre o ambiente pelágico e bentónico. O comportamento oportunístico alimentar deste cefalópode foi demonstrado pela facilidade com que ingeriu uma presa ausente da sua dieta natural.
O capítulo 7 é uma discussão geral dos resultados principais e das conclusões dos estudos efetuados nesta tese sob o tema da conetividade trófica de habitats de espécies costeiras com interesse piscatório. Pros e contras das técnicas utilizadas são discutidas, tal como questões derivadas das amostragens, número e pool de amostras. Novas investigações e técnicas melhoram os estudos de dinâmica trófica e das ligações tróficas entre habitats de espécies importantes em termos ecológicos e económicos Palavras-chave: rede trófica bentónica costeira, estuário, peixe, Octopus vulgaris, variabilidade na dieta, marcadores tróficos, ácidos gordos, isótopos estáveis, matéria orgânica terrestre, fontes energéticas alóctones, produtores primários.
xi
Thesis structure
This PhD thesis consists of a general introduction on the importance of energy sources to connect habitats of several coastal fishery species and include the description of the trophic markers and the techniques chosen for the analyses. Two chapters follow this introduction with the objectives to determine the main sources of energy for fishes in an estuary and adjacent coastal waters, connectivity between these habitats and food dependence on local resources.
Chapter 2 determines the base of the food web of fishes in the estuary and the importance of movement of fish in the estuary transfer of energy and habitat connectivity between the estuarine and coastal environment. Chapter 3 discusses the importance of an abundant source of organic matter - terrestrial organic matter – on the trophic web of fishes in the estuary and coastal waters and how the terrestrial environment is connected to the estuarine and marine environment through the fish food web.
Next, an important species for the coastal fisheries, Octopus vulgaris is studied in three chapters for diet variability, energy sources for the trophic web and influence of human activities in food supply and potential effects on distant habitat connectivity. Chapter 4 and Chapter 5 aim to evaluate tissue comparison to study diet variability and determine diet shifts and variability at the base of the trophic web. Allochthonous sources of primary producers will indicate a trophic connectivity to other habitats. Chapter 6 demonstrates how an artificial link between distant habitats is created by human activities. The opportunistic feeding behavior of the cephalopod is explored by the use of allochthonous prey that creates a distant habitat coupling. The immediate consumption of this type of prey despite the unavailability in the natural diet supports the feeding behavior characteristic of this species.
The last chapter of this thesis, the General Discussion, shows how trophic webs in several species in coastal ecosystems are affected by diet variability and sources of
xii
energy at the base of the trophic web and the potential of environmental conditions and anthropogenic activities on trophic connectivity between habitats. The analyses of these diet adjustments to environmental conditions or new supply of food are quickly obtained by the combination of trophic markers and inter-tissue comparisons. This purpose to define important trophic links between habitats of fisheries species will result on predictions of species sustainability and coastal productivity.
xiii
Table of contents
1 General Introduction ... 1-21 1.1 Trophic markers ... 1-25 1.1.1 Fatty acids ... 1-25 1.1.1.1 Introduction... 1-25 1.1.1.2 Fatty acid nomenclature and biochemistry ... 1-25 1.1.1.3 Fatty Acids Analysis ... 1-29 1.1.1.3.1 Extraction of lipids from samples ... 1-29 1.1.1.3.2 Reagents ... 1-30 1.1.1.3.3 Reference materials ... 1-30 1.1.1.4 Lipid class analysis by thin layer chromatography (TLC) ... 1-32 1.1.1.4.1 Reagents ... 1-32 1.1.1.4.2 Solvent system preparation and plate development ... 1-32 1.1.1.4.3 Trans-esterification of lipids extracts from fish and cephalopod tissues .. 1-341.1.1.5 Determination of fatty acids from sample tissues with GC-FID ... 1-35 1.1.1.6 Confirmation of FAME identification by GC-MS ... 1-36 1.1.1.7 Material Quality Control... 1-37 1.1.1.7.1 Peak identification, quantitation and quality control ... 1-38 1.1.1.7.2 Shewart charts - quality control ... 1-38
1.1.2 Stable Isotopes ... 1-43
1.1.2.1 Introduction... 1-43 1.1.2.2 Isotope Chemistry and Terminology ... 1-44 1.1.2.3 Trophic level ... 1-45 1.1.2.4 Isotopic discrimination or fractionation ... 1-45 1.1.2.5 Tissue turnover ... 1-46 1.1.2.6 Carbon ... 1-47 1.1.2.7 Nitrogen... 1-47 1.1.2.8 Stable Isotope Applications in Ecology ... 1-48 1.1.2.9 Stable Isotope Analysis ... 1-48
xiv
1.1.3 Data treatment ... 1-49 2 Diet shifts and importance of terrestrial organic material for fish food webs .... 2-50 2.1 Abstract ... 2-50 2.2 Introduction ... 2-51 2.3 Materials and methods ... 2-54 2.3.1 Study site ... 2-54 2.3.2 Sample collection... 2-56
2.3.2.1 Organic matter ... 2-56 2.3.2.2 Fish samples ... 2-57
2.3.3 Sample analyses... 2-57
2.3.3.1 Fatty acids analyses ... 2-57 2.3.3.2 Stable isotopes analyses... 2-59
2.3.4 Statistical analysis ... 2-61 2.4 Results ... 2-62 2.4.1 Sample composition ... 2-62 2.4.2 Fatty Acid composition in fish liver and fish muscle ... 2-63 2.4.3 Stable isotope composition analysis in fish liver and fish muscle ... 2-67 2.4.4 Correlations for FATM and SI for fish liver and fish muscle ... 2-70 2.5 Discussion ... 2-70 3 Terrestrial organic matter input in coastal fish food web ... 3-77 3.1 Abstract ... 3-77 3.2 Introduction ... 3-78 3.3 Materials and methods ... 3-81 3.3.1 Study site ... 3-81 3.3.2 Sample collection... 3-83
3.3.2.1 Organic matter ... 3-83 3.3.2.2 Fish samples ... 3-84
3.3.3 Sample analyses... 3-84
3.3.3.1 Fatty acids analyses ... 3-84 3.3.3.2 Stable isotopes analyses... 3-86
3.3.4 Statistical analysis ... 3-87
xv
3.3.4.2 2 Dimension biomarker approach ... 3-88
3.4 Results and Discussion ... 3-89 3.4.1 Fish communities ... 3-89 3.4.2 Fatty acids analysis ... 3-91
3.4.2.1 Multivariate analysis of fatty acids composition... 3-95
3.4.3 Stable isotope analysis ... 3-96
3.4.3.1 Nitrogen fish isotope values ... 3-96
3.4.4 Terrestrial nutrition sources for fish ... 3-97 3.4.5 2 Dimension biomarker approach ... 3-100 3.5 Conclusion ... 3-105 4 Stable isotope from multiple tissues of the cephalopod Octopus vulgaris:
delipidification implication ... 4-107 4.1 Abstract ... 4-107 4.2 Introduction ... 4-108 4.3 Materials and methods ... 4-109 4.3.1 Stable isotopes analyses ... 4-109 4.3.2 Statistical analysis ... 4-110 4.4 Results ... 4-111 4.5 Discussion ... 4-113 5 Diet-shift of Octopus vulgaris in the Algarve: an intra and inter-tissue approach .. 5-116
5.1 Abstract ... 5-116 5.2 Introduction ... 5-117 5.3 Materials and methods ... 5-120 5.3.1 Study site, sample collection and processing ... 5-120 5.3.2 Sample analyses... 5-121
5.3.2.1 Fatty acids analyses ... 5-121 5.3.2.2 Stable isotopes analyses, δ15N and δ13C ... 5-122 5.3.2.3 Statistical analysis ... 5-122
5.4 Results ... 5-123 Fatty acid signatures of tissues from O. vulgaris ... 5-123 5.4.1 ... 5-123
xvi
Isotopic signature of O. vulgaris tissues ... 5-127 5.5 Discussion ... 5-129 5.5.1 Energy sources in Octopus vulgaris trophic web... 5-129 5.5.2 Temporal and spatial diet shifts in Octopus vulgaris ... 5-130 5.6 Concluding remarks ... 5-134 6 Pelagic bait as food supply to a benthic consumer ... 6-136 6.1 Abstract ... 6-136 6.2 Introduction ... 6-137 6.3 Materials and methods ... 6-139 6.3.1 Fishing ground and sampling ... 6-139 6.3.2 Sample analyses... 6-140
6.3.2.1 Sample processing and sampling ... 6-140 6.3.2.2 Fatty acids analyses ... 6-140 6.3.2.3 Stable isotopes analyses... 6-141
6.3.3 Statistical analysis ... 6-142 6.4 Results ... 6-142 6.4.1 Fatty acid composition ... 6-142 6.4.2 Stable isotope composition ... 6-146 6.5 Discussion ... 6-147 7 General Discussion ... 7-151 8 References ... 8-159
xvii
List of Figures
Figure 1.1.1 TLC plate developed for seabream, Argyrosomus regius. The presence of methyl esters is evident from the comparison of lipid classes from the solutions of other lipid standards. ... 1-34 Figure 2.3.1 Map of fish sampling sites in the Guadiana estuary, offshore the river plume and in the coast (adapted from Domingues et al. 2011). ... 2-55 Figure 2.4.1 Intraspecific differences in Fatty Acid Trophic Markers (FATM) ratios of dietary quality in fish from the Guadiana lower and mid estuary and Offshore. Boxplots represent the mean ± 1SD and whiskers represent the max and min values. ... 2-65 Figure 2.4.2 Intraspecific differences in Fatty Acid Trophic Markers (FATM) of dietary quality in fish from the Guadiana lower and mid estuary and Offshore. Boxplots represent the mean ± 1SD and whiskers represent the max and min values. ... 2-66 Figure 2.4.3 Intraspecific differences in δ15N of dietary quality in fish from the Guadiana Lower and Mid estuary and Offshore represented by boxplots... 2-67 Figure 2.4.4 Intraspecific differences in δ13C of dietary quality in fish from the Guadiana Lower and Mid estuary and Offshore represented by boxplots... 2-68 Figure 2.4.5 Spatial comparison of fish tissues stable isotopes of δ15N and δ13C by species. Arrows point from fish muscle to fish liver. Arrows linetype: --- Mid estuary sampling location; .... Lower estuary sampling location; - - - Offshore sampling location. ... 2-69 Figure 3.3.1 Map of the sampling sites for POM and fish in the Guadiana estuary, coast and in offshore the river plume (adapted from Domingues et al. 2011)). ... 3-82 Figure 3.4.1 Major fatty acids of fish muscle. Selected fatty acids represented concentrations higher than 10% or relevant for terrestrial input assessment. Data were expressed as mean of normalized area percentage(%)+ standard error. ... 3-93 Figure 3.4.2 Boxplots represented FAME normalized percentage area in samples of muscle tissue of fish (n=27) captured in the Guadiana Mid Estuary, Lower Estuary and Offshore. Points represented
normalized percentage area of samples of Sediment Organic Matter (SOM) and Suspended Particulate Organic Matter (POM) in the Upper, Mid and Lower estuary and at the Beach (Praia Verde Beach, 7 km east from the River mouth) for all sampling occasions. (Fame uncertainty calculated are asterisked).. 3-94 Figure 3.4.3 Principal component analysis of fatty acid composition (normalized percentage area) of fish muscle (n=27) constrained to sites of fish sampling in Guadiana Mid Estuary and Lower Estuary and Offshore. ... 3-95 Figure 3.4.4 Boxplots of δ15N of fish muscle from Guadiana Mid estuary, Lower estuary and Offshore. ... 3-97
Figure 3.4.5 Boxplots of δ13C of fish muscle from Guadiana Mid estuary, Lower estuary and Offshore. ... 3-98
Figure 3.4.6 δ15N versus δ13C for muscle tissue of fish captured in Mid estuary, Lower estuary and Offshore. ... 3-99
xviii
Figure 3.4.7 δ15N versus bioindicator of terrestrial organic matter in diet (18:2(n-6)+18:3(n-3)) in fish tissues.} ... 3-101 Figure 3.4.8 δ13C versus bioindicator of terrestrial organic matter in diet (18:2(n-6)+18:3(n-3)) in fish tissues. ... 3-102 Figure 3.4.9 δ15N versus bioindicator of carnivorous diet or input of brown algae (normalized area of 18:1(n-9)) in fish tissues. ... 3-103 Figure 3.4.10 δ13C versus bioindicator of carnivorous diet (normalized area of 18:1(n-9)) in fish tissues. 3-104
Figure 4.4.1 Boxplots of δ13C isotopic signatures for tissues of O. vulgaris (DigGland: digestive gland, Mantle: mantle, Tentacle: tentacle) conditional on treatment delipidification for tissues digestive gland and mantle (del: delipidified; nondel: non-delipidified). ... 4-112 Figure 4.4.2 Boxplots of δ15N isotopic signatures for tissues of O. vulgaris (DigGland: digestive gland, Mantle: mantle, Tentacle: tentacle) conditional on treatment delipidification for tissues digestive gland and mantle (del: delipidified; nondel: non-delipidified). ... 4-113 Figure 5.3.1 Map of the fishing harbor in Tavira and the replicate fishing trajectory (hollow
squares),parallel to the coastline, adapted from Sonderblohm (2015). ... 5-120 Figure 5.4.1 Boxplots of the normalized area percent of the specific fatty acids and associated fatty acid trophic markers for mantle tissue (white) and digestive gland (black) of O. vulgaris. ... 5-126 Figure 5.4.2 δ15N versus δ13C for digestive gland and mantle tissues of O. vulgaris. The black line
represents the digestive gland isotopic values smoothed line and shows a relatively small increase in the δ15N with an increase in the δ13C isotopic values (open circles). The dotted line represents mantle isotopic values smoothed line. This emphasizes that there is an high increase in the isotopic values of δ15N with an increase in the isotopic values of δ13C (black squares). Each data point is an individual analysis. ... 5-128 Figure 6.3.1 Map of octopus sampling sites along the coastline in the fishing ground, adapted from Sonderblohm (2015). ... 6-139 Figure 6.4.1 Boxplots of Fatty Acid Trophic Markers of Octopus vulgaris in the Mantle (grey) and
Digestive Gland (white) tissues and the Stomach contents (black). Data are expressed as normalized area percentage... 6-143 Figure 6.4.2 Fatty Acid Trophic Markers expressed as normalized areas percentage of fish bait used in the O. vulgaris fishery: Trachurus trachurus (triangles) and Scomber sp. (circles). ... 6-145 Figure 6.4.3 Boxplots of δ15N values of digestive gland tissue, stomach contents, mantle tissue of O.
vulgaris and fish white muscle tissue used as bait in traps (n=6) (e.g. Trachurus trachurus, Scomber sp.).
Statistical differences: p<0.00001: Digestive gland-Mantle; Guta-Mantle; n.s. Digestive Gland-Guta; Guta- Muscleb; Mantle- Muscleb; Digestive Gland-Muscleb. asame as stomach contents, bfish bait muscle. . 6-146 Figure 6.4.4 Boxplots of δ13C values of digestive gland tissue, gut contents, mantle tissue of O. vulgaris and fish white muscle tissue used as bait in traps (n=6) (e.g. Trachurus trachurus, Scomber sp.).
xix
Statistical differences: p<0.00001: Digestive gland-Mantle; Guta-Mantle; Mantle-Muscleb; n.s. Digestive Gland-Guta; Guta-Muscleb; Digestive Gland-Muscleb. asame as stomach contents, bfish bait muscle. . 6-147
xx
List of Tables
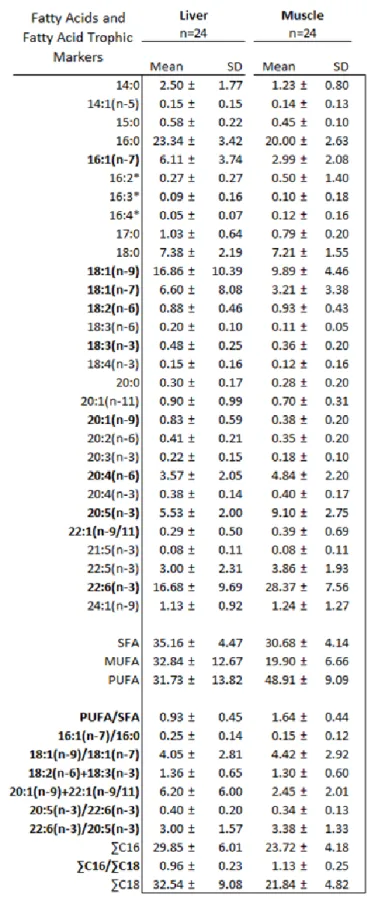
Table 1.1.1 Nomenclature of the most representative fatty acids in lipids of fish muscle and liver. ... 1-26 Table 2.4.2 FAME components ±1SD in fish liver and fish muscle for overall samples. Data were
expressed as normalized percentages (those without uncertainty calculated are asterisked). ... 2-64 Table 3.4.1 Summary of fish samples analyzed from the catches in the Mid and Lower Guadiana estuary and from Offshore commercial catches. The letter X represented one sample, with a single individual or a pool of individuals with the same size (n=2 or n=3) for each species, per year and estuary sampling location. ... 3-90 Table 3.4.2 FAME components ±1SD in fish muscle captured at Mid and Lower Estuary sections of the Guadiana and Offshore. Data were expressed as normalized percentages (those without uncertainty calculated are asterisked). ... 3-92 Table 4.4.1 Pairwise t-test for the treatment delipidification of tissues (digestive gland, mantle) for the cephalopod O. vulgaris in the δ15N and δ13C isotopic signatures. Means and SD of δ15N and δ13C values are represented for each tissue and treatment. ... 4-111
1-21
1
General Introduction
Coastal ecosystems have typically diverse habitats with functional roles that include feeding and protection for species. High productivity and biodiversity is strongly dependent on landscape and environmental conditions for the production and flow of energy, community structure and trophic dynamics (Abrantes et al. 2015).
The multiple trophic interactions between nutrients, food and consumers within and across habitats affect the whole ecosystem (Abrantes et al. 2015) and the production and origin of energy with distinct quality and quantity from habitats with different functional roles are still not well understood for the trophic dynamics of coastal fishery species. Habitat trophic connectivity depends on the distance between habitats, relative productivity, mobility of consumers (Polis et al. 1997), prey availability, life strategy of organisms (Doucett et al. 1996, Kimmerer 2002, Vinagre et al. 2008) and foraging behavior across habitats (Kirsch et al. 1998a).
The complex food webs that connect the pelagic-benthic and land-ocean environments and their dynamics is highly coupled to spatial and temporal variability in environmental conditions and energy sources and require research (Budge et al. 2002, Deudero et al. 2004, Sherwood and Rose 2005, Carlier et al. 2007, Petursdottir et al. 2008, Polis and Strong 2009) to set priorities in habitat conservation and rehabilitation and coastal fisheries management (Doucett et al. 1996, Kirsch et al. 1998, Kimmerer 2002, Vinagre et al. 2008).
Nutrient input is a major factor in trophic webs of coastal areas to stimulate phytoplankton production and define the dominant group that fuels the food web. Any modification in the nutrients supplied to primary producers is transferred to higher trophic levels and ultimately affects secondary productivity and biodiversity. The input of particulate organic material derived from land or estuaries to the coastal benthic environment may greatly exceed in situ production to support the community (Polis et
1-22
al. 1997, Riera and Richard 1997, Kang et al. 2008, Schlacher et al. 2008, Kostecki et al. 2010) and is strongly affected by inland or coastal human activities (Connolly et al. 2005b, 2009, Darnaude 2005). Terrestrial material affects the supply and flow of nutrients and may have cascading effects on trophic interactions (Deudero et al. 2004). Microalgae, bacteria and macroalgae are the main primary producers with diatoms and dinoflagellates as the major contributors of energy to higher trophic levels via consumption by copepods, larvae and other invertebrates (Riera et al. 1999, Rossi et al. 2006, El-Sabaawi et al. 2009, Lebreton et al. 2011).
Foraging behavior of consumers between habitats and the input of allochthonous prey creates links between distant trophic webs. Migration of coastal fishes upriver link the marine and estuarine environment with possible effects on estuarine key species (Polis et al. 1997) and pelagic organisms used as bait in coastal benthic fisheries may link the pelagic and benthic environments with effects on the predator population and community structure.
A range of methodologies are applied for the study of trophodynamics. Stomach (gut) contents analyses provides short term dietary information but the miscalculation for the contribution of food sources, mainly organisms without hard parts and easily digested is considerable (Sherwood and Rose 2005, Carlier et al. 2007, Petursdottir et al. 2008). The physiological responses from the adaptation of an organism to changes in the food web are explored by the analysis of chemical compounds designated as trophic markers.
Trophic markers accumulate in the tissues of consumers over a certain period of time and reflect those of their food source. This feature allows to determine the pathway of energy through multiple trophic compartments, the primary producers for the food web (Budge et al. 2002, Post 2002, Deudero et al. 2004, Sherwood and Rose 2005, Alfaro 2006, Carlier et al. 2007, Petursdottir et al. 2008) and trophic shifts through inter-tissue comparison (MacNeil et al. 2005, Stowasser et al. 2006).
Fatty acids and stable isotopes, δ15N and δ13C, are commonly used trophic markers and complementary for the analysis of energetic sources to the food web and diet
1-23
variability of consumers (Iverson et al. 2002, Estrada et al. 2005, Melville and Connolly 2005, Budge et al. 2006, Falk-Petersen et al. 2009, Hussey et al. 2011, Stowasser et al. 2012).
The fatty acids and the stable isotopes are quasi perfect trophic markers. A perfect trophic marker is a compound with easily identifiable origin, inert, not selectively processed during food uptake and incorporation, and transferred from one trophic level to the next in a predictable manner (Dalsgaard et al. 2003, de Lange and Van den Brink 2006).
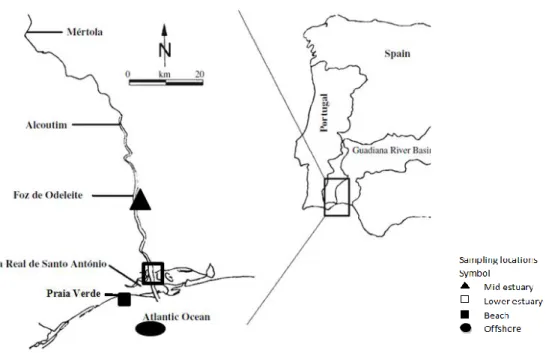
This study focuses on trophic connectivity in benthic coastal habitats and in temporal and spatial variability of sources of energy to species relevant for local fisheries with different features in foraging behavior and supply of food sources. Coastal fishes move across habitats and potentially transfer production through foraging behavior, whereas other benthic species, like the cephalopod Octopus vulgaris, occupies a discrete habitat that provides the resources necessary for the benthic life stage. The thesis aims to answer four main questions: 1) Does foraging behavior of coastal fishes connects the marine and estuarine trophic webs?; 2) What is the importance of the contribution of terrestrial organic matter for coastal fish food webs?; 3) Is there a temporal variability in the exploitation of the resources of the benthic environment from a resident benthic species that avoids competition with conspecifics?; 4) Is the input of an allochthonous prey a potential link between habitats?
These questions are answered in five chapters. Firstly the focus is on some of the most common coastal fish in a habitat that connects the terrestrial and marine environments, an estuary. This is an opportunity to investigate the dynamics of specific trophic connectivity between habitats with different functional roles during spring and early summer and it is expected a recent diet with stronger contribution of estuarine and terrestrial production sources if the movement of fishes to the estuary has feeding purposes.
Then, the study focuses on the variability and importance of energetic sources that sustain the productivity of a coastal benthic cephalopod, in the late spring. The main
1-24
question is on the dietary choices over time of this species. The final case analyzed the opportunistic feeding behavior of this cephalopod towards an allochthonous food source used as bait to benefit fisheries and that is expected to connect energetically different environments if fishing effort increases the amount of input of this bait. This thesis ends with the discussion of the improvements required for future research in dietary analysis variability using trophic markers and with the discussion of the importance to acknowledge habitat connectivity through variability in prey and energy sources, especially for fisheries species that transcend habitats.
1-25
1.1 Trophic markers
1.1.1 Fatty acids
1.1.1.1 Introduction
Fatty acids composition of organic material detail consumer-food relationships. For example, the link of zooplankton, where microalgae are the principal primary producers, to higher order consumers is detected if patterns in fatty acids composition are incorporated and transferred in a conservative way. Organic matter assimilated by organisms from non-living sources, e.g. terrestrial matter, is also detected from the characteristic pattern of the fatty acid composition (Dalsgaard et al. 2003).
1.1.1.2 Fatty acid nomenclature and biochemistry
The abbreviations follow conventional nomenclature (IUPAC-IUB): in the format X:Y(n-z), X refers to the chain length (number of carbon atoms, including the carboxylic acid or alpha carbon), Y refers to the number of carbon-carbon double bonds and z refers to the position of the first carbon-carbon double bond in the molecule relative to the terminal methyl group (carbon number 1 in the n-z system, i.e. omega carbon) (Table 1.1.1).
1-26
Table 1.1.1 Nomenclature of the most representative fatty acids in lipids of fish muscle and liver.
Systematic Name Trivial Name Abbreviation
Saturated
tetradecanoic acid myristic acid 14:0
pentadecanoic acid 15:0
hexadecanoic acid palmitic acid 16:0
heptadecanoic acid margaric acid 17:0
octadecanoic acid stearic acid 18:0
eicosanoic acid arachidic 20:0
Monounsaturated
cis-9-hexadecenoic acid palmitoleic acid 16:1 (n-7)
cis-9-octadecenoic acid oleic acid 18:1 (n-9)
cis-11-octadecenoic acid asclepic acid or cis-vaccenic acid 18:1 (n-7)
cis-9-eicosenoic acid gadoleic acid 20:1 (n-11)
cis-11-eicosenoic acid gondoic acid 20:1 (n-9)
cis-11-docosenoic acid cetoleic acid 22:1 (n-11)
cis-13-docosenoic acid erucic acid 22:1 (n-9)
cis-15-tetraeicosenoic acid nervonic acid 24:1 (n-9) Polyunsaturated
hexadecadienoic acid 16:2*
cis-9,12-octadecadienoic acid linoleic acid 18:2 (n-6)
cis-11,14-eicosadienoic acid 20:2 (n-6)
hexadecatrienoic acid 16:3*
cis-6,9,12-octadecatrienoic acid γ-linolenic acid 18:3 (n-6) cis-9,12,15-octadecatrienoic acid α-linolenic acid 18:3 (n-3)
cis-11,14,17-eicosatrienoic acid 20:3 (n-3)
hexadecatetraenoic acid 16:4*
cis-6,9,12,15-octadecatetraenoic acid stearidonic acid 18:4 (n-3) cis-5,8,11,14-eicosatetraenoic acid arachidonic acid 20:4 (n-6)
cis-8,11,14,17-eicosatetraenoic acid 20:4 (n-3)
cis-5,8,11,14,17-eicosapentaenoic acid timnodonic acid; EPA 20:5 (n-3) cis-6,9,12,15,18-heneicosapentaenoic acid 21:5 (n-3) cis-7,10,13,16,19-docosapentaenoic acid clupanodonic acid 22:5 (n-3) cis-4,7,10,13,16,19-docosahexaenoic acid DHA 22:6 (n-3)
1-27
Fatty acids are the main constituents of acyl lipids, such as triacylglycerols, glycolipids and phospholipids. Algae are the main primary produces of fatty acids in aquatic food webs with 15 to 20 major fatty acids. When ingested by consumers, the fatty acids are released from the backbone molecule (glycerol in the case of triacylglycerols) during digestion and enter the circulation of the consumer intact as free fatty acids. In general, these free fatty acids are transferred to the tissues and not transformed or metabolized. Once taken up by tissues in the consumer, fatty acids are either used for energy or re-esterified to a backbone molecule and stored in adipose tissue (Iverson et al. 2004). De novo biosynthesis of fatty acids is the common lipid pathway, i.e. the type I fatty acid synthetase. The major end product is palmitic acid, 16:0 and fatty acids with 14, 18 and 20 carbon atoms produced by chain elongation (i.e. acyl chains with 18 and 20 carbon atoms). Monounsaturated fatty acids, MUFA, produced by aerobic desaturation introduces a double bond between carbon 9 and 10 to form palmitoleic acid 16:1(n-7), oleic acid 18:1(n-9) and gadoleic acid 20:1(n-11). In animals, these MUFA are also biosynthesized from myristic acid 14:0 and palmitic acid 16:0 precursors obtained from diet and undergo chain elongation and desaturation. These major fatty acids end products are nowadays used to infer trophic links (Dalsgaard et al. 2003). MUFA 20:1 and 22:1 are de novo biosynthesized, mainly by herbivorous calanoid copepod species and PUFA (n-3) and (n-6) are de novo biosynthesized by plants. Oleic acid 18:1(n-9) is the precursor of all (n-3) and (n-6) PUFA, essential to heterotrophic organisms. Linoleic acid 18:2(n-6) and α-linolenic acid 18:3(n-3) are only biosynthesized by primary producers and thus, animals only obtain these fatty acids from food.
Elongation and desaturation of 18:2(n-6) produces arachidonic acid 20:4(n-6) and elongation and desaturation of 18:3(n-3) produces EPA 20:5(n-3) and DHA 22:6(n-3). Dinoflagellates also produce 22:6(n-3) from steriadonic acid 18:4(n-3). As such, DHA is a marker for dinoflagellates dominance in aquatic environment. Diatoms have as major fatty acids: 20:5(n-3) and palmitoleic acid 16:1(n-7), from desaturation of palmitic acid 16:0 (Dalsgaard et al. 2003).
Fatty acids functional as trophic markers (FATM) provide information on energy flow in trophic webs. These fatty acids are easily identified, processed and incorporated into
1-28
consumers in a metabolically conservative manner and transferred from one trophic level to the next in a qualitative and quantitative way (Dalsgaard et al. 2003).
FATM are not species specific or metabolically stable. These compounds are affected by metabolic conditions and reproductive status of the organisms and can change predictably through the food web (Dalsgaard et al. 2003). Algae are the base of most aquatic food webs and so, the origin of most of the commonly fatty acids trophic markers. There are also bacterial and terrestrial fatty acids trophic markers. Fatty acids patterns transfer from algae to herbivores and to higher trophic levels, such as fish (Estrada et al. 2005) and marine mammals (Herman et al. 2005). In higher trophic levels, trophic relationships become unclear since fatty acids signatures come from a variety of sources. Thus, validation from other techniques is required to describe these relationships (De Lange and Van den Brink 2006).
An important aspect of FATM of the consumer is the time-integrated dietary intake. Lipid metabolism and storage in animals are organ-specific, so fatty acids extracted from specific body parts or tissues represent different feeding periods (De Lange and Van den Brink 2006).
Fatty acid trophic markers are most specific to primary producers. Microalgae have distinct fatty acid composition, for diatoms is predominant 16:1(n-7) and 20:5(n-3) and for dinoflagellates is predominant 22:6(n-3) and 18:1(n-9). Microalgae contribution to benthic organisms is detected by the proportions of each fatty acid in the tissues of consumers. The primary producers dominance in the water is detected by the ratios 16:1(n-7)/16:0 or 20:5(n-3)/22:6(n-3)>1 that indicate diatom over dinoflagellate dominance in the phytoplankton composition at the base of the trophic web. Vascular plants contribute to aquatic food webs with 18:2(n-6) and 18:3(n-3) and marine bacteria contribute with the 16:1(n-7) and 18:1(n-7). Attention is required for the whole fatty acid profile to ascertain bacterial contribution and not diatoms.
Fatty acids as EPA, DHA, ARA are essential fatty acids for animals, since they cannot synthesize them de novo or in sufficient amounts for metabolic requirements. The best sources of EPA and ARA are macroalgae, whereas in the seagrasses these compounds
1-29
are very scarce. The periphyton provides the best amounts of DHA (Budge and Parrish 1998, Graeve et al. 2002, Dalsgaard et al. 2003, Kharlamenko et al. 2008, Pernet et al. 2012a).
The fatty acid composition indicates the most relevant primary energy source for the food web (Graeve et al. 2002, Guest et al. 2008), e.g. cephalopods and fish have high contributions of sources rich in DHA, 22:6(n-3) (Stowasser et al. 2006, Estefanell et al. 2012a) and crustaceans have high contributions of sources rich in oleic acid 18:1(n-9) (Dalsgaard et al. 2003, Nyssen et al. 2005, Stowasser et al. 2006).
The dominant primary producers reflect nutrient availability, which in turn reflect changes in light intensity, water temperature, freshwater input, upwelling events and tidal mixing. Thus, the FATM at higher trophic levels will show any modifications in energy flow from the base of the food web associated with environmental changes, as well as variability in energetic sources between and within species due to temporal or spatial differences and ontogenetic variability in diet (MacNeil et al. 2005, Estrada et al. 2005, Petursdottir et al. 2008). The fatty acid composition is used as qualitative marker in this study.
1.1.1.3 Fatty Acids Analysis
This section details the extensive procedure for the fatty acids analysis and quality control, identical for each chapter.
1.1.1.3.1 Extraction of lipids from samples
The procedures for the lipid extraction and fatty acid analysis followed the Standard Operating Procedures of the Laboratory Manual by Marine Scotland Science and Webster et al. (2006).
1-30 1.1.1.3.2 Reagents
- Iso-hexane, methanol, dichloromethane, water, toluene; Rathburn Chemicals; - 2,6-Di-tert-butyl- p-cresol butylated hydroxytoluene (BHT)]; VWR International; - Sulphuric acid sp. Gr. 1.84, sodium chloride, potassium hydrogen carbonate (potassium bicarbonate), potassium chloride, sodium sulphate anhydrous granular; AnalaR, VWR International;
- Charcoal scrubbed nitrogen gas.
1.1.1.3.3 Reference materials
- LRM 144,LRM 147, LRM 175 (cod liver oil); - LRM 145 (Orange Roughy oil);
- Restek Marine FAME Standard or NuCheck Standard; - EO23;
- NuCheck.
Lipids were extracted from the fish liver and muscle; cephalopod muscle (mantle and tentacle), digestive gland and gut using a modification of the method detailed by Folch et al. (1957). Tissue samples, consisting of 1-2 g of wet weight, were removed by means of a scalpel and transferred to a clean centrifuge tube, labeled with the sample identification number, before weighing.
1-31
Samples were in chloroform/methanol (2:1 v/v; 20 fold weight of sample in volume) with 2,6-Di-tert-butyl-p-cresol (BHT) for at least 24h in a refrigerator (2-8ºC), in a centrifuge tube covered with aluminum foil.
After this time, aqueous potassium chloride (0.88% w/v) was added to form an emulsified mixture of 8:4:3 v/v/v chloroform, methanol and water. Centrifugation (1800 rpm; 15 min; 0ºC) was used to separate the organic and aqueous layers. The upper aqueous layer was removed and discarded into a sink using a water suction pump, connected to a Pasteur pipette. The lipid solvent mixture of the sample were transferred into clean, pre-weighted and labeled round bottom flasks using a calibrated soccorex pipette. The solid layer was air dried on a filter paper and stored frozen at -20ºC for stable isotopes analyses.
An aliquot of the lipid extract in solvent of several samples was transferred to screw top vials to determine lipid classes using thin layer chromatography and confirm the presence of fatty acid methyl esters, fundamental for the study. The solvent lipid mixture was evaporated completely in a rotary evaporator with a water bath set at 35ºC, any residual water or solvent from the lipid mixture was removed using a high vacuum pump. Each flask was weighted to determine the fraction of lipid in each tissue sample. If lipid was not visible, then 1mL of distilled toluene was added.
To determine the amount of lipid extracted from the tissue, the weight of the empty flask was subtracted from the weight of the flask with the extract. The percentage of lipid in the tissue is equivalent to the weight of lipid (g) in the tissue (g) x 100. These calculations were not always possible due to the very low weight of the lipid extract present in the flask, due to the analyzed lipid poor tissues.
The lipids extracts were trans-esterified or re-suspended in iso-hexane (2mL) and stored at -20ºC until trans-esterification.
1-32
1.1.1.4 Lipid class analysis by thin layer chromatography (TLC)
A sample of randomly chosen lipid extracts of the tissue was transferred into TLC vials for separation and identification of lipid classes. Lipid classes were separated on the basis of polarity and affinity for silica, the least polar travelling furthest along the plate. 2 µL of lipid extract in solvent was streaked onto a high performance thin layer chromatography (HP-TLC) plate and carried along the stationary phase by a mobile phase or solvent system.
The detection of the separated solutes was achieved by spraying the TLC plate with a solution of copper II sulphate in aqueous orthophosphoric acid, followed by burning.
1.1.1.4.1 Reagents
- Lipid standards mix, containing cholesterol, Cholesteryl Oleate, Oleic acid, Oleic acid methyl ester, Triolein - Sigma
- Diethyl ether - Fisher Scientific - Copper II sulphate
- Orthophosphoric acid - BDH Limited.
1.1.1.4.2 Solvent system preparation and plate development
Three solvent systems were used to detect non polar and polar lipid classes.
Solvent system 1 was prepared with 70 mL of iso-hexane, 30 mL of diethyl ether; solvent system 2 was prepared with 97 mL of iso-hexane, 3 mL of diethyl ether; and
1-33
solvent system 3 was 100 mL of iso hexane. The solvents were poured in chromatography tanks with glass lids.
The excess gel in the TLC plate (LHP-K linear 60A high performance TLC plate, with a coating of 200 µm and size 20 x 10cm; Whatman International Ltd) was scrapped from the edges with a scalpel and allowed to dry in a fume cupboard.
On a sheet of paper with guide marks identified the lipid standards mix (edges and middle) and the samples. With a microcapillary pipette, 2µL of the lipid standard or lipid extract were transferred to the TLC layer about 0.5 cm from the top of the layer. The solvent evaporated and the samples became invisible. The plate was placed vertically into the tank with the solvent system 1 for the duration of the solvent to travel half the distance from the top. The plate was transferred to the tank with the solvent system 2 and solvent travels until 1 cm from the top. Then the plate was transferred to the tank with solvent system 3 and the solvent travelled off the top edge of the plate. The solvents were removed by evaporation after each solvent system.
The plate was developed, in a fume cupboard and upright in a aluminum foil, by spraying lightly with solution of copper II sulphate (10% w/v) in aqueous orthophosphoric acid (8% v/v), using a chromatomiser spray gun. The plate was then transferred to a pre-heated oven at 180ºC for 10 minutes.
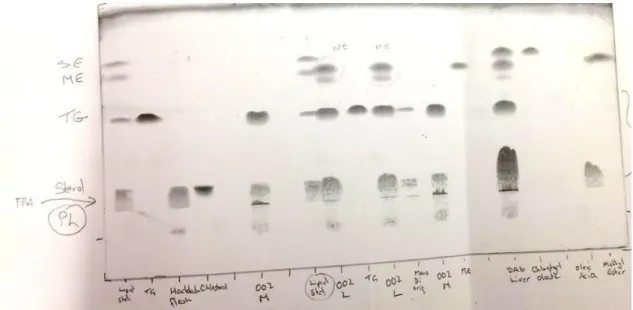
Lipid classes were confirmed by comparing the Rf value (Distance lipid travelled on plate (mm)/total distance travelled of solvent on plate (mm)) with those of the standard (Figure 1.1.1). A photocopy of the TLC plates developed was kept for posterior analysis, if necessary.
The presence of fatty acid methyl esters was confirmed by the analysis of samples with the TLC procedure.
1-34
Figure 1.1.1 TLC plate developed for seabream, Argyrosomus regius. The presence of methyl esters is evident from the comparison of lipid classes from the solutions of other lipid standards.
1.1.1.4.3 Trans-esterification of lipids extracts from fish and cephalopod tissues
An aliquot of 10mg of the lipid extracts (or whole extract in the case of very small quantities) was transferred into 15 mL screw top test tube and 1 mL of distilled toluene was added to each tube (if not added previously as in the case of lipid poor samples). Toluene must be distilled previously to remove residual water, which would inhibit reaction. The mixture was shaken vigorously.
Methanol-containing sulphuric acid (1% v/v; 2mL) was added to each tube and shaken. The resulting lipids were converted into fatty acid methyl esters (FAMEs) by transesterification overnight (incubated at 50ºC) using a heating block.
The mixture was allowed to cool before extraction of fatty acid methyl esters with iso-hexane. To each tube, aqueous sodium chloride solution (5% v/v; 5mL) was added and then iso-hexane (2x5mL) to form an emulsified mixture; the iso-hexane layer (top layer) was transferred each time to a second test tube.
1-35
Aqueous potassium bicarbonate (2% w/v; 4mL) was added to the second test tube. The top layer containing the methyl esters in iso-hexane, were transferred to scintillation vials and dried over anhydrous sodium sulphate.
Vials were stored at -20ºC until analysis, after a stream of charcoal scrubbed nitrogen. A blank and laboratory reference materials were esterified in each procedure. EO23, a laboratory reference material used to confirm results was prepared as a batch with an expiry of 1 year from the date of preparation.
1.1.1.5 Determination of fatty acids from sample tissues with GC-FID
The fatty acid methyl esters composition of the samples was determined by Gas Chromatography with flame ionization detection (GC-FID) using an Agilent (Hewlett-Packard) 5890 Series II gas chromatograph fitted with a fused silica capillary column (0.25mm i.d. x 30m) coated with a 0.25 µm film of 50% cyanopropyl. Prior to GC-FID analysis.
The extracts were diluted in iso-hexane to give an estimated fatty acid/ fatty alcohol concentration of 0.1 mg/mL; and 1mL of each sample was transferred to GC vials. Samples (1µL) were injected, using a cool, on-column auto injector at 60ºC.
The oven temperature was ramped at 25ºC/min from 60ºC to 150ºC and then at 1ºC/min to 200ºC. The temperature was held constant for 10 minutes before final elevation at 5ºC/min to 230ºC for 5 minutes. The detector was set at 300ºC.
Nitrogen was used as the carrier gas (1 mL/min). Twenty-nine fatty acid methyl esters were identified based on the retention times of the laboratory standards.
The identification of FAME was confirmed by mass spectroscopy. A procedural blank and esterified laboratory reference material of cod liver (LRM 144 and LRM 147) and esterified laboratory reference material of Orange Roughy (LRM 145) were analyzed with each batch of samples. A Restek FAME Standard or Nucheck Standard and EO23 were analyzed with each batch of samples to confirm chromatogram profiles and
1-36
component retention times. Laboratory reference materials were run with the samples and appropriate quality assurance checks made using Shewart Charts. The normalized area percentage was calculated on the basis of the twenty nine fatty acids.
Peaks were identified by comparison with the reference chromatograms. There should be no peak tailing or fronting and peaks were resolved, where possible.
To calculate normalized area in percentage, the data was collected and processed using a Perkin-Elmer Turbochrom Navigator, where peak areas were generated by Totalchrom software. Calculation results were based on conversion of peak area data to normalized area percentages. The Normalized area percent was determined for each component using the formula:
Peak retention times of the various methyl esters were updated manually by comparison with the retention times in the reference materials (EO23, Nucheck, Restek and laboratory reference materials (LRMs)) analyzed with each batch of samples. Visual checks of peak integrations were made for each sample. LRMs were esterified and analyzed with each batch of samples as a check on the esterification procedure. Fatty acid methyl esters studied are shown in Table 1.1.1.
1.1.1.6 Confirmation of FAME identification by GC-MS
GC-MS using electron impact ionization confirmed FAME identified with the GC-FID. The GC-MS was a HP 6890 gas chromatograph interfaced with an HP 5793 selective detector and on-column injector. The column temperature was held at the initial oven temperature of 65ºC for 2 minutes, then ramped at 20ºC per minute to 150ºC, then ramped at 1ºC per minute up to 200ºC and held for 10 minutes, then ramped at 10ºC per minute to 220ºC and finally held at 220ºC for 10 minutes. Helium was used as the carrier gas at 0.7 mL min-1. The interface and MS source were set at 230ºC and MS Quad was set at 150ºC. The column used was a fused silica capillary column (0.25mm
1-37
i.d. x 30m length) coated with the polar DB-23 phase (film thickness, 0.25 µm, Agilent, UK).
1.1.1.7 Material Quality Control
Gloves were worn throughout the analytical procedure to prevent contamination from lipids present on the skin. Prior to use, analytical glassware was rinsed with iso-hexane which evaporated before procedure and rotary evaporator glassware was rinsed with chloroform.
All methods were validated by the replicate analysis of the standards and samples and with the analysis of laboratory reference materials, see (Méndez-Fernandez et al. 2014).
With each batch of samples, cod liver oil LRM and an Orange Roughy oil LRM (10mg) were analyzed. Cod liver oil was esterified to FAME and glycerol. Orange Roughy was esterified to FAME and fatty alcohols. Procedural blanks with BHT were analyzed with each batch of samples and neither fatty acids or fatty alcohols should be present in the procedural blanks. If any were detected, the batch was repeated.
Lipid samples were stored frozen and out of direct sunlight to limit lipid oxidation. Tissue samples selected for lipid extraction were stored frozen and allowed to thaw on the bench out of direct sunlight to avoid lipid oxidation.
The balances performance check was carried out daily. A new scalpel blade was used for each sample to prevent cross-contamination. All tools were cleaned with iso-hexane between samples and chloroform, if necessary.
1-38
1.1.1.7.1 Peak identification, quantitation and quality control
Every batch started with a couple of samples of iso-hexane and the standards EO23, NuCheck and Restek to confirm the GC retention times and for quality assurance. EO23 fish oil, a long-standing reference material, developed to assess laboratory competency to determine fatty acid composition of fish oil, is used for several years to confirm FAME retention times.
EO23 was analyzed for FAME along with each batch, every 6-10 samples and used as a check on the retention times. The custom made standard NuCheck from NuCheck (Mn, USA) contain both FAME and fatty Alcohols and Restek Marine Oil contain FAME. Laboratory reference materials, cod liver oil and Orange Roughy oil, were esterified and analyzed with each batch of samples as a check on esterification procedure, every 15 samples.
The data on the fatty acids composition obtained from the reference materials were transferred onto NWA Quality Analyst and control charts were produced for warning and action limits on GC-FID measurements.
1.1.1.7.2 Shewart charts - quality control
Shewart charts onto NWA Quality Analyst tested for quality control of comparability of the data. These charts check for stability of the analytical process where repeated measurements of a single quality characteristic are plotted against the sample number or time. Here, the normalized area percentage of selected fatty acids (14:0, 16:0, 16:1(n-7), 18:1(n-9), 20:5(n-3), 22:6(n-3)) derived from the repeated analysis of EO23 and LRMs is used for quality control of measurements.
The graph is described by a centre line that represents the mean value of the specific fatty acid from all samples of the standard. The upper and lower lines are the mean
1-39
plus and minus three standard deviations of the represented mean, which represents the Warning limit.
The lines above and below the mean are the mean plus and minus two standard deviations, respectively. These lines represent the Control limit, which are the range of variation expected in statistical control, i.e. consistent measurements. Control and warning limits are not fixed values. When many data points are added to a chart (more than 30 points) or if the analytical procedure changes, a better estimate of the variability of the sample set requires standard deviation adjustment.
Chart sample points represent a summary statistic (i.e. not single values) giving the mean for a sample of measurements of the quality characteristic, e.g. mean of each fatty acid by batch analyzed. The variation within these subgroups is minimized and variation between subgroups is maximized so the chart is more sensitive to shifts in the actual analytical process.
Values must have a random distribution around the centre line below warning and control limits (Figure 1.1.2, Figure 1.1.3, Figure 1.1.4). A point outside these controls limits or a systematic distribution in the measurements indicates a special cause of variation, i.e. a statistically unusual pattern of points implies out of control conditions. The method is out of control when two successive values exceed the warning limit, one value exceeds the control limit or 7 values in a row are on either side of the mean (centre line). With any of these conditions, the method was considered unstable so measurements were repeated.
1-40
Figure 1.1.2 Shewart chart of fatty acids 14:0, 16:0, 16:1(n-7), 18:1(n-9), 20:5(n-3) and 22:6(n-3) for GC5890 of the standard EO23. The centre line represents the mean of the overall samples analyzed. Each point is a subgroup mean for each batch. The upper and lower dotted lines in the graph are the control limits (mean ± 3 standard deviations) and the upper and lower lines above and below the centre line are the warning limits (mean ± 2 standard deviations).
1-41
Figure1.1.3 Shewart chart of fatty acids 14:0, 16:0, 16:1(n-7), 18:1(n-9), 20:5(n-3) and 22:6(n-3) for GC5890 of the Laboratory standard Orange Roughy (LRM145). The centre line represents the mean of the overall samples analyzed. Each point is a subgroup mean for each batch. The upper and lower dotted lines in the graph are the control limits (mean ± 3 standard deviations) and the upper and lower lines above and below the centre line are the warning limits (mean ± 2 standard deviations).
1-42
Figure1.1.4 Shewart chart of fatty acids 14:0, 16:0, 16:1(n-7), 18:1(n-9), 20:5(n-3) and 22:6(n-3) for GC5890 of the Laboratory standard cod liver oil (LRM173). The centre line represents the mean of the overall samples analyzed. Each point is a subgroup mean for each batch. The upper and lower dotted lines in the graph are the control limits (mean ± 3 standard deviations) and the upper and lower lines above and below the centre line are the warning limits (mean ± 2 standard deviations).~
1-43 1.1.2 Stable Isotopes
1.1.2.1 Introduction
Stable Isotope Analysis is a common technique to study trophic interactions, trophic positions, sources of energy and spatial and temporal changes in the ecosystem structure. These changes from anthropogenic or natural origin are of high importance to detect before any consequences for the ecosystem functioning and ultimately for ecosystem productivity (Hobson 1999, Pinnegar and Polunin 1999, MacNeil et al. 2005, Estrada et al. 2005, El-Sabaawi et al. 2009).
Stable isotope composition is estimated directly from tissues and differences are driven by isotopic differences among food sources, due to photosynthetic pathways, consumer-resource discrimination, fractionation or properties of the consumer (e.g. diet, trophic position, tissue type, taxonomic group, feeding guild, lipid content, marine versus terrestrial food sources, habitat conditions) (MacNeil et al. 2005, Nyssen et al. 2005, Stowasser et al. 2006, Carlier et al. 2007, Kharlamenko et al. 2008, Deudero et al. 2009, Cherel et al. 2009b, Boecklen et al. 2011, Pernet et al. 2012b).
The variation in isotopic signatures of food sources in complex estuarine and marine ecosystems and the multiple food sources that contribute to fish species require a complementary tool to enhance the analysis of trophic interactions and diet changes, as fatty acid analysis (Alfaro 2006, Petursdottir et al. 2008).
1-44
1.1.2.2 Isotope Chemistry and Terminology
Isotopes are naturally existing atoms of the same element with different mass that behave in a similar chemical way. Stable isotopes do not decay radioactively and many elements of biological importance (e.g. C, H, N, O, S) have two or more stable (nonradioactive) isotopes of which the lightest is usually in greater abundance. Each organism has an isotopic composition of the rare, heavy isotope (e.g. 13C, 15N) and the common, lighter isotope (e.g. 12C, 14N).
The proportion of stable isotopes relative to elemental atoms is measured in comparison to worldwide standards with a mass spectrometer and expressed as:
where R is the ratio of the heavy to the light stable isotope of the element, measured in parts per thousand (‰). δR is the heavy to light isotope ratio for the sample relative to an international standard. Delta units are per thousand (‰).
Smaller values are relatively "depleted" and higher values are relatively "enriched". Stable Isotope Standards (δ=0): PeeDee Belemnite (PDB) for isotopes 13C and 12C has a ratio of 0.0112372 ± 0.0000090; Atmospheric nitrogen for isotopes 15N and 14N has a ratio of 0.003663 ± 0.0000081 (De Lange and Van den Brink 2006).
Isotopes in this thesis are common in trophic ecology studies to elucidate on the flow of energy (e.g. primary producers, organic material) through the food web (Fry 2006, Boecklen et al. 2011):
-
for primary production, trophic interactions, plant physiology;
-
1-45
1.1.2.3 Trophic level
Minagawa and Wada (1984) calculated an average fractionation at a single feeding process of 3.4‰, independent of habitat and trophic level. The bioaccumulation of δ15
N along a food chain occurs from the excretion of materials isotopically lighter than tissues and absorption of isotopically heavier materials (Del Rio et al. 2009). This value, though in constant debate, is still widely applied to estimate trophic level of consumers in many systems and corresponds to a one trophic level increment in δ15N (Post 2002). The formula to calculate trophic position will be:
The estimation of trophic position of consumers based on their δ15N values misleads conclusions since different producers in the same area can differ on δ15N values or δ13C and δ15N not be independent (Van der Zanden and Rasmussen 2001). The comparison of trophic position of organisms is only effective if the primary producers are the same or have similar δ13C and δ15N values. This way, to calculate a trophic position of an organism it is of great importance to provide a reliable baseline in space and time.
1.1.2.4 Isotopic discrimination or fractionation
Discrimination factor or "tissue to diet discrimination" (usually denoted by Δ) is the difference in stable isotope ratios between tissue of consumer and diet. When the diet changes in isotopic signature, the tissues of the consumer adjust and approaches a new equilibrium consistent with the new diet (Boecklen et al. 2011). The stable isotope ratio of the tissue results from chemical, physical and physiological processes. On the other hand, the term fractionation refers specifically to chemical reactions that cause differences in stable isotope ratios between an entire animal and its diet (Del Rio et al. 2009).