FUNDAÇÃO GETULIO VARGAS
ESCOLA BRASILEIRA DE ADMINISTRAÇÃO PÚBLICA E DE EMPRESAS MESTRADO EM ADMINISTRAÇÃO
RELATIVIZING HONESTY: SOCIAL CLASS
AND PERCEPTION OF CORRUPTION
JULIANA RODRIGUES DE SOUZA
Rio de Janeiro - 2018DISSERTAÇÃO APRESENTADA À ESCOLA BRASILEIRA DE ADMINISTRAÇÃO
Ficha catalográfica elaborada pela Biblioteca Mario Henrique Simonsen/FGV
Souza, Juliana Rodrigues de
Relativizing honesty : social class and perception of corruption / Juliana Rodrigues de Souza. - 2018.
35 f.
Dissertação (mestrado) - Escola Brasileira de Administração Pública e de Empresas, Centro de Formação Acadêmica e Pesquisa.
Orientador: Daniela Campello da Costa Ribeiro. Inclui bibliografia.
1.Corrupção na política. 2. Corrupção administrativa. 3. Governança. I. Campello, Daniela, 1970-. II. Escola Brasileira de Administração Pública e de Empresas. Centro de Formação Acadêmica e Pesquisa. III. Título.
RESUMO
A classe social de um político afeta a avaliação dos eleitores sobre quão corrupto ele é? Teoria utilitária econômica presume que indivíduos de classe alta possuem mais incentivos para agir em conformidade com a lei. Contudo, a abordagem behaviorista postula que normas sociais, valores intrinsícos distintos e conexões privilegiadas mitigam os efeitos disciplinatórios desses incentivos. Qual é a logica que prevalece entre os eleitores quando ajuízam políticos de divergentes origens socioeconômicas? Além disso, a classe social dos próprios eleitores impacta esse julgamento? Um experimento foi conduzido online para testar essas hipóteses. Participantes leram sobre uma notícia do caderno de política descrevendo um esquema de corrupção (fictício) em uma administração local e, em seguida, avaliaram o envolvimento do prefeito hipotetico apresentado. A classe social do prefeito foi manipulada através das condições (Alta ou Baixa) ou nenhuma informação sobre o prefeito foi disponibilizada (Neutro). Resultados revelam que a classe social de um político impacta significantemente o parecer dos eleitores sobre sua venalidade. Entretanto, o estudo não agrega evidência de que a classe social dos eleitores afeta esse parecer.
Palavras-chave: Psicologia Política, Corrupção, Classe Social, Experimento, Teoria
ABSTRACT
Does a politician’s social class affect voters’ assessment of how corrupt she is? Economic utilitarian theory posits that the upper-class would have more incentives to behave lawfully and not engage in misdeeds. Nonetheless, behavioral approach postulates that social norms, distinct intrinsic values, and upper-class’s powerful networks mitigate the curbing effects of such incentives. What is the prevailing logic in voters’ mind when appraising politicians from opposite socioeconomic background? Does voters’ own social class impact this assessment? An online experiment was conducted to test these hypotheses. Subjects were presented with news describing a fictional graft scheme within a local administration and then proceeded to evaluate the hypothetical mayor’s involvement. Mayor’s social status was manipulated across conditions. Findings revealed that a politician’s social class does impact voters’ evaluation on her venality. However, the study falls short to providing statistical evidence that voters’ own social class affect their evaluation.
Key words: Political Behavior, Corruption, Social Class, Experiment, Social Identity
Contents
1. Introduction 1
2. Literature Review 4
2.1 Social Class and Misbehavior 4
2.2 Social Class and Ingroup Bias 7
2.3 Corruption in Brazil 9
3. Methodology 11
3.1 Experiment 11
3.1.1 Politician’s Social Class and Perceived Corruption 11
3.1.2 Participants’ Social Class 13
3.2 Sample 14
4. Results and Discussion 16
4.1 Mayor’s Social Class and Perception of Corruption 16 4.2 Voters’ Social Class and Perception of Corruption 19
5. Conclusion 24 References 25 Appendix A 31 Appendix B 32 Appendix C 33 Appendix D 35
Relativizing Honesty: Social Class and Perception of
Corruption
Juliana Rodrigues
Abstract
Does a politician’s social class affect voters’ assessment of how corrupt she is? Economic utilitarian theory posits that the upper-class would have more incentives to behave lawfully and not engage in misdeeds. Nonetheless, behavioral approach postulates that social norms, distinct intrinsic values, and upper-class’s powerful networks mitigate the curbing effects of such incentives. What is the prevailing logic in voters’ mind when appraising politicians from opposite socioeconomic background? Does voters’ own social class impact this assessment? An online experiment was conducted to test these hypotheses. Subjects were presented with news describing a fictional graft scheme within a local administration and then proceeded to evaluate the hypothetical mayor’s involvement. Mayor’s social status was manipulated across conditions. Findings revealed that a politician’s social class does impact voters’ evaluation on her venality. However, the study falls short to providing statistical evidence that voters’ own social class affect their evaluation.
1. Introduction
Corruption, commonly conceptualized as “the misuse of public power for private gains” (Nye 1967; Treisman 2000; Fried et al. 2010), has become a subject of interest in a growing literature in Political Science, Behavior and Economics.
Previous research indicates that perceived corruption influences political behavior in many ways: it affects the amount of trust on political system (Mishler and Rose, 2001; Seligson, 2002; Lavallee et al., 2008; Morris and Klesner, 2010), it impacts citizens’ assessment of performance (Anderson and Tverdova, 2003; Wang, 2015) with evidence of partisan bias (Davis et al., 2004; Anduiza et al., 2013; Klasnja, 2017).
Further, in the US, studies on electoral outcomes of Congressional Elections provide evidence that politicians whose involvement in graft schemes were exposed
experienced electoral retribution in the sense that their expected vote share was negatively affected by, on average, 5-11 percent (Dimock and Jacobson, 1995; Welch and Hibbing, 1997; Basinger, 2012). Similarly, in Brazil, malfeasance carried out by public officials curtailed the probability of reelection for accused incumbents (Brollo, 2008; Ferraz and Finan, 2008; Ferraz and Finan, 2011).
Thus, there is a growing literature on political science addressing the issue of how corruption affects voting behavior, which in turn impacts electoral outcomes and institutional evaluations from citizens. Nevertheless, there is scant research on how corruption factors in the assessment of public officials when in absence of concrete clues signaling a history of improbity, especially in countries where corruption is a striking topic whenever politics is discussed.
When choosing a politician to support, people may resort to cognitive shortcuts to assist on the difficult task of determining which candidate is the most suitable for office. Earlier studies have suggested that, for instance, facial appearance (Todorov, 2005), similarity between voters themselves and politicians (Caprara et al. 2007), endorsements (Brady and Sniderman, 1985; Chen and Henneberg, 2008), and social class (Campbell and Cowley, 2014; Carnes and Sadin, 2015; Carnes and Lupu, 2016) might be employed by voters as proxies to appraise a candidate’s personal values and competence.
Moreover, behavioral research suggests that the propensity to act unethically hinges on social class status. Upper-class individuals, relative to lower-class individuals, engage more in infringements of traffic codes (Piff et al., 2012), are more likely to exercise bribe payment (Hunt and Lazlo, 2006; Hunt, 2007; Guerrero and Rodriguez-Oreggia, 2008), and are less averse to corruption (Gatti et al., 2003).
In this paper we investigate whether a politician’s social class plays a role in voters’ effort to gauge her venality. Do voters perceive an upper-class politician as more prone to abuse public office in comparison to her lower class counterpart? Seeking to answer this question we propose an experiment in which the politician’s social class background is manipulated.
Secondly, does judgers’ own social class vitiate probity assessment? Social Identity Theory posits that one’s distinctive group memberships contribute to the architecture of one’s self-concept (Tajfel, 1982; Tajfel and Turner, 1986). Social groups, such as gender
(Bilsker et al., 1988; Rudman and Goodwin, 2004), religion (Taylor and Jaggi, 1974; Ysseldyk et al., 2010), ethnicity (Nagengast and Kearney, 1990; Negy et al., 2003), and social class (Blascovich et al., 2001; Aries and Seider, 2007; Kraus et al., 2012) affect an individual’s sense of self-esteem, cognitive processes, and intergroup interactions. Hence, the extent of perceived corruption reflected on the actions of a public agent might be contingent upon whether the voter recognizes either shared (ingroup) or incongruous (outgroup) social identities between the public agent and herself.
Findings indicate that politicians’ social class exerts influence on how citizens evaluate an elected official’s tendency to engage in venal activities. Furthermore, results suggest that the underlying mechanism explaining such effect lies in the availability heuristics and internalized social norms concerning the average politician profile voters have on their mind. However, this study fails to provide statistical evidence that voters’ appraisal hinges on the interaction between the politicians’ and their own social class.
2. Literature Review
2.1 – Social Class and Misbehavior
Social class is a bidimensional construal comprising objective measures of one’s tangible resources (e.g. money, properties, etc.) and a subjective grasping of one’s position in social hierarchy within her community (Kraus et al., 2012; Piff, 2013). Yet, money is commonly interpreted as a proxy to social status (Lea and Webley, 2006; Kraus et al., 2011) since it allows for discernible patterns of consumption circumscribed to those in the highest spheres of society.
Recently, the idea that wealthy people are inherently more honest precisely because they are rich, hence eliminating any chance of misbehavior aiming at material gains, has crept in the political rhetoric. For instance, in American politics, president Donald Trump has reportedly said, “I’m so rich I can’t be bought”. ¹ Plus, the director of the National Economic Council, Lawrence Kudlow has stated “Why shouldn’t the President surround himself with successful people? Wealthy folks have no need to steal or engage in corruption”. ² In Brazil, João Doria, a millionaire businessman and governor of the state São Paulo, has declared that his electorate is aware that “João Doria is successful, he doesn’t need to steal”. ³1
Supporting this logic regarding incentives on corruption, the standard economic theory posits that the decision to behave dishonestly stems from the net value of benefits and costs associated with the act; that is, if the expected external benefits (e.g. money, status, nepotism, job promotion, etc.) exceed the expected external costs (e.g. paying a fine, being fired from a job position, social isolation, incarceration, etc.) a rational individual would choose to carry out the dishonest attitude (Becker, 1968; Lewicki, 1984;
¹Politico: ‘Donald Trump’s new pitch: I’m so rich I can’t be bought.’ https://www.politico.com/story/2015/07/donald-trumps-so-rich-i-cant-be-bought-120743 Accessed on 11/2/2018
²New York Magazine: ‘The wealthy would never steal’ – A credo for Trump’s party
http://nymag.com/daily/intelligencer/2016/12/the-wealthy-would-never-steal-a-credo-for-trumps-party.html Accessed on 11/2/2018.
³ Exame: ‘In SP, I want to follow the example of Michael Bloomberg, says Doria’
https://exame.abril.com.br/brasil/quero-seguir-o-exemplo-de-michael-bloomberg-em-sp-diz-doria/ Accessed on 11/2/2018.
Hechter, 1990). Under this logical frame, individuals with high socioeconomic status would, indeed, behave in accordance with law since they have too much to lose (i.e. costs surpass gains).
Nonetheless, studies suggest that belonging to privileged sectors of society endows individuals with connections to powerful circles, thus enabling them to exert influence on matters both through legal and illegal means (Kaufmann, 1997; Glaeser et al., 2003; de Ferrari et al., 2004). Accordingly, a sense of impunity comes along with affluence, weakening the hindering effect of the expected costs of corruption.
Research has provided evidence that public officials’ alter their attitude towards citizens belonging to higher sectors of society. In Mexico, Lagunes (2009) conducted a study seeking to analyze whether citizens’ social class affect access to public information. Requests containing personal information branding the citizen as upper class and politically connected received differential treatment relative to those made by an average citizen. For instance, although messages were virtually the same except for the identification of the requester, those from the high status condition had requests denied less often than low status condition.
Furthermore, Fried et al. (2010) employed a multimethod approach to investigate how, after a law infringement, citizens’ social class yields disparage reactions from corrupt public officials in Mexico. In a field experiment, four drivers disrupt traffic law with minor actions (e.g. illegal turns, speaking on the cellphone while driving) across randomized surveiled crossroads. The drivers’ social status was manipulated (2 upper- and 2 lower- class) through clothing, the car they drive, and demeanor. While police officers were equally likely to stop drivers regardless of their social status, bribe payment was only requested from lower social class drivers. Thereafter, interviews elucidated that officers believe that upper class citizens belong to social circles powerful enough to bring about retaliation against them.
Additionally, authors have observed that wealthy people possess higher levels of greed (Piff et al., 2012), which has been connected with willingness to dupe others in search of financial gains (Aquino et al., 2009), and disregard for moral standards when seeking self-interest (Steinel and De Creu, 2004). So, utilitarian models may have
underestimated material motivation, and a heightened feeling of greed may further impel the individual to act on misdeeds.
Previous research has investigated whether spurring greed on lower status subjects could equalize their inclination towards unethical behavior to upper status subjects. Piff et al. (2012) tested an experimental setting that randomized priming greed as a good quality into a subset of participants. Results suggest that greedy lower class participants became as prone to engage in unethical behavior as upper class subjects. Therefore, these findings shed a light on how divergent intrinsic values held by those occupying opposite social strata might contribute to an enhanced tendency to perform deviant ethical behavior among upper class individuals.
Further, a second experimental design randomized subjects into either a priming of low- or upper- class mindset. Afterwards, participants completed unrelated tasks. Then, at the end of the procedure, an experimenter entered the room, presented a jar of candies to the participants, and explained that the candies were for children in a nearby laboratory, however, if participants wanted, they could take candies with them although it was not possible to refill the jar. Findings indicate that subjects assigned as upper class, on average, took significantly more candy in comparison to lower class subjects. Thus, upper class individuals have been shown to – literally – take (more) candy from children.
Moreover, internalized social norms (i.e. the informal values and beliefs that regulate a society) are often associated with corruption (Barr and Serra, 2010; Banerjee, 2016). How normalized misbehavior is within a country affect citizens’ interpretation and action concerning dishonesty. Fisman and Miguel’s (2007) natural experiment examination of whether the extent of corruption within a diplomat’s country of origin would impact her engagement with minor abuse of power to violate New York city’s parking rules. Results reveal that breaking parking regulation is strongly correlated with home country level of corruption. Therefore, these social norms are so inbred that still resonate in one’s decision process about what is socially acceptable even in another cultural environment.
Still, it remains uncertain which underlying rationale prevails in voters’ assessment of politicians. Do voters, even if unconsciously, adopt the utilitarian reasoning that the upper class is less prone to engage in venal activities? Or, instead, do voters understand
that the benefits of being affluent transcend the monetary realm and such advantages incentivize the upper class to misconduct? Hence the main hypotheses:
H1a: upper-class politicians are perceived as less prone to corruption than their lower-class peers
H1b: upper-class candidates are perceived as more prone to corruption than their lower-class peers
After examining voters’ perception on how social status and public malpractice interacts, we proceed to investigate whether their impression hinges on their own social status.
2.2 – Social Class and Ingroup Bias
Social Identity pertains to how membership in social groups exerts influence on one’s self-concept, that is “the individual’s knowledge that he belongs to certain social groups together with some emotional value to him of this group membership” (Tajfel,1982) affects the goals, attributes, motives and beliefs related to oneself (Kraus et al., 2012). Further, intergroup behavior derives from the interplay between (i) the unequal status attributed to distinct social groups, (ii) the stability of these differences, and (iii) the degree of permeability (Tajfel and Turner,1979).
Therefore, social groups (e.g gender, race, social class, etc.) and whether one does (ingroup) or does not (outgroup) belong to a given category (e.g. female, latin, upper-class, etc.) have a significant bearing on one’s self-worth through the status granted to such groups (Tajfel and Turner, 1979). Thus, enhancement or deterioration of one’s self-esteem is subjected to collective outcomes through the cognitive mechanism (Turner, 1982) that reflects group affiliation on one’s self-image (Cohen & Steele, 2002; Klein & Azzi, 2001).
As a matter of fact, social class is employed as means of categorizing one another and ensuing social interaction unfolds under such frame (Blascovich et al., 2001; Kraus et a., 2011). Also, social status substantially outlines the environment one lives in and the
connections one develops (Kraus et a., 2012), for instance, shared social status bears on who one marries (Sweeney and Cancian, 2004), and who becomes her neighbor (Lareau, 2003), classmate (Nisbett, 2008) or coworker (Argyle, 1994).
Moreover, as intergroup exchange unravels, due to the inexorable connection between social identity and self-esteem, ingroup bias emerges as means of boosting or, at least, maintaining one’s positive distinctiveness (Tajfel and Turner, 1979; Brown, 2000; Iacoviello et al., 2017). Thereby, ingroup favoritism enhances the collective social identity, which in turn is mirrored on the personal level, heightening individuals’ self-esteem through their group membership.
Previous research suggests that social class membership engenders ingroup favoritism effects. Horwitz et al. (2014) conducted a study that assigned 4-5 year old children as low/high social status individuals. When asked about whether they liked more the drawing of a poor or wealthy person, subjects in the high status condition displayed an ingroup favoritism by consistently preferring the rich cartoon over the poor one whereas no effect was found for children in the low status condition. Furthermore, the findings suggest that young children internalize the notion that it is more auspicious to belong to higher social strata, which emphasizes how early social class distinction is embedded into one’s worldview and, subsequently, social identity.
Therefore, building on Social Identity Theory I conjecture that, since involvement in graft schemes is widely regarded as immoral, in order to preserve one’s self-esteem unscathed, whenever politician’s and voter’s social class are congruent (i.e. share this facet of social identity), the perceived corruption attributed to the public figure will be more attenuated than when the politician’s and the voter’s social class diverge. Therefore, leniency towards an ingroup peer who practiced malfeasance protects the collective social identity (i.e. social class), which in turn maintains individuals’ self-esteem. Hence, the following hypotheses:
H2a: upper- class voters perceive upper-class politicians as less prone to corruption than lower-class politicians
H2b: lower-class voters perceive lower-class politicians as less prone to corruption than upper-class politicians
To test the proposed hypothesis an online experiment was carried out with Brazilian subjects.
2.3 Corruption in Brazil
Studies have shown that increased exposure to a matter inflates its relevancy in voters’ appraisal of politicians (Krosnick and Brannon, 1993; Klasnja et al., 2016). Since 2017, Brazil, a country historically marred by corruption scandals, undergoes the investigation and the aftermath of the disclosure of what has become its largest graft scheme yet, the Car Wash operation, which encompassed public officials from executive and legislative branches of power along with private agents.
Public malfeasance impedes citizens’ trust in the political system (Seligson, 2002; Morris and Klesner, 2010). In 2013, a survey conducted by Transparency International indicated that Brazilians falter in their belief in institutions, most of the interviewed citizens reported that, in their perception, political parties (81% of respondents), legislature (72%), and the police (70%) are corrupt or extremely corrupt. 42
Moreover, Brazilian electorate adversely reacts to politicians’ misdeeds. Ferraz and Finan (2008) showed that audit reports unveiling wrongdoings in Brazilian mayoral offices hampered accused incumbents’ reelection efforts; the effects were even more acute in municipalities with local radio stations which facilitated the spread of such news. Later, Brollo (2012), using the same database, explored the endogeneity of the timing of each report release to study the channels through which this electoral accountability happens. Findings suggest two potential mechanisms: (i) reduced available resources due to diminished federal transfers and, (ii) politician’s tarnished reputation as a result of the reports release. Thus, misconduct in public office yields a directly effect on voters’ assessment of the politician’s image which, collectively, amount to a diminished probability of incumbent’s reelection.
4 Transparency International - National Results: Brazil. Accessed on 10/30/18. https://www.transparency.org/gcb2013/country?country=brazil
Furthermore, Ferraz and Finan (2011) provide evidence that mayors seeking reelection embezzled fewer resources (on average -27%) than mayors presiding over their last term. Therefore, empirical evidence suggests that not only voters exercise political accountability but also politicians are aware of the detrimental ballot impacts of character deconstruction due to engagement in misappropriation.
Currently, corruption is such a salient topic in Brazil that it is integral to any ongoing political debate. Altogether, this constitutes an opportune occasion to study the subject and related matters with Brazilian participants.
3. Methodology
3.1 Experiment
For my purpose to determine if voters’ perception on candidates’ venality hinges on candidates’ social class, I propose a candidate evaluation experiment, which consists of asking subjects to evaluate a hypothetical politician and randomly varying the trait of interest while holding all remaining characteristics stable throughout trials. The experiment was conducted on Facebook, as it is a simple cost-effective recruitment tool for online survey-experimental studies (Samuels and Zucco, 2013).
The experimental design was 3 (Mayor’s Social Class: high, low, neutral) x 2 (Participants’ Social Class: high vs. low) between-subjects. Participants were randomly assigned into a politician’s social class condition.
3.1.1 – Politician’s Social Class and Perceived Corruption
In the proposed experiment, all participants read a fictional piece of news concerning an unveiled graft ruse in an unidentified mayoral office. The statement declares:
“The following excerpt was extracted from news published in the political session of a newspaper:
The Controladoria Geral do Município (CGM) investigated a project of public lighting in a mayoral administration. The investigation report called ‘Every Light Beam is made of Gold’ identified overinvoicing and fraudulent acquisition of materials. Furthermore, the investigation revealed that the project’s final cost was 200% above the estimated market average. Plus, in some instances, purchased items never reached their final destination.”
Following, subjects on mayor’s High and Low social class conditions were presented with his short biography which included, among other features, hints on his social class (High vs. Low) through the description of his education level (bachelor and MBA abroad vs. high school degree with specialization), his parents’ profession (father:
manager in an multinational corporation / mother: Architect vs. father: driver / mother: informal saleswoman). Thus, social class manipulation comprised three aspects concerning the mayor’s and his family’s socioeconomic background: (i) affluence (contextual), (ii) educational attainment, and (iii) occupational prestige which collectively conveyed his social status. Plus, a photo was attached differentiating only the way he was dressing. Appendix A depicts the full content disclosed to participants in each condition.
Next, subjects answered on a Likert scale ranging from 1 (completely disagree) – 7 (completely agree) the question ‘In your opinion, is the mayor involved and has he personally benefited from the corruption scheme?’ (main DV).
Moreover, in the neutral setting, any information on the assessed politician was completely omitted from participants. Thereby, after reading the news, respondents were immediately asked on their evaluation of the mayor’s venality. Hence this condition serves as control.
Afterwards, respondents engaged in demographic questions on age, gender, ethnicity, education level, household size and, indicators concerning their estimated social class.
Mayor’s Picture Manipulation. Alongside the short biography, a picture of the
hypothetical politician was attached to the High/Low social status settings. The photo was manipulated accordingly. The same person was portrayed with formal (informal) attire and displayed in the High (Low) social class condition. Plus, pictures were black and white to avoid any possible confound driven by colors. Figure 1 displays the manipulated images.
Fig1. High and Low Social Class Politician
The baseline picture was drawn from Tribunal Superior Eleitoral’s (TSE) database, which provides profiles of political candidates since the 2004 elections depicting personal information (e.g. race, occupation, marital status, etc.) and a standardized photo.
Demographic analysis on the average politician occupying the Brazilian Chamber of Deputies shows that the typical legislator is male (85% of deputies), self-identify as white (80%) and is at his late forties (mean age is 49 years). 53 So, to shun possible effects driven from features deviating from the expected political profile voters bear in mind, the image sought was purposely of a white middle-aged male to ascertain that only social class was elicited through images.
3.1.2 – Participants’ Social Class
Objective Social Class. Subjects provided socioeconomic information about their
income and their parents’ profession. Following Kraus et al. (2009), the combination of these measures constitutes the Objective of Social Class. Parental education was coded into five categories (a) did not finish elementary school, (b) elementary school degree, (c) high school degree, (d) college degree and (e) post graduate degree. Participants classified parental education for both parents. Plus, family monthly income was coded into seven categories: (a) no income, (b) less than R$1,000, (c) R$1,001 – R$2,500, (d) R$2,501 – R$4,000, (e) R$4,001 – R$5,500, (f) R$ 5,501 – R$7,000, and (g) over R$ R$7,001.
Ratings for parental education were assigned a code number from 1 to 5, with higher numbers indicating greater educational attainment. Family household income was assigned a number from 1 to 7, with higher numbers indicating greater household income.
Lastly, family household income and parental education were standardized and then summed together to generate a composite measure of overall Objective Social Class. The scale presented high reliability (αObjSC = .82).
5 Globo: ‘Average Profile of elected Federal Deputies is male, White, married, and with college degree.’ Accessed on 11/01/2018.
https://g1.globo.com/politica/eleicoes/2018/eleicao-em-numeros/noticia/2018/10/21/perfil-medio-do-deputado-federal-eleito-e-homem-branco-casado-e-com-ensino-superior.ghtml
Subjective Social Class. Researchers have applied the MacArthur Scale of
Subjective Social Status to measure personal evaluation of one’s status in society relative to others (Adler et al., 2000; Cohen et al., 2008; Kraus et a., 2009).
For this procedure, a ladder with 10 rungs symbolizing society’s hierarchy was displayed. The highest step abstractly represents those with the highest status in socioeconomic stratification, that is, the ones who possess higher income, education and prestigious occupation. Conversely, the bottom rung depicts the underprivileged, those with the lowest income, education and least prestigious jobs. Subjective Social Class can be assessed in terms of one’s ranking perception within her local community or society as a whole.
For the purpose of this experiment, subjects were asked to place themselves on the rung on which they understood they belong to within their municipality. Each step of the ladder was assigned a number from 1 to 10, wherein higher numbers designated higher placement on the ladder, which depicts a greater level of subjective social class.
3.2 Sample
Recruitment happened via Facebook. The only constraint imposed on sample selection regarded age. In Brazil, vote is compulsory for citizens who are between 18 – 70 years old, therefore, in an attempt to more accurately mirror the average profile of the Brazilian electorate, only subjects whose age falls in the mandatory vote range were authorized to proceed in the experiment.
Respondents were asked to participate in an academic study about political behavior. A total of 365 people completed the questionnaire, however, 27 were excluded of the sample for answering “Yes” to the question “Do you recognize the politician in the picture?” in the Poor and Rich conditions. Thus, the final database comprises 338 participants. The majority of the sample is female (68%), self-identify as white (51%) and earn an average monthly income of R$ 1,962 (equivalent to 2.1 minimum wages as of 2018). Table 1 summarizes the descriptive statistics of the sample.
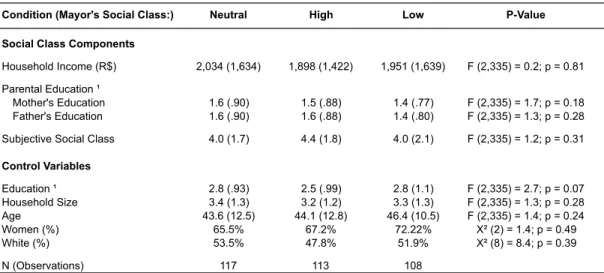
Table 1. Demographic Information of Participants Across Conditions
Notes: Standard deviation in parentheses.
Gender and ethnicity were computed based on chi-squares. The remaining statistics are based on Anova. ¹ Education: 1 = did not finish elementary school, 2= elementary school degree, 3 = high school degree, 4 = college degree and 5 = post graduate degree. Statistics based on standardized values.
Condition (Mayor's Social Class:) Neutral High Low P-Value
Social Class Components
Household Income (R$) 2,034 (1,634) 1,898 (1,422) 1,951 (1,639) F (2,335) = 0.2; p = 0.81 Parental Education ¹
Mother's Education 1.6 (.90) 1.5 (.88) 1.4 (.77) F (2,335) = 1.7; p = 0.18
Father's Education 1.6 (.90) 1.6 (.88) 1.4 (.80) F (2,335) = 1.3; p = 0.28
Subjective Social Class 4.0 (1.7) 4.4 (1.8) 4.0 (2.1) F (2,335) = 1.2; p = 0.31 Control Variables Education ¹ 2.8 (.93) 2.5 (.99) 2.8 (1.1) F (2,335) = 2.7; p = 0.07 Household Size 3.4 (1.3) 3.2 (1.2) 3.3 (1.3) F (2,335) = 1.3; p = 0.28 Age 43.6 (12.5) 44.1 (12.8) 46.4 (10.5) F (2,335) = 1.4; p = 0.24 Women (%) 65.5% 67.2% 72.22% X² (2) = 1.4; p = 0.49 White (%) 53.5% 47.8% 51.9% X² (8) = 8.4; p = 0.39 N (Observations) 117 113 108
4. Results and Discussion
4.1 Mayor’s Social Class and Perception of Corruption
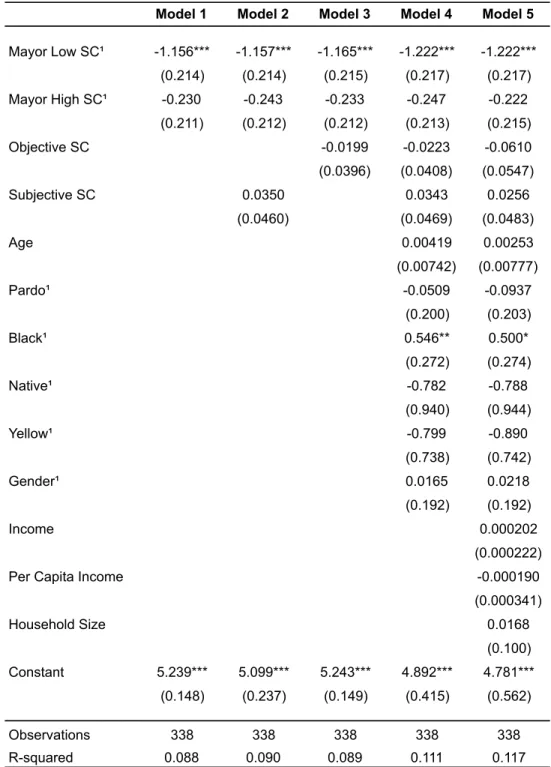
Regression models test the effects of mayor’s social class on voters’ evaluation. Comparisons have the Neutral group as baseline (M = 5.24). Analysis show that, on average, voters regard the upper class mayor (Model 1: M = 5.01, β= -0.23, p = 0.27) similarly to the Neutral condition whereas his lower class counterpart is deemed as less prone to venality (Model 1: M = 4.08, β= -1.16, p < 0.01), which supports hypothesis H1b. Findings are displayed on table 2. Moreover, even after controlling for participants’ objective and subjective social class along with other demographic measures, results remain significant indicating robustness.
Further, similar assessment in the High Social Class and Neutral frames suggest that voters’ made no distinction between the politician described in the High Social Class against the profile evoked in the Neutral condition. This evidence undergirds that the photo manipulation intent of reproducing the average politician in order to ensure that only socioeconomic status features would vary across High and Low conditions was successful. Still, evaluation was so closely tied because, aside from being white, male and middle-aged, the typical politician is also wealthy and has college degree, both measures that hint high social status. 64 Thus, when no information was provided concerning the mayor under evaluation, participants resorted to availability heuristics, and the median politician that readily comes to mind mirrors the profile characterized in the High Social Class condition.
Besides analogous appraisal in the Neutral (M = 5.24) and High (M = 5.01) frames, the assessed mayor significantly yielded greater culpability than in the Low condition (M = 4.08). Plus, in the 7-item Likert scale participants answered their judgment on the politician 4 corresponded to ‘Neither agree nor disagree’, therefore, on average, the mayor was reckoned guilty of misappropriation in the Neutral and High settings whereas
6 Globo: ‘Average Profile of elected Federal Deputies is male, White, married, and with college degree.’ Accessed on 11/01/2018.
https://g1.globo.com/politica/eleicoes/2018/eleicao-em-numeros/noticia/2018/10/21/perfil-medio-do-deputado-federal-eleito-e-homem-branco-casado-e-com-ensino-superior.ghtml
in the Low condition no preconceived condemnation (nor absolution) was attributed to him.
Table 2. Effects of Mayor’s Social Class on Voters’ Perception of Corruption
Notes: Standard deviation in parentheses. *** p<0.01, ** p<0.05, * p<0.1
Per Capita Income = household income / square root of household size ¹ Dummies. Baseline (d = 0): Race = White, Gender = Female.
Model 1 Model 2 Model 3 Model 4 Model 5
Mayor Low SC¹ -1.156*** -1.157*** -1.165*** -1.222*** -1.222*** (0.214) (0.214) (0.215) (0.217) (0.217) Mayor High SC¹ -0.230 -0.243 -0.233 -0.247 -0.222 (0.211) (0.212) (0.212) (0.213) (0.215) Objective SC -0.0199 -0.0223 -0.0610 (0.0396) (0.0408) (0.0547) Subjective SC 0.0350 0.0343 0.0256 (0.0460) (0.0469) (0.0483) Age 0.00419 0.00253 (0.00742) (0.00777) Pardo¹ -0.0509 -0.0937 (0.200) (0.203) Black¹ 0.546** 0.500* (0.272) (0.274) Native¹ -0.782 -0.788 (0.940) (0.944) Yellow¹ -0.799 -0.890 (0.738) (0.742) Gender¹ 0.0165 0.0218 (0.192) (0.192) Income 0.000202 (0.000222)
Per Capita Income -0.000190
(0.000341) Household Size 0.0168 (0.100) Constant 5.239*** 5.099*** 5.243*** 4.892*** 4.781*** (0.148) (0.237) (0.149) (0.415) (0.562) Observations 338 338 338 338 338 R-squared 0.088 0.090 0.089 0.111 0.117
Additionally, statistical examination further reinforces that voters ascribed no significant distinction between ‘4 - Neither agree nor disagree’ to the mayor in the Low Social Class frame (t(107) = 0.55, p = 0.58). Conversely, in Neutral (t(116) = 8.11, p < 0.01) and High Social Class (t(112) = 6.77, p < 0.01) settings, the mayor was significantly perceived as susceptible to act on misdeeds. Hence, the baseline politician that voters hold in their minds is also corrupt. Concerning elected officials, voters’ association between belonging to higher social strata and being corrupt has become so ingrained, that, all else constant, just by changing the politician’s socioeconomic background evaluations soften, and he is granted the benefit of the doubt.
Surprisingly, a dummy variable discerning subjects who self-identified as black also reaches significance (Model 4: β = 0.55, p = 0.04). The positive coefficient implies that, on average, black subjects assume that the mayor is more inclined to commit malfeasance than subjects from distinct ethnicities do. Perhaps, an explanation lies in interracial friction since the politician exhibited in the High/Low Social Class conditions as well as the average politician’s image conjured up in the Neutral setting would most likely be judged as a white individual. Further, the effect becomes marginally significant (Model 5: p = 0.07) once socioeconomic variables (Income, Per Capita Income, and Household Size) are accounted for, this mitigated impact is probably due to the persistent high correlation between being poor and belonging to the black community in Brazil.75
Research on interracial bias show that one more readily links aversive stimuli to individuals whose race differs from one’s own (Olsson et al., 2005). Since corruption’s is widely regarded as immoral, perhaps this hasty association contributes to voters’ assessment of a politician’s venality when she is from a different ethnicity.
Altogether, these findings provide evidence that, indeed, social status affects citizens’ evaluation of an elected official’s probity. The underlying mechanism lies in the social norms domain. In a country rife with corruption scandals, the political class, which is usually comprised of rich individuals, has become indelibly tainted by improbity. Thereby, a politician who deviates from the average political profile (i.e. is not upper-class) escapes social norm evaluation (i.e. is not deemed as venal).
7 Exame: ‘The Size of Race Inequality in Brazil depicted in a Graph’. Accessed on 11/2/2018.
4.2 Voters’ Social Class and Perception of Corruption
Regression models test whether subjects’ social class affect their evaluation of mayor’s integrity. For this analysis Objective and Subjective Social Class scales are treated as continuous variables. Also, comparisons have the High Social Class condition as baseline. Since my interest lies in understanding how voters’ own socioeconomic status interacts with the politicians’ social class membership, the following examination concentrates in contrasting High and Low Social Class conditions. Further, to address whether subjects judgment is affected by an ingroup bias, an assumption is that effects engendered by social class membership may only arise when the mayor is explicitly described, otherwise the politician’s profile does not emerge to participants’ conscious mind, therefore not eliciting any feeling of shared social identity between voter and politician, therefore evaluations in the Neutral condition are no longer examined.
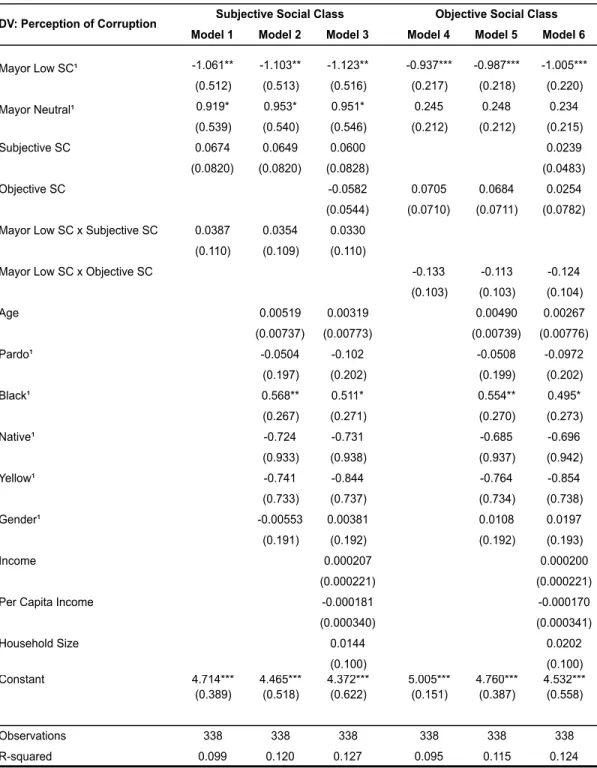
Analysis show that voters’ from distinct socioeconomic positions do not significantly differ in their assessment of mayor’s venality. Regardless of the scale employed, the interaction term falls short from significance (Subjective SC: Model 1 p = 0.17; Objective SC: Model 4 p = 0.20), which fails to support hypothesis H2. Findings are exhibited on table 3 (below).
Also, Median Split - dividing the sample in below/above SC scales measures’ average - and Spotlight Analysis - regressions of SC measures plus/minus 1SD on the DV - were conducted confirming the findings (Appendix B and C).
Notably, the lower class politician was appraised as less willing to misbehave regardless of participants’ social class scale (Objective or Subjective) and across all spectrum of social status, further supporting findings in the previous sections. Besides, a dummy variable indicating whether subjects self-identify as black remains a significant predictor in this design, even after controlling for demographics socioeconomic variables.
Table 3. Effects of Voters’ and Mayor’s SC on Perception of Corruption
Notes: Standard deviation in parentheses. *** p<0.01, ** p<0.05, * p<0.1
Per Capita Income = household income / square root of household size ¹ Dummies. Baseline (d = 0): Race = White, Gender = Female.
Subjective Social Class Objective Social Class Model 1 Model 2 Model 3 Model 4 Model 5 Model 6
Mayor Low SC¹ -1.061** -1.103** -1.123** -0.937*** -0.987*** -1.005*** (0.512) (0.513) (0.516) (0.217) (0.218) (0.220) Mayor Neutral¹ 0.919* 0.953* 0.951* 0.245 0.248 0.234 (0.539) (0.540) (0.546) (0.212) (0.212) (0.215) Subjective SC 0.0674 0.0649 0.0600 0.0239 (0.0820) (0.0820) (0.0828) (0.0483) Objective SC -0.0582 0.0705 0.0684 0.0254 (0.0544) (0.0710) (0.0711) (0.0782) Mayor Low SC x Subjective SC 0.0387 0.0354 0.0330
(0.110) (0.109) (0.110)
DV: Perception of Corruption
Mayor Low SC x Objective SC -0.133 -0.113 -0.124
(0.103) (0.103) (0.104) Age 0.00519 0.00319 0.00490 0.00267 (0.00737) (0.00773) (0.00739) (0.00776) Pardo¹ -0.0504 -0.102 -0.0508 -0.0972 (0.197) (0.202) (0.199) (0.202) Black¹ 0.568** 0.511* 0.554** 0.495* (0.267) (0.271) (0.270) (0.273) Native¹ -0.724 -0.731 -0.685 -0.696 (0.933) (0.938) (0.937) (0.942) Yellow¹ -0.741 -0.844 -0.764 -0.854 (0.733) (0.737) (0.734) (0.738) Gender¹ -0.00553 0.00381 0.0108 0.0197 (0.191) (0.192) (0.192) (0.193) Income 0.000207 0.000200 (0.000221) (0.000221)
Per Capita Income -0.000181 -0.000170
(0.000340) (0.000341) Household Size 0.0144 0.0202 (0.100) (0.100) Constant 4.714*** 4.465*** 4.372*** 5.005*** 4.760*** 4.532*** (0.389) (0.518) (0.622) (0.151) (0.387) (0.558) Observations 338 338 338 338 338 338 R-squared 0.099 0.120 0.127 0.095 0.115 0.124
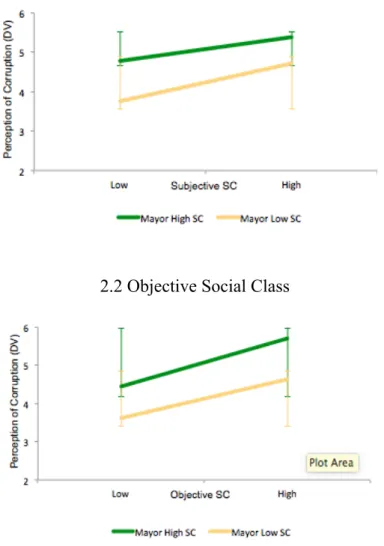
Furthermore, graphic portrayal of the interaction between participants’ Subjective SC and the politician’s social class suggests a trend similar to what was posited on H2b, congruent with ingroup bias. That is, subjects whose self-reported identification lies with low ranks of social status were more lenient in their evaluation of the Low SC mayor, thereby reckoning him as less prone to misconduct than the politician in the High SC condition. However, as participants’ status improves, mayor’s evaluation in the Low SC becomes more severe. Moreover, in the High SC condition this trend lightens and the divergence in subjects’ evaluation narrows. Graphics are displayed on Figure 2.
Fig 2. Effects of Subjects’ Subjective and Objective SC on Mayor’s Evaluation 2.1 Subjective Social Class
2.2 Objective Social Class
Nonetheless, when analysis relies on subjects’ Objective SC, the trend in the High SC condition is accentuated, as subjects’ status enhances their appraisal of mayor’s improbity sharpens. Since income and education level are commonly associated, it could be that more educated individuals have deeper internalized the connection between being a rich politician and being a corrupt politician, therefore heightening the contrast when the mayor is portrayed as belonging to low social class strata. Consequently, the disparity between corruption assessments widen as participants’ Objective social class increases.
How to reconcile such contradictory findings? Primarily, Subjective and Objective SC are barely correlated (r = 0.18) with one another, which is an indication of discrepancy between participants’ monetary resources and how they feel about their ranking in society. Perhaps, inequality is a critical factor when analyzing one’s own position in society, in a way that poor people who live relatively well in impoverished areas transcended this feeling to the Subjective SC scale. Conversely, middle- and upper-class citizens who live among even wealthier individuals may feel as if they are not so well off. For instance, when asked about their income, subjects who reported ‘Between R$ 4,001 and R$ 5,500’, on average, scored 5.7 whereas those who declared ‘Over R$ 7,001’, the highest range of income, rated themselves as 5 on the Subjective SC.
Moreover, research has shown that Subjective SC is a stronger predictor for bodily and physiological health, highlighting its crucial role in shaping one’s social status identity (Kraus et al., 2011). Thus, how one feels about their position in society might be determinant on political evaluation despite one’s financial resources.
Reinforcing this interpretation, although not the focus of this discussion, Neutral condition yielded marginally significant coefficients (Table 3) when analyzing the Subjective Social Class dimension. Spotlight analysis (Appendix C) suggests that subjects whose self-placement is +1SD above average deemed the politician in the High social class condition as less venal than the appraisal in Neutral setting. Such effect could hint at ingroup bias, in the sense that subjects who regard themselves as more privileged showed leniency towards an explicitly upper class mayor while depriving an otherwise equal, though implicitly, upper class mayor of similar mercy.
Overall, findings do not support H2. Divergence in findings once social class dimension is shifted hinders any resolution regarding the underlying mechanism
clarifying how voters’ and politicians’ socioeconomic status interaction may affect perception of corruption.
Still, the sample drawn was clustered around the low extreme of social class measures, histograms are displayed in Appendix D. Such imbalance could be detrimental for this analysis, which ideally would have subjects distributed across high and low bounds of social class. Consequently, sample selection may have contributed to coefficients in H2 coming near significance, though not reaching it.
5. Conclusion
Does a politician’s social class affect voters’ appraisal of her honesty? To explore this inquiry I conducted an experimental analysis in which a fictional account of an unveiled corruption scheme in a municipal administration was presented to all participants. Ensuing, subjects were randomized into either learning about the mayor’s socioeconomic status (High or Low) or into no information at all. The main DV derived from evaluations regarding the public official culpability concerning the scenario described.
The main hypothesis is supported. A politician’s social status does affect voters’ evaluation of her probity. Behavioral mechanisms concerning social norms and availability bias mostly account for the underlying reasoning. Findings imply that, in the Brazilian context, being an upper-class politician is tantamount to being a dishonest politician. Because of the pervasive corruption embedded into the political system alongside with the fact that the prototypical politician is from higher socioeconomic strata, such connection has the potential to benefit a crooked lower class politician with no preceding assumption of guilt while condemning an honest upper class politician as presumably unscrupulous. These results may be generalizable to similar contexts.
Moreover, statistical examination fails to provide evidence that voters’ and politicians’ social class interaction exert influence on perception of corruption. However, further investigation is necessary to disentangle the divergent results contingent on which dimension of social class (Subjective or Objective) is employed on the analysis.
Interestingly, self-identifying as black was a significant predictor of corruption perception across all designs analyzed.
The main limitation of this study’s design concerns external validity of findings. Additionally, the sample is representative of voting population in terms of age and education level.86 However, it is not representative when it comes to gender and race.
Future research should address how these findings may impact citizens’ decision making process, ultimately affecting their choice about which politician they will cast their vote for.
8 Globo: ‘SP representes 22,4% of Brazil’s electorate; majority of voters is female.’ Accessed on 2/11/2018. https://g1.globo.com/sp/sao-paulo/noticia/2018/08/01/sp-representa-224-do-eleitorado-do-brasil-maioria-dos-eleitores-e-mulher.ghtml
REFERENCES
Anderson, C.J., Tverdova, Y.V., 2003. Corruption, political allegiances, and attitudes
toward government in contemporary democracies. American Journal of Political Science
47 (1), 91–109.
Anduiza, E., Gallego, A., Munoz, J., 2013. Turning a blind eye: experimental evidence of
Partisan Bias in attitudes towards corruption. Comparative Political Studies. 46 (12):
1664-1692.
Aquino, K., Freeman, D., Reed, A., II, Felps W., Lim, V.K. 2009. Testing a
social-cognitive model of moral behavior: The interactive influence of situations and moral identity centrality. Journal of Personality and Social Psychology 97:123–141.
Argyle, M. 1994. The psychology of social class. London, England: Routledge.
Aries, E., & Seider, M. 2007. The Role of Social Class in the Formation of Identity: A
Study of Public and Elite Private College Students. The Journal of Social Psychology,
147(2), 137–157.
Banerjee, Ritwik, (2016), On the interpretation of bribery in a laboratory corruption game: moral frames and social norms. Experimental Economics, 19, issue 1, p. 240-267. Barr, A., & Serra, D. (2010). Corruption and culture: An experimental analysis. Journal of Public Economics, 94(11-12), 862–869.
Basinger S. J. 2012. Scandals and congressional Elections in the Post-Watergate Era. Political Research Quarterly. 66 (2): 385-398
Becker, G., 1968. Crime and punishment: an economic approach. Journal of Political Economy 76, 169–217.
Bilsker, D., Schiedel, D., Marcia, J. E. 1988. Sex differences in identity status. Sex Roles, 18, 231–236.
Blascovich, J., Mendes, W. B., Hunter, S. B., Lickel, B., and Kowai-Bell, N. (2001).
Perceiver threat in social interactions with stigmatized others. Journal of personality and
social psychology, 80(2):253.
Brady, H., and Sniderman, P. 1985. Attitude Attribution: A Group Basis for Political
Reasoning. American Political Science Review 79: 1061–78.
Brollo, F. 2008. Who Is Punishing Corrupt Politicians: Voters or the Central
Government? Evidence from the Brazilian Anticorruption Program. IGIER working
Brollo, F. (2012). Why Do Voters Punish Corrupt Politicians? Evidence from the Brazilian Anti-Corruption Program. SSRN Electronic Journal. 10.2139/ssrn.2141581. Brown, Rupert. (2000). Social Identity Theory: Past Achievements, Current Problems and Future Challenges. European Journal of Social Psychology. 30. 745-778.
Campbell, R., & Cowley, P. 2013. Rich Man, Poor Man, Politician Man: Wealth Effects
in a Candidate Biography Survey Experiment. The British Journal of Politics and
International Relations, 16(1), 56–74.
Carnes, N., and Lupu, N. 2016. Do Voters Dislike Working-Class Candidates? Voter
Biases and the Descriptive Underrepresentation of the Working Class. American
Political Science Review. 110(4): 832-844
Carnes, N., and Sadin, M. L. (2015). The “Mill Worker’s Son” Heuristic: How Voters
Perceive Politicians from Working-Class Families—and How They Really Behave in Office. The Journal of Politics, 77(1), 285–298.
Caprara, G. V., Vecchione, M., Barbaranelli, C., Fraley, R. C. (2007). When Likeness
Goes With Liking: The Case of Political Preference. International Society of Political
Psychology, 28 (5): 609–632.
Cohen, S., Alper, C.M., Doyle, W.J., Adler, N., Treanor, J.J., & Turner, R.B. (2008).
Objective and subjective socioeconomic status and susceptibility to the common cold.
Health Psychology, 27, 268–274.
Cohen, G. L., & Steele, C. M. 2002. A barrier of mistrust: How negative stereotypes
affect cross-race mentoring. Improving academic achievement: Impact of Psychological
Factors on Education, 303-327.
Henneberg, S. C., and Chen, Y. 2008. Celebrity Political Endorsement, Journal of Political Marketing, 6:4, 1-31.
Davis, C.L., Ai Camp, R., Coleman, K.M., 2004. The influence of party systems on
citizens’ perceptions of corruption and electoral response in Latin America. Comparative
Political Studies 37, 677–703.
Dimock, M. A., Jacobson, G. C. 1995. Checks and Choices: The House Bank Scandal’s
Impact on Voters in 1992. The Journal of Politics, 57 (4): 1143- 1159.
de Ferranti, D., Perry, G. E., Ferreira, F., and Walton, M. 2004. Inequality in Latin
America: Breaking with History? Washington, D.C.: World Bank.
Ferraz C., and Finan, F. 2008. Exposing Corrupt Politicians: The Effects of Brazil's
Publicly Released Audits on Electoral Outcomes. The Quarterly Journal of Economics,
Ferraz, C., and Finan, F. 2011. Electoral Accountability and Corruption: Evidence from
the Audits of Local Governments. American Economic Review, 101 (4): 1274-1311.
Fisman, R., Miguel, E., 2007. Corruption, norms, and legal enforcement: evidence from diplomatic parking tickets. Journal of Political Economy 115 (6), 1020–1048.
Frable, D. E. S. 1997. Gender, racial, ethnic, sexual, and class identities. Annual Review of Psychology, 48, 139–162.
Fried, B. J., Lagunes, P., Venkataramani, A. 2010. Corruption and Inequality at the
Crossroad: A Multimethod Study of Bribery and Discrimination in Latin America. Latin
America Research Review, 45: 76–97.
Gatti, R., Paternostro, S., and Rigolini, J. 2003. Individual Attitudes towards Corruption:
Do Social Effects Matter? World Bank Policy Research Working Paper. Washington,
D.C.: World Bank.
Giatti, L.; Camelo, L.; Rodrigues, J. and Barreto, S. (2012). Reliability of the MacArthur scale of subjective social status - Brazilian Longitudinal Study of Adult Health (ELSA-Brasil). BMC public health. 12. 1096.
Glaeser, E. L., Scheinkman, J., and Shleifer, A. 2003. The Injustice of Inequality. Journal of Monetary Economics 50: 199–222.
Guerrero, M. A., & Rodríguez-Oreggia, E. 2008. On the individual decisions to commit
corruption: A methodological complement. Journal of Economic Behavior &
Organization, 65(2), 357–372.
Hechter, M. 1990. The Attainment of Solidarity in Intentional Communities. Rationality and Society, 2 (2), 142–55
Horwitz, S. R., Shutts, K., & Olson, K. R. (2014). Social class differences produce social group preferences. Developmental science, 17(6), 991-1002.
Hunt, J. 2007. How Corruption Hits People When They Are Down. Journal of Development Economics, 84 (2): 574–589.
Hunt, J., and Laszlo, S. 2006. Bribery: Who Pays, Who Refuses, What Are The
Payoffs? Departmental Working Papers 2006-06, McGill University, Department of
Economics.
Iacoviello, V., Berent, J. & Frederic, N. S. & Pereira, A. (2017). The Impact of Ingroup Favoritism on Self-Esteem: A Normative Perspective. Journal of Experimental Social Psychology. 71. 31-41.
Kaufmann, D. 1997. Corruption: The Facts. Foreign Policy, 107: 114−131
Klašnja, M., Tucker, J., & Deegan-Krause, K. (2016). Pocketbook vs. Sociotropic Corruption Voting. British Journal of Political Science, 46(1), 67-94.
Klasnja, M. 2017. Uninformed Voters and Corrupt Politicians. American Politics Research. 45 (2): 256-279
Klein, O., & Azzi, A. E. (2001). The strategic confirmation of meta‐stereotypes: How
group members attempt to tailor an outgroup's representation of themselves. British
Journal of Social Psychology, 40(2), 279-293.
Kraus M. W., Piff P. K., Keltner D. (2009). Social class, sense of control, and social
explanation. Journal of personality and social psychology. 97. 992-1004.
Kraus, M. W., Piff, P. K., & Keltner, D. (2011). Social Class as Culture: The Convergence of Resources and Rank in the Social Realm. Current Directions in
Psychological Science, 20(4), 246–250.
Kraus, M. W., Piff, P. K., Mendoza-Denton, R., Rheinschmidt, M. L., and Keltner, D. 2012. Social class, solipsism, and contextualism: how the rich are different from the
poor. Psychological review, 119(3):546.
Krosnick, J. A., and Brannon, L. A. 1993. The Impact of the Gulf War on the Ingredients
of Presidential Evaluations: Multidimensional Effects of Political Involvement. American
Political Science Review 87 (4):963–75.
Lagunes, P. 2009. Irregular Transparency? An Experiment Involving Mexico’s Freedom
of Information Law. Working paper, Department of Political Science, Yale University.
Accessed October 19, 2018, at
http://unpan1.un.org/intradoc/groups/public/documents/un-dpadm/unpan041537.pdf. Lareau, A. 2003. Unequal childhoods: Class, race, and family life. Berkeley, CA: University of California Press.
Lavallee, E., Razafindrakoto, M., Roubaud, F. 2008. Corruption and Trust in Political
Institutions in Sub-saharan Africa. Afrobarometer Working Paper No. 102.
Lea, S., & Webley, P. 2006. Money as tool, money as drug. Behavioral Brain Science. 29: 161-209
Lewicki, R. J. 1984. “Lying and Deception: A Behavioral Model,” in Negotiation in Organizations, Max H. Bazerman and Roy J. Lewicki, eds. Beverly Hills, CA: Sage Publications, 68–90.
Mauro, P. 1995. Corruption and Growth. Quarterly Journal of Economics. 110 (3): 681-712.
Mishler, W., and Rose, R. 2001. What are the Origins of Political Trust? Testing
Institutional and Cultural Theories in Post-Communist Societies. Comparative Political
Studies. 34(1): 30-62.
Morris, S. D., and Klesner, J. L. 2010. Corruption and Trust: Theoretical Considerations
and Evidence from Mexico. Comparative Political Studies. 43(10): 1258-1285.
Nagengast, C., & Kearney, M. 1990. Mixtec Ethnicity: Social Identity, Political
Consciousness, and Political Activism. Latin American Research Review, 25(2), 61-91.
Negy, C., Shreve, T. L., Jensen, B. J., & Uddin, N. 2003. Ethnic Identity, Self-Esteem,
and Ethnocentrism: A Study of Social Identity Versus Multicultural Theory of Development. Cultural Diversity and Ethnic Minority Psychology, 9(4), 333–344.
Nisbett, R. 2008. Intelligence and how to get it: Why schools and cultures count. New York, NY: Norton.
Nye, J. S. 1967 Corruption and Political Development: A Cost-Benefit Analysis. American Political Science Review 61 (2): 417–427.
Olsson, A., Ebert, J., Banaji, M., & Phelps, E. (2005). The Role of Social Groups in the Persistence of Learned Fear. Science,309(5735), 785-787.
Piff, P. K. (2013). Wealth and the Inflated Self. Personality and Social Psychology
Bulletin, 40(1), 34–43.
Piff, P. K., Stancato, D. M., Cote, S., Mendoza-Denton, R., & Keltner, D. 2012. Higher
social class predicts increased unethical behavior. Proceedings of the National Academy
of Sciences, 109(11), 4086–4091.
Rudman, L. A., & Goodwin, S. A. (2004). Gender Differences in Automatic In-Group
Bias: Why Do Women Like Women More Than Men Like Men? Journal of Personality
and Social Psychology, 87(4), 494–509.
Samuels, D. J. and Zucco, C. (2013). Using facebook as a subject recruitment tool for
survey-experimental research. Available at SSRN 2101458.
Seligson, M.A., 2002. The impact of corruption on regime legitimacy: a comparative
study of four Latin American countries. The Journal of Politics 64, 408–433.
Steinel, W., De Dreu, C.K.W. 2004. Social motives and strategic misrepresentation in social decision making. Journal of Personality and Social Psychology 86:419–434.
Sweeney, M. M., & Cancian, M. 2004. The changing importance of White women’s
economic prospects for assortative mating. Journal of Marriage and Family, 66, 1015–
1028.
Tajfel, H. 1982. Social psychology of intergroup relations. Annual Review of Psychology, 33(1), 1-39.
Tajfel, H., & Turner, J. C. 1979. "An integrative theory of intergroup conflict". In W. G. Austin & S. Worchel. The social psychology of intergroup relations. Monterey, CA: Brooks/Cole. 33–47.
Tajfel, H., and Turner, J.C. 1986. The social identity theory of intergroup behavior. In Psychology of Intergroup Relations. Worchel S, Austin W (eds). Nelson Hall: Chicago, 7-24.
Taylor, D. M., & Jaggi, V. 1974. Ethnocentrism and Causal Attribution in a South Indian
Context. Journal of Cross-Cultural Psychology, 5(2), 162–171.
Todorov, A., Mandisodza, A.N., Goren, A., & Hall, C.C. 2005. Inferences of competence
from faces predict election outcomes. Science, 308, 1623–1626
Treisman, D. 2000. The Causes of Corruption: A Cross National Study. Journal of Public Economics 76: 399–457.
Turner, J. C. 1982. Towards a cognitive redefinition of the social group. Social Identity and Intergroup Relations, 15-40.
Wang, C.-H. (2015). Government Performance, Corruption, and Political Trust in East
Asia. Social Science Quarterly, 97(2), 211–231.
Welch S., and Hibbing J. R. 1997. The Effects of Charges of Corruption on Voting
Behavior in Congressional Elections, 1982-1990. The Journal of Politics 59 (1): 226-239.
Ysseldyk, R., Matheson, K., & Anisman, H. 2010. Religiosity as Identity: Toward an
Understanding of Religion From a Social Identity Perspective. Personality and Social
Appendix A
Mayor’s short biography Rich
João, prefeito local, concluiu sua graduação e MBA nos Estados Unidos. Seu pai, Octávio, é Diretor de uma empresa multinacional e sua mãe, Helena, é Arquiteta. Como prefeito, João há 3 anos se dedica a vida pública.
João, local mayor, finished his bachelor and MBA in the United States. His father, Octávio, is in the board of directors of a multinational company and his mother, Helena, is an architect. As mayor, João has dedicated himself to public life for 3 years.
_____________________________________________________________________
Poor
João, prefeito local, concluiu o ensino médio com especialização técnica. Seu pai, Carlos, é motorista e sua mãe, Maria, é vendedora informal de cosméticos. Como prefeito, João há 3 anos se dedica a vida pública.
João, local mayor, finished high school with specialization. His father, Carlos, is a driver, and his mother, Maria, is an informal cosmetics saleswoman. As mayor, João has dedicated himself to public life for 3 years.
Appendix B
Median Split Analysis (H2)
Notes: Standard deviation in parentheses. *** p<0.01, ** p<0.05, * p<0.1
Per Capita Income = household income / square root of household size ¹ Dummies. Baseline (d = 0): Race = White, Gender = Female.
² Dummy. Baseline (d = 0) those whose score on Subjective SC is below average. 3 Dummy. Baseline (d = 0) those whose score on Objective SC is below average.
Subjective Social Class Objective Social Class
Model 1 Model 2 Model 3 Model 4 Model 5 Model 6
Mayor Low SC¹ -0.907*** -0.976*** -1.013*** -0.868*** -0.940*** -0.944*** (0.284) (0.286) (0.288) (0.276) (0.279) (0.280) Mayor Neutral¹ 0.500* 0.483* 0.460 0.454 0.478* 0.465 (0.283) (0.285) (0.287) (0.279) (0.282) (0.283) Subjective SC² 0.374 0.318 0.293 0.0280 (0.302) (0.303) (0.307) (0.0484) Objective SC³ -0.0583 0.165 0.147 0.0928 (0.0545) (0.305) (0.307) (0.326)
Mayor Low SC x Subjective SC 0.0493 0.0867 0.101
(0.439) (0.439) (0.441)
DV: Perception of Corruption
Mayor Low SC x Objective SC -0.123 -0.0276 -0.0671
(0.448) (0.451) (0.453) Age 0.00421 0.00235 0.00363 0.00275 (0.00736) (0.00774) (0.00748) (0.00782) Pardo¹ -0.0240 -0.0779 -0.0502 -0.0818 (0.197) (0.202) (0.199) (0.202) Black¹ 0.569** 0.509* 0.592** 0.556** (0.267) (0.272) (0.274) (0.277) Native¹ -0.700 -0.718 -0.728 -0.748 (0.935) (0.940) (0.942) (0.946) Yellow¹ -0.706 -0.813 -0.713 -0.775 (0.735) (0.740) (0.741) (0.744) Gender¹ 0.0162 0.0257 0.0192 0.0223 (0.192) (0.193) (0.192) (0.193) Income 0.000207 0.000174 (0.000221) (0.000219)
Per Capita Income -0.000193 -0.000200
(0.000340) (0.000342) Household Size 0.0148 0.0170 (0.0999) (0.101) Constant 4.833*** 4.633*** 4.540*** 4.937*** 4.595*** 4.543*** (0.207) (0.405) (0.535) (0.201) (0.454) (0.593) Observations 338 338 338 338 338 338 R-squared 0.098 0.118 0.125 0.093 0.116 0.121