i
APPLYING TEXT MINING TECHNIQUES TO FORECAST
THE STOCK MARKET FLUCTUATIONS OF LARGE IT
COMPANIES WITH TWITTER DATA
Descriptive and predictive approaches to enhance
the research of stock market predictions with textual
and semantic data
Christos Zois
Project proposal presented as partial requirement for
i
NOVA Information Management School
Instituto Superior de Estatística e Gestão de Informação
Universidade Nova de LisboaAPPLYING TEXT MINING TECHNIQUES TO FORECAST THE STOCK
MARKET FLUCTUATIONS OF LARGE IT COMPANIES WITH TWITTER
DATA
Descriptive and predictive approaches to enhance the research of
stock market predictions with textual and semantic data
By Christos Zois
Project proposal presented as partial requirement for obtaining the Master’s degree in Information Management, with a specialization in Information Systems and Technologies Management
Advisor / Co Advisor: Professor Doctor Roberto Henriques Co Advisor: Professor Doctor Mauro Castelli
ii
ABSTRACT
This research project applies advanced text mining techniques as a method to predict stock market fluctuations by merging published tweets and daily stock market prices for a set of American Information Technology companies. This project executes a systematical approach to investigate and further analyze, by using mainly R code, two main objectives: i) which are the descriptive criteria, patterns, and variables, which are correlated with the stock fluctuation and ii) does the single usage of tweets indicate moderate signal to predict with high accuracy the stock market fluctuations. The main supposition and expected output of the research work is to deliver findings about the twitter text significance and predictability power to indicate the importance of social media content in terms of stock market fluctuations by using descriptive and predictive data mining approaches, as natural language processing, topic modelling, sentiment analysis and binary classification with neural networks.
iii
KEYWORDS
Text Mining; Data Mining; Predictive Model; Topic Modelling; Stock Market; Social Media Analysis; Binary Classification
iv
INDEX
1.
Introduction ... 1
1.1.
Research context and Problem Identification ... 2
1.2.
Definition of research questions and project goal ... 3
2.
Study relevance and importance... 4
2.1.
Project objectives ... 4
2.2.
Research Methodology... 5
3.
Literature review ... 7
3.1.
Fundamentals of data mining ... 7
3.1.1.
Data structures and data types ... 8
3.1.2.
Data mining and Machine Learning... 9
3.2.
Predictive modeling and Classification algorithms ... 10
3.2.1.
Classification and Regression Trees... 10
3.2.2.
Logistic Regression... 11
3.2.3.
Neural Networks ... 11
3.3.
Fundamentals of text mining... 12
3.3.1.
Data preprocessing in text mining... 12
3.3.2.
Sentiment analysis ... 14
3.3.3.
Latent Dirichlet Allocation ... 15
3.3.4.
Limitations with text mining ... 16
3.4.
Stock market and predictive capabilities ... 17
3.5.
Reference projects in text mining for stock predictions ... 18
3.6.
Applied R Libraries ... 19
4.
Project Methodology and Execution ... 20
4.1.
Data Preprocessing ... 21
4.1.1.
Extract and Preprocess the Data into R Studio ... 21
4.1.2.
Explore Data Issues and apply Data Cleaning... 21
4.1.3.
Preprocessed Data Set... 24
4.2.
Data exploration ... 24
4.2.1.
Examination of continuous variables ... 25
4.2.2.
Examination of Outliers ... 26
4.2.3.
Examination of categorical variables... 28
4.2.4.
Exploration of the text variable ... 33
v
4.3.
Data Modification and Feature Engineering ... 39
4.3.1.
Modification and Transformation of the Data Set ... 39
4.3.2.
Final exploration and modification of the data set ... 47
4.3.3.
Extracted Features and final Data Set ... 48
4.4.
Machine Learning Classification ... 49
4.4.1.
Model Selection for Binary Classification Problems... 49
4.4.2.
Data Partition... 51
4.4.3.
Feature Selection ... 52
4.4.4.
Binary Classification with Neural Networks ... 56
4.4.5.
Model Evaluation... 59
5.
Conclusion ... 62
5.1.
Answer to the research questions... 63
5.2.
Limitations and future work ... 65
6.
Bibliography ... 67
vi
LIST OF FIGURES
Figure 1 – Elon Musks tweet on Teslas bankruptcy ... 2
Figure 2 – Graphical representation of research methodology and project structure ... 6
Figure 3 –Graphical representation of the CRISP model... 8
Figure 4 – Phenomenon of underfitting and overfitting ... 9
Figure 5 – Illustration of a decision tree... 10
Figure 6 – Illustration of a logistic regression ... 11
Figure 7 – Representation of Neural Networks... 12
Figure 8 – Stages of text mining stemming techniques ... 13
Figure 9 – Dirichilet Distributions after first iteration ... 16
Figure 10 – Dirichilet Distributions after multiple iterations ... 16
Figure 11 – Methodology and structure of present project work ... 20
Figure 12 –Data model for the present project ... 22
Figure 13 – Pearson correlation before the data modification... 26
Figure 14 – Boxplots indicate outliers ... 27
Figure 15 – Boxplots for length of tweets ... 27
Figure 16 – Outliers with heavy content ... 27
Figure 17 – Wordcloud of threshold outliers ... 28
Figure 18 – Screenshot of largest tweet with over 9.000 characters ... 28
Figure 19 – Distribution of variable Increase based on company ... 30
Figure 20 – Count of variable increase ... 30
Figure 21 – Distribution of variable Increase based on length of the tweets ... 30
Figure 22 – Distribution of Increase through date for Oracle ... 31
Figure 23 - Distribution of Increase through date for Amazon ... 31
Figure 24 - Distribution of Increase through date for Facebook... 31
Figure 25 - Distribution of Increase through date for Apple ... 31
Figure 26 - Distribution of Increase through date for Google... 31
Figure 27 - Distribution of Increase through date for Microsoft ... 31
Figure 28 – Oracle tweets frequencies for each hour per day... 32
Figure 29 – Amazon tweets frequencies for each hour per day ... 32
Figure 30 – Facebook tweets frequencies for each hour per day... 32
Figure 31 – Apple tweets frequencies for each hour per day ... 32
Figure 32 – Google tweets frequencies for each hour per day... 32
Figure 33 – Microsoft tweets frequencies for each hour per day ... 32
vii
Figure 35 – Count of increased values by trading hours ... 33
Figure 36 – Word cloud for the final data frame ... 34
Figure 37 – Frequency table of most frequent words... 34
Figure 38 – Distribution of Duplicates within companies ... 34
Figure 39 – Distribution of duplicates ... 34
Figure 40 – LDA and top features Results for Oracle ... 35
Figure 41 – LDA and top features results for Microsoft ... 35
Figure 42 – LDA and top features results for Apple ... 35
Figure 43 – LDA and top features results for Google ... 35
Figure 44 – LDA and top features results for Amazon ... 35
Figure 45 – LDA and top features results for Facebook ... 35
Figure 46 – Top 10 words of Oracle ... 36
Figure 47 – Top 10 words of Microsoft ... 36
Figure 48 – Top 10 words of Apple... 36
Figure 49 – Top 10 words of Google ... 36
Figure 50 – Top 10 words of Amazon ... 36
Figure 51 – Top 10 words of Facebook ... 36
Figure 52 – Word-topic probabilities for Oracle ... 37
Figure 53 – Word-topic probabilities for Microsoft ... 37
Figure 54 – Word-topic probabilities for Google ... 37
Figure 55 – Word-topic probabilities for Apple ... 37
Figure 56 – Word-topic probabilities for Amazon... 37
Figure 57 – Word-topic probabilities for Facebook ... 37
Figure 58 – Polarity histogram ... 39
Figure 59 – Proportion of increased values by subsetting trading hours ... 40
Figure 60 – Proportion of increased values by subsetting companies ... 40
Figure 61 – Density of sentiment analysis with the package qdap ... 44
Figure 62 – Boxplots of sentiment analysis with the package qdap ... 44
Figure 63 – Polarity histogram for each company ... 44
Figure 64 – Sentiments with nrc... 46
Figure 65 – Sentiments with bing ... 46
Figure 66 – sentiments with afinn ... 46
Figure 67 – Positive words in unique tweet values ... 48
Figure 68 – Negative words in unique tweet values ... 48
Figure 69 – Top frequent positive terms ... 48
viii
Figure 71 – Pearson Correlation for continious variables ... 53
Figure 72 – Spearman correlation for continious variables ... 53
Figure 73 – Variable Importance results of Neural Network ... 55
Figure 74 – Scatterplot Matrix for the used features ... 56
Figure 75 – Relative Variable Importance for final Neural Network... 60
ix
LIST OF TABLES
Table 1 – Selection of applied R libraries ... 19
Table 2 – Variables of first data set ... 24
Table 3 - Univariate analysis of the first data set ... 25
Table 4 – Overview of descriptive statistics for the factor variables ... 28
Table 5 – Summary of observations and associated modification actions ... 38
Table 6 – Final data set after the second cleaning phase for all companies with a set of 60
variables ... 49
Table 7 – Cost-Benefit Analysis for selected machine learning models ... 51
Table 8 – Results of Chi-square test ... 52
Table 9 – Variable importance results of Logistic Regression ... 54
Table 10 – Variable mportance results of CART ... 55
Table 11 – Results of Neural Networks ... 58
Table 12 – Model selection for 1 hidden layer with sample=3000 ... 60
Table 13 – Feature Selection Iterations with NNL4 model ... 61
Table 14 – Data sample Iterations with NNL4 model ... 61
x
LIST OF SCRIPTS
Script 1 – Split the variable created_at ... 22
Script 2 – Deleting NA and cleaning the text variable... 23
Script 3 – Merging the twitter and yahoo data set ... 23
Script 4 – Calculating Pearsons Correlation ... 26
Script 5 – Building a boxplot to detect outliers ... 26
Script 6 – Building word clouds to examine the content of the outliers ... 27
Script 7 – Exploring the target variable ... 29
Script 8 – Investigating the distribution of the tweet lengths ... 30
Script 9 – Performing drill-downs to examine the target variable... 31
Script 10 – Building word clouds and frequency tables to examine word frequencies... 33
Script 11 – Performing LDA to output the top 10 topics... 35
Script 12 – Building based on the LDA result the word-probability plots ... 36
Script 13 – Building the variable stock_content by setting up a lexicon ... 38
Script 14 – Illustrating the distribution of the target variable within the trading hours ... 40
Script 15 – Classifying unique tweets by training a classification tree ... 41
Script 16 – Performing and merging the sentiment analysis output with the existing data set
... 43
Script 17 – Applying tidy sentiment analysis on the data set ... 45
Script 18 – Unnest the vectors and extending the variable by transforming them into integers
... 47
Script 19 – Classifying the polarities in numeric sentiments ... 47
Script 20 – Creating a data sample for training and test data set ... 52
Script 21 – Applying Logistic Regression to analyze variable importance ... 54
Script 22 – Applying Classification and Regression Trees to analyze variable importance ... 54
Script 23 – Applying Neural Networks to analyze variable importance ... 54
Script 24 – Converting and normalizing the variables ... 56
Script 25 – Training the first neural network ... 58
xi
LIST OF ACRONYMS
ACRONYM DESCRIPTION
AIC Akaike Information Criterion
API Application Programming Interface
AUC Area under the Curve
BIC Bayesian Information Criterion
CART Classification and Regression Trees
CRISP Cross Industry Standard Process for Data Mining
CSV Comma-separated-value
ETL Extract, Transform and Load
IT Information Technology
LDA Latent Dirichlet Allocation
NLP Natural Language Processing
NNL Neural Networks
1
1. INTRODUCTION
With the introduction and commercialization of the internet in the 1990s, the velocity of reactions and opinions for certain news started to increase drastically. Indeed, the present society spreads information in velocity and variety, which impacts the economical behavior radically. This is possible due to the ubiquity of digital news platforms and the resulting responses on social media channels such as tweets. Twitter is seen as one of the largest opinion-based networks of the internet, generating daily hexabytes of data, which influences globally the purchasing behavior and fluctuates the stock market price (Bollen, Mao, & Zeng, 2016).
Simultaneously the development of computing was disrupting the economical field, in the fields of data mining, which optimizes decision making processes and firm strategies (Giudici & Figini, 2009). Particularly, the opportunity to apply data mining methods on the generated big data from social media channels is highly valuable and is applied ever since for financial market predictions (Beckmann, 2017). In fact, applying data mining on text structures, also known as text mining, can be a great supporting asset, especially for decision-making processes. Taking in consideration the major number of text generated in twitter, data mining proposes machine learning algorithms, which can describe and predict with high accuracy economical fluctuations and help organizations to rebuild social media channels, as well as to forecast their daily outcome in the stock market (Bollen, Mao, & Zeng, 2016). Further, Bollen et al describe the value of applying text mining techniques for financial market descriptions. In detail, they describe how sentiment analysis can support the prediction of fluctuations in the market, and how businesses can use this knowledge to restructure radically their decision-making processes.
Now the question arises, how the collection of multiple opinions, which de facto the output of twitter is, can be used for future predictions. Technically speaking, every tweet contains information of the sender, the text, as well as reaction on it, the addressed topic, the addressee, inclusive a specific timestamp. Using the time stamp as a foreign key, every unique tweet can be matched with another database, for example with stock market data sets. In combination with external resources, patterns can be discovered, and this results in conclusions about how social media affect economic behavior.
The Information Management School of NOVA University Lisbon (NOVA IMS) understands the importance of this phenomenon and believe in knowledge discovery approaches and initiates, together with the Master Student Christos Zois, a working group which will apply text mining techniques with tweets collected for a certain time period for multiple technology-oriented
2 companies, namely Amazon, Apple, Google, Facebook, Microsoft and Oracle. As an outcome, the analysis will result in a selection of variables with high importance, as well as predictions for stock market values. The following chapters summarize the project procedure, describe the motivation and objectives of the project and explain the variety of work packages.
1.1. R
ESEARCH CONTEXT ANDP
ROBLEMI
DENTIFICATIONThe correlation between tweets and stock markets can be illustrated with one prominent example from the spring of 2018, when the founder of Tesla, Elon Musk, published on the 1s t April 2018 an
ironic tweet about his bankruptcy for public relations purposes. Originally published with entertaining intention, but not representing the reality, this tweet negatively affected the stock value for Tesla for a measured 31-day period by negative 22% downgrade with a relatively low retweet quote of almost 25 thousand people (Russia Today, 2018). The effect on the stock market is illustrated below:
Figure 1 – Elon Musks tweet on Teslas bankruptcy1
Indeed, recent studies revealed high correlations between several environmental, socio-demographical, and economic factors and stock market fluctuations (Nikfarjam, Emadzadeh, & Muthaiyah, 2018) (Tsai & Hisao, 2010) (Jadhav & Wakode, 2017). Translating this assumption for data mining purposes, it means that both qualitative and quantitative measurements are necessary to approach precise stock market predictions. On the other hand, many attempts to analyze historic stock data with established machine learning algorithms were not able to justify the random behavior of the stock market. Nikfarjam et al explain that “the impact of un-quantifiable events on
the market” (Nikfarjam, Emadzadeh, & Muthaiyah, 2018) is absolutely necessary to enhance
accurate predictive models.
1 Copied from Google (2018)
3 Addressing Beckman's studies, social media has a great influence on the stock market fluctuations (Beckmann, 2017). Additionally, investigated data mining studies included text mining activities in their research to build prognosis capabilities on the stock market fluctuation. Nikfarjam et al define this activity as “news-based stock market prediction systems” (Nikfarjam, Emadzadeh, & Muthaiyah, 2018). This activity has the goal to classify whether the news content in the published time reached a positive or negative difference compared to the past stock value. Furthermore, their study includes a comparison of developed stock market classification systems for the identification of common dominators and features for text mining in stock market predictions. The findings illustrated that many data scientists and statisticians use sentiment analysis and semantic approaches to build predictive models, having as input data the news content and as a target the classification on positive or negative effects.2
It is relevant to investigate the social media activities of big companies to identify, how specific words, comments, opinions, and segments can have great impact on the fluctuation in the stock market, and hence, to split unstructured data into more valuable means for prediction. For this purpose, historic twitter data from the twitter application platform interface (API) was extracted to investigate, how prone the stock market value reacts to different tweet sentiments.
1.2. D
EFINITION OF RESEARCH QUESTIONS AND PROJECT GOALAddressing the previous observations, one goal is to contribute to the study area “News based Stock Market Predictions” and text mining, together with statistical insights based on the used features and keywords, which influence the stock market evolvement. This project will match tweets with stock market data. The stock market data will be extracted and preprocessed from the Yahoo Finance API. The tweets contain roughly 2 million observation points from various information technology companies, namely Amazon, Apple, Google, Facebook, Microsoft, and Oracle. Further, this project will focus on the following research questions to fulfil the project scope, which is to preprocess and clean the data set, to extract and modify features, as well as to conduct predictions, to apply experiments, to see if it is possible to predict accurately the stock market prediction by using only qualitative twitter data. The following research questions were defined:
Research question 1: What are the characteristics of the data set? How can descriptive approaches and features engineering support the model development, and is it possible to build a statistical signal for the model?
Research question 2: Which features, and keywords show influence on the stock market fluctuation?
4
2. STUDY RELEVANCE AND IMPORTANCE
The previous facts showed, that news-based and semantic content is highly relevant variables for accurate stock market predictions. As shown, the influence of news and social media are one of many qualitative variables, which will help to better forecast the, as Nikfarjam et al describe, “random behavior of the stock market”. An article from Harvard Business School further explains: “[the] future, like any complex problem, has far too many variables to be predicted” (Stibel, 2009). Stibel concludes that there will be never a machine learning model constructed, which quantifies all relevant variables for this equation.
Nonetheless, a study of the Technical University in Chicago reminds of the original propose of machine learning algorithms, which is to generalize its predictive capabilities from historic data, as well as to translate a problem into a mathematical equation (McAllester, Srebro, & Urtasun, 2006). Fundamentally, the value of every machine learning algorithm is to generalize the parameters from observations. To optimize them, the machine learning algorithm must continuously be improved in increments or so-called evolutions. This can happen through two different approaches, namely, update the parameter settings and/or include new historical data.3 Based on this motivation, the
research on identifying semantic patterns within news content is highly attractive for stock prediction and must be analyzed in great detail. To achieve this, the research must include modern data mining approaches and synergize them with stock market knowledge. This work will align its research methodology with pioneers in the field of sentiment analysis and text mining, especially by using the project from Singh (2019) as a reference.
Several organizations will benefit from the provided insights; thus, it will help to build efficiently machine learning algorithms by providing a best practice from different sources and authors. Especially, data scientists can benefit from the feature selection phase, which indicates important insights, which features are relevant for the predictions. The script, which will be provided and explained throughout this paper, can be used by data scientists.
2.1. P
ROJECT OBJECTIVESThe main objective of this master thesis is to answer the research question by preprocess the delivered twitter data, apply text mining techniques to quantify the contents into statistical relevant features, apply descriptive analytics to describe the AS-IS state of the data, and to investigate, which keywords are strongly correlated with the stock market fluctuations. The following checklist
5 summarizes the objectives for the operational actions, which must be performed to provide a qualitative answer to the research questions:
i) Summarize and review fundamental knowledge in the field of stock market prediction ii) Summarize and review fundamental knowledge in the field of text mining
iii) Preprocess the twitter data and perform data cleaning tasks to reduce noise
iv) Apply text mining techniques to quantify the unstructured text into relevant features v) Apply sentiment analysis to the data set to label their semantic behavior
vi) Apply feature engineering, especially by indicating word-frequencies and relevancy vii) Predict the stock market fluctuation by targeting the variable increase4
viii) Analyze which keywords were highly relevant to classify the prediction
2.2. R
ESEARCHM
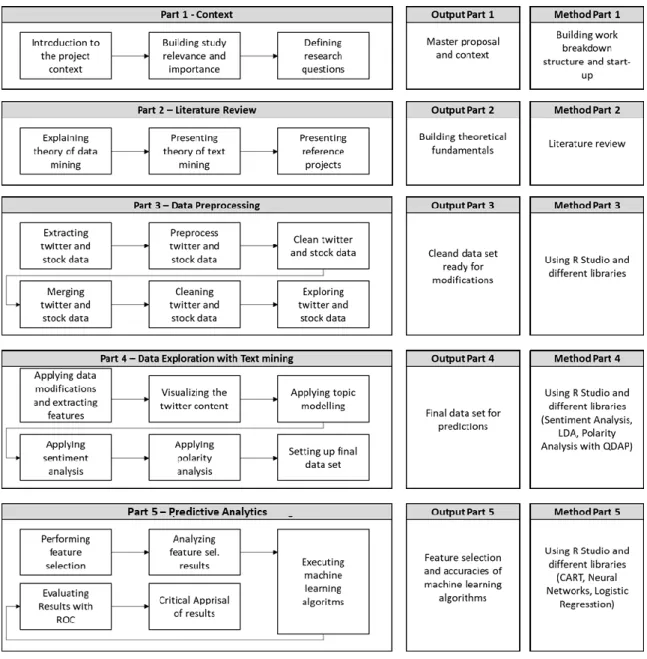
ETHODOLOGYTo give an answer and a tailor-made solution for the above-described study objectives and problems, this research paper plans to structure the scientific paper in nine parts, which are represented in the following work breakdown structure. Each box describes actions with the corresponding categorized tasks. The Output column is representing the value of the work, which is contributing towards predicting with high accuracy. In summary, the figure describes, that a detailed literature review must be executed to build business context and knowledge about the programming language R. Then it is necessary to preprocess the data with cleaning procedures to apply text mining operations. By that new features will be build, which will be analyzed with feature selection methods. All this will lead then to the point, to use a selected machine learning algorithm to predict the present binary classification problem.
6 Figure 2 – Graphical representation of research methodology and project structure
7
3. LITERATURE REVIEW
This chapter discusses the results of a literature review in the field of text mining approaches f or stock market prediction to provide the reader with fundamental knowledge in the area of news based predictive modeling, as well as to assure that the present project will produce original ideas, methods, and technical contents.5 Four areas of research are radically influencing the present project
success, namely data mining, text mining, stock market predictions and the R programming language for the operational work. The results are consolidated in the following segments, namely fundamentals of data mining, fundamentals of text mining, machine learning algorithms, stock market predictive capabilities, reference projects in text mining for stock market predictions, as well as resulting actions for the project execution.
3.1. F
UNDAMENTALS OF DATA MININGData mining is a bundle of statistical computing techniques to discover hidden patterns in large data sets by applying statistical methods and algorithms (Han, Kamber & Pei, 2012). Many authors and professionals define data mining as the interdisciplinary interface between the discipline’s statistics, software development, and domain knowledge. In fact, Han et al explain, that “the term data mining does not really present all the major components” (Han, Kamber & Pei, 2012) and is just a generalization of tasks that discovers knowledge in large databases. This refers to the synonym knowledge discovery in databases, which includes processes and activities in the fields of data cleaning, data integration, data selection, data transformation, machine learning, classification, clustering, pattern evolution, and knowledge presentation.6
One widely-applied reference model, which summarizes the activities of data mining is the CRISP model (Shearer, 2000). It is the continuous and iterative meta-process behind every data mining project. It describes that every data mining task has to build fundamental data understanding and business context, then the data set gets processed with machine learning algorithms before it gets evaluated and deployed. The following figure is the original representation of the CRISP model from Shearer (2000):.7
5 This thesis will be structured based on the five qualitative criteria defined by Bartsch 2015 which are justification, timeliness, originality and valuability (Bartsch, 2015)
6 Other authors represent the iterative process of these activities in the famous frameworks CRISP (Shearer, 2000)
7 As much in front, text mining is a sub-category of data mining and find its use in the CRISP model only in the data preperation and modeling phase.
8 Figure 3 –Graphical representation of the CRISP model8
3.1.1. Data structures and data types
The most important component of the CRISP model is the data input. Usually, it has to be extracted from multiple data sources and can be found in three different states, namely structured, semi-structured and unsemi-structured. The term semi-structured refers to organized data, which follows a predefined repository, database structure and defined data types.9 Further, the semi-structured data
is a structured data set, following specific rules and separators, thus cannot be displayed in relational databases. On the other hand, unstructured data is information, which follows no predefined repository and cannot get stored in a conventional database. Following the knowledge framework of north, in data mining it is a must to scale the unstructured data into granular structured data to perform data mining techniques, as most operational data mining tools, as R Studio, require structured data (Singh, 2018). Another required step to structure a data set is to classify correctly the different data types. This is important as many operations in R or other programming languages require proper data type and data structure declaration to execute functions. In R Studio every data is an object and every object can be declared into six so-called atomic data types, namely: character, numeric, integer, logical and complex. These levels help to distinguish categorical from continuous variables. As the name indicates, categorical variables can label data into different categories. These data declarations are necessary to build informative graphs and charts. On the other hand, continuous variables declare the data as a quantity, which implies, that these data structures, together with discrete variables, are used to perform calculations with the data.
8 Copied from Shearer (2000)
9
3.1.2. Data mining and Machine Learning
Hence, data mining contains three major techniques, namely i) supervised learning, ii) unsupervised learning, and iii) reinforcement learning. Supervised learning labels data and is mostly performed with clustering and classification techniques. Unsupervised learning is the prediction of unseen data, based on trained machine learning algorithms. Lastly, reinforcement learning is the methodology of gaining real-time models, based on real-time events, which optimizes its parameters based on failure. For this project, only supervised and unsupervised learning techniques will be used and explained during the execution of the stock prediction analysis.
Thereby, the goal of every machine learning algorithm is to pack a set of observations into a universal representative equation, which is known as generalization. This happens by setting the parameters of the target function based on the general concepts from the specific observations, also known as inductive learning (Han, Kamber, & Pei 2012). The goal of inductive learning is to generalize from the training data. The developed equation will be validated in a validation set, and if the predictions are accurate it will be proved in a test set. This ensures the quality and general accuracy of the model on unseen data. In general, if the model is not predicting well it is called underfitting, whereas if it is predicting close to perfect accuracy it is called overfitting. It means that the developed model must find a compromise in between of underfitting and overfitting.
10
3.2. P
REDICTIVE MODELING ANDC
LASSIFICATION ALGORITHMSIn terms of machine learning algorithms, two methods are identified which will be used in the later project execution, namely a basic approach logistic regression and a complex algorithm neural network. The so-called classification and regression tree (CART) will be also used to conduct other experiments. Both are designed to predict binary variables, as the stock market fluctuation will be calculated with the binary variable named increase.
3.2.1. Classification and Regression Trees
The non-parametric classification and regression tree model is a widely applied machine learning algorithm, especially in the text mining context, as it is often used for binary classification problems, with the most applied use case being spam recognition. The CART learns from historic data to build if-then-else splits. By that, it splits the data into recursively smaller subsets, which increases the probability of finding specified classes within the subset. For binominal classification problems, this approach is called recursively binary splitting. Basically, the CART algorithm assigns all training data to the root node and then iteratively it partitions the features by calculating the information gain, or Gini index, or Entropy. The feature with the greatest splitting indicator will be the splitting criterion for the current node. The resulting partition is called a child node. For each child node iteratively it calculates its purity, which checks if the instances are belonging only to one class. If the note is pure, it will declare it as a leaf. If not, it will set the procedure with the current node.
Figure 5 – Illustration of a decision tree
The decision tree approach can be operationalized by using the rpart library. The rpart() function allows to set up a classification tree effectively. By default, it uses the Gini index to split the different nodes. Also, it provides default parameters to prevent it from growing. In general, decision trees are one of the few machine learning algorithms, which can handle both, continuous and categorical features to predict the dependent variable. In the field of text mining, it can be used to estimate the
11 importance of the independent variables effectively, particularly to estimate, which tokens are relevant predictors.
3.2.2. Logistic Regression
Logistic regression is another common machine learning algorithm for binary classification problems. Its dependent variable must be categorical, and it is used to find dependencies between independent variables and scores the probability of an unseen observation point being classified to a certain category. Binominal logistic regressions are targeting logical, or also known as binary, classification problems. Basically, binominal logistic regression uses the sigmoid function, which calculates probability scales. Logistic Regression is like a typical linear regression model, with the difference that logistic regression predicts whether data is belonging to the group true or false. Instead of fitting a trend line to the data, logistic regression uses the Sigmoid function to fit a probabilistic curve to the binominal outputs. It means, once the logistic regression model is trained, the probability of unseen data will be used to classify it to the right class.
The benefits of a logistic regression are its simplicity of application, it has low variance, and it provides a probability score for unseen observations. On the counter side, it is only applicable to linear features, which requires high preprocessing time, as categorical variables must be transformed into numeric values. In addition to this, the authors claim that the results of logistic regression moderately drop, when the selected features increase (Agrawal, 2017). For this execution R provides the function glm().
3.2.3. Neural Networks
The data structure of a neural network is an interconnected web of nodes, or also known as neurons, which direct to other neurons (Gaur, n.d.). Neural Networks main function is based on a certain number of features, which compute progressively complex calculations, which address each neuron
12 with a weight. The weights indicate the importance of the interconnected web, which highlights which neuron must be followed to reach the so-called output layer, which scores the data belonging to a certain class. Gaur explains, that neural networks are commonly used for binary classifications. The idea is to describe the group to which the data observation belongs. Neural Networks are many times referred as deep learning algorithms, because they handle very accurate predictions, especially with a big data set and high number of features. Generally, neural networks are structured in different layers, as the following figure highlights:10
Figure 7 – Representation of Neural Networks11
3.3. F
UNDAMENTALS OF TEXT MININGOne example for unstructured data can be found at the present project, namely the variable text. Tweets are technically speaking a collection of characters, which cannot be analyzed by machines in its purest form, due to their semantic inability (Han, Kamber, & Pei, 2012). Researching for an applied study to analyze textual information, two research areas could be found, namely natural language processing (NLP) and text mining (Singh, 2018). NLP is the approach to make the machine understand the semantic content behind the textual information, whereas text mining is the preprocessing and translation of the semantic text into numeric values together with analysis (Feinerer, 2008).
3.3.1. Data preprocessing in text mining
The literature describes the purest form of text data as a text corpus, or with other words the raw text. Hereby, the target is to transform the text corpus into numeric values, which can be further processed by the machine. For that purpose, parsing and preprocessing steps are necessary to transform the text into a semi-structured formatted text database (Feinerer 2008). Another aspect of text mining activities is modifying text documents into “categorized, keyword-labeled and time-stamped collection[s]” (Feldmann & Sanger, 2007). Aese (2011) describes important preprocessing
10 More theoretical context will be given in the Chapter 4.4 11 Copied from Gaur (n.d.)
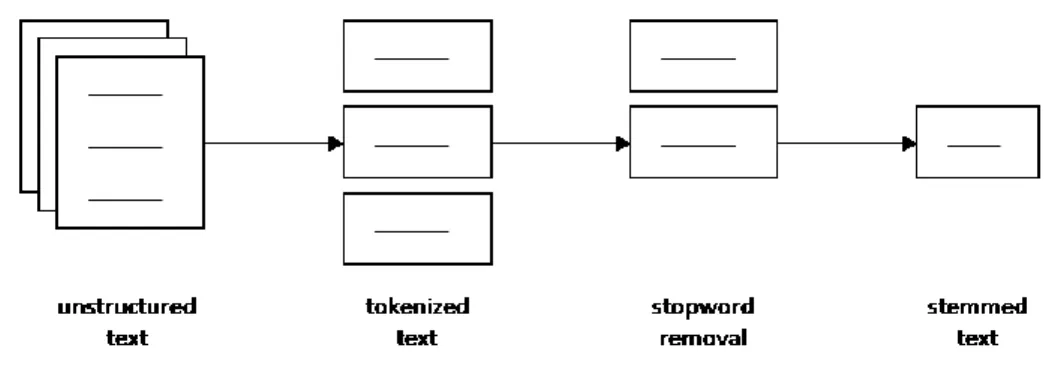
13 techniques in text mining, which should be executed in every project, namely preprocessing, cleaning, feature types, feature selection, and reduction. The following figure illustrates Aese phases:
Aese explains that text processing eliminates as much noise as possible to guarantee significant text input. Tokenization is the process of dividing a text into its single elements, e.g. words, phrases, symbols, etc., also known as tokens.12 After doing so, the previous mentioned stop-word removal
deletes insignificant tokens to reduce in a second step the number of features and noise. Last, Aese recommends to perform stemming, which reduces synonyms or acronyms into their semantic root. To name an example the root of the words adjusting an adjustable would be adjusted.
After that, the features of the text have to be extracted to perform data mining techniques. One technique is the n-gram. It is the word-based sequence of n-items from a text input illustrated typically as frequency counts of n-objects, also known as n-gram statistics. Many statisticians found out that 1-grams are due to their simplicity very significant for statistical purposes, but Aese describes that by increasing the n, in particular into a 2-gram, it will contain more information and statistical significance. A technique which complements the n-gram is the noun phrases and proper nouns, which requires a Part-of-speech tagging.13 In both cases, a frequency table is built to
distinguish important nouns, pronouns, and names grouped by their frequencies to include only highly relevant features. After the preprocessing and the variable modification is executed, feature selection metrics need to be analyzed to guarantee statistical relevant features. For that purpose, Aese proposes three metrics: information gain, mutual information, and chi-square. After granularly building a set of features, the feature reduction process is minimizing the number of features, which will enhance the classifiers for the modeling phase. Many authors describe the well-known singular value decomposition technique, which decreases the data dimensionality of the original feature matrix by representing latent features (Leskovec, Rajaraman, & Ullman, 2016). The following
12 Many projects tokenized text data into binary variables, to represent for example if a term is included in the observation po int. This radically increases features to analyze afterwards the importance for the model
13 Part-of-speech tagging labels the string i nto verbs, adjectives and nouns.
14 chapters will explain in a brief manner specific text mining algorithms, which will be applied later in the research methodology.
3.3.2. Sentiment analysis
The activities of text categorization and keyword-labeling are also known as sentiment analysis (Mejova, 2009) (Feldmann & Sanger 2007). Sentiment analysis can be defined as a supervised learning technique, which calculates the subjectivity of textual information and transforms it into a quantitative measure or category. In short, the machine understands the polarity between positive and negative emotions by categorizing human language with support of term frequencies and matching systems (Feinerer, 2008). To name an example the well-known polarity sentiment algorithm clusters the text into positive or negative text particles by matching the content with pre-defined or automatically created lexicons. Lexicons represent a list of context-related labeled words. Their purpose is to match the input text with the lexicon list and build a frequency table to indicate the probability for a polarity.14 The output of this procedure is called term-document matrix (Singh,
2018). Indeed, the lexicon-based approach is one of the most used algorithms for text mining activities. Linoff & Berry described building a lexicon library is the most important and the most time-consuming part of every text mining project (Linoff & Berry, 2011). After searching for such lexica it could be found that R libraries are containing such lists, e.g. stopwords-lists, as in the tidy library, which is getting updated consistently by the developers or the R community. However, many authors address that sentiment analysis algorithms are topic-specific and cannot target more complex text data, because of lexicon-based limitations (Mejova, 2009) (Cambira, Das, Bandyopadhyay, & Feraco, 2017). As a complementary algorithm Jones et al 2000 developed an algorithm which distances from the qualitative comparison. The algorithm targets measurements taken directly from the character objects as sentence length, terms frequency, and its discrimitinativeness from other texts. Hyun et al (2013) summarize these variables within a formula called explanativness (Hyun Duk Kim, 2013). By that a new dimension can help to translate emotional content into a quantitative indicator. Cambria, Das, Bandyopadhyay & Feraco discuss in their outlook that the field of text mining should conduct research in the field of translating characters into numeric values and combinations to optimize text analytics radically.
To operationalize sentiment analysis, the R community provides the widely applied library qdap. It provides a function set, which allows plotting the polarity score of a text variable. Many Authors, especially Singh (2019) claim, that it is one of the most accurate unsupervised NLP technique due to its included context equation. The algorithm of qdap assigns a value to a single token of a text value
14 Also known as bag-of-words mechanism, which identifies the matched words and build depening on that frequency matrizes (Feinerer 2008)
15 by comparing them with predefined sentiment dictionaries. To not mislead the semantic content of the text variable, a separate context cluster of words is extracted from the text variable. By default it selects the four tokens before and the two tokens after the selected token. With it, the tokens within this context cluster can be tagged as either neutral, amplifier and negator, and weighted using the weights from predefined lexicons. The weights are calculated by summing the product of each polarized and weighted term. A similar and widely applied approach for sentiment analysis is the polarity analysis with the functionality set of the library tidytext. It is a lexicon-based approach with a variety of different lexica, which are scored either quantitative or qualitative. Where Qdap uses equations to score the polarity of a sentence, the tidytext library uses a more simplistic approach. It follows the logic, if the token or text variable contains an element within a lexicon it will be scored as in the lexicon. Three common approaches in tidytext are the AFINN approach, Bing approach, as well as NRC approach. AFINN scores the sentiments with a -5 to 5 ratio. On the other hand, Bing and NRC follow a qualitative approach, by scoring the tokens with predefined values. The research showcased, that both approaches are widely applied in the opinion mining sector. For both scenarios it is important to have a cleaned, preprocessed and ideally tokenized text variable. Another research shows, that qdap is very pruned to large data sets due to its time complexity, whereas tidytext and other libraries have efficient time complexity. Though, to identify opinions and quantify them accurately the qdap library is better, as Singh (2019) consults. The author from qdap provides alternative procedures for conducting accurate sentiment analysis, in particular he recommends the libraries, qdap, syuzhet, sentiment as well as the famous tm package. However, his recommendation for very accurate sentiment analysis is stansent, but this package works only on small data sets.
3.3.3. Latent Dirichlet Allocation
Text mining mostly deals with large data sets, which contains an unmanageable amount of observation points. By that, it is not easy to estimate or understand the semantic context of large text-based data sets. One possibility to extract latent topics within texts or within n-number of documents is the usage of the probabilistic model Latent Dirichilet Allocation. A topic can be represented by a set of words, for example, the words release, date, tomorrow, new, product reminds of the topic “new release”. The LDA calculates exactly this approach by randomly allocating tokens from documents into a random topic and afterward estimate their Dirichlet distribution or simplifies their probabilities. The Dirichlet distribution is a multivariate distribution which estimates by random the probability of a mass function. The literature describes the Dirichlet Process, which is the base of this algorithm. It declares k-vector objects and stores randomly a n-text tokens in it. Once n+1 token is placed within the k-vectors, the Dirichlet distribution function will indicate the similarity of the n-tokens. If the Dirichlet distribution of a token contains anomalies, the token will be changed
16 randomly to another topic. This iteration will continue recursively until the Dirichlet distribution is distributed moderately. In this context two statistical indicators help to control the output of the LDA. The alpha value “alpha controls the mixture of topics for any given document” (Lattier, 2018) and the beta value “controls the distribution of words per topic” (Lattier, 2018). Medium. Lattier (2018) provides a very effective illustration, how the Dirichilet distribution hyperparameter alpha changes, after training the model with 1000 iterations:
Figure 9 – Dirichilet Distributions after first iteration15 Figure 10 – Dirichilet Distributions after multiple iterations16 Singh (2019) consults, to increase the k-parameter of the LDA algorithm systematically, to find the right number of topics, which belong within the document. Statistical indicators can be alpha or beta values. Topics can be considered well distributed when there is a high gap between the alpha and beta values. Detailed research found, that there is no best-practice or systematic approach to estimate moderate k-parameter for LDA, other than comparing the alpha or beta values distributions and running experiments by setting up different parameters and iterations.
3.3.4. Limitations with text mining
Searching for existing problems and future works, many participators claim that text mining algorithms aim to overfit the training set, due to its subjective attributes and context-based data. Kao & Poteet (2007) further explain, that “[p]aractitioners of text mining are rarely sure whether an algorithm demonstrated to be effective on one type of data will work on another set of data. Standard test data sets can help compare different algorithms, but they can never tell us whether an algorithm that performs well on them will perform well on a particular user’s dataset” (Kao & Poteet 2007). Also Professor Mahfuz Judeh addresses the context-sensitivity problem by criticizing the lack of scalability of text mining algorithms, as each problem is highly correlated with the domain knowledge input (Judeh, 2018). Judeh recalls that so far no single application has a problem-specific domain knowledge included, e.g. in form of a dynamically adaptable lexicon, and has always to be built separately. In conclusion, this research problem cannot be solved yet. As a matter of fact, there
15 Copied from Lattier (2018) 16 Copied from Lattier (2018)
17 are research projects which addressed this problem with NLP techniques, but the dynamic und not-universal nature of human language will never relief a pattern for data scientist to generalize it into a universal applicable mathematical algorithm.17
3.4. S
TOCK MARKET AND PREDICTIVE CAPABILITIESIt is understood that data mining techniques can predict the future based on setting the parameters of an algorithm by collecting historical data and selecting relevant features. Particularly, text mining supports model development and feature selection to build more accurate models.18 Respecting this
knowledge, it can be assumed that a well-trained machine learning algorithm will predict any given target. But the reality shows that many researchers confirm that the stock market is unpredictable, considering the number of experiments for building information systems in this field. In particular the established random walk theory from Cootner (1964) confirms this hypothesis, as Cootner used efficient-market hypothesis to prove it. He also explains that the best strategy to purchase a stock market is to buy and hold the stock for the long-term.
However, a study which consolidated many relevant variables for the stock market price prediction conducted an experiment, where multiple features were combined to enhance the accuracy performance instead of using single features (Tsai & Hisao, 2010). In fact, Tsai & Hisao used in their experiment 85 micro and macroeconomic variables to predict the stock price. The results show that combining multiple feature selection methods, in particular with Principal Components, can provide better prediction performances than using single feature selection methods and reached an accuracy of 73% (Tsai & Hisao, 2010). Although they used many important variables, it can be criticized that no variable was included, which represents the reactiveness of the stock price. Addressing the study from Kharb & Malik (2014) the results were that the following qualitative variables are influencing with high importance the stock market and should be considered in every stock market investigation: “[O]verconfidence, herding complex, overreaction, conservatism, preconceived ideas, excessive optimism, representativeness, irrationality or rational way of thinking and the impact of media channels” (Kharb & Malik, 2014). The next chapter will discuss projects which included variables with significant relevance to the dynamic behavior of the stock price, in particular news content, which includes social media contents, like tweets.
17 This refers to the so-called ambiguity problem. The ambiguity problem describes the capability of understanding a certain information in multiple ways. Considering the multilingual text refinments a universal understanding of a text-corpus is out of the question. ResearchGate (2018) explains this phenomenon in great detail
18 Obviously, many criteria influence the development of a model, particularly accuracy, robustness, adaption, as well as perfor mance (Giudici & Figini, 2009) (Han, Kamber, & Pei, 2012)
18
3.5. R
EFERENCE PROJECTS IN TEXT MINING FOR STOCK PREDICTIONSWhile the topic of using social media content to predict the future is widely applied, the literature includes few studies which use advanced text mining methods. A recent study though attempted to use “sentiment indicators created by applying specialized financial microblogging lexicons” (Oliveira, Cortez, & Areal, 2015). Oliveira et al explain that most of the existing studies used a relatively smaller data set with a few sets of variables. Oliveira et al studies included a variety of correlated twitter variables as well, namely a daily twitter indicator in addition to other news contents like “weekly American Association of Individual Investors and Investors Intelligence (II) values and monthly University of Michigan Surveys of Consumers and Sentix values” (Oliveira, Cortez, & Areal, 2015). They explain in their outlook that twitter data are analyzed more in the advertisement field then rather focusing on translating the content into features for stock market predictions.19 To optimize
future predictions, they intend to also include domain knowledge from other social media channels to train the model with relevant variables from different sources.
Nevertheless, the procedure of Oliveira et al is more an exception than a rule. The common denominator in the field of text mining prediction is sentiment analysis as it is detected that most of the studies used different types of sentiment analysis. Sentiment analysis, also known as opinion mining, represents a complex activity in the area of quantifying people’s digital behavior, but mainly analyses emotions, opinions, attitudes, etc. (Liu, 2012). It is subdivided into the field of NLP – the study which processes the human language to computers. An important insight by Liu 2012, Oliveira, Cortez, & Areal 2015 and Jadhav & Wakode 2017 is very prone to spam, as well as outliers like unrelated content.
Addressing again the unpredictability of the stock market, a study was found which confirms that it is not possible to predict future fluctuations up to 50% accuracy, but “very early indicators can be extracted from online social media […] to predict changes in various economic and commercial indicators” (Bollen, Mao, & Zeng 2010). In their research, this was achieved by filtering only relevant tweets with the premise that the tweet content is strongly correlated with the stock market. This was achieved by using regular expressions, polarity sentiments, Google-Profile of Mood States, as well as aggregated public mood sentiments and filters. Bollen et al determined that by increasing the dimensions of sentiment analysis the predictive power of the classifiers will increase and recommend this method for future projects.
19
3.6. A
PPLIEDR
L
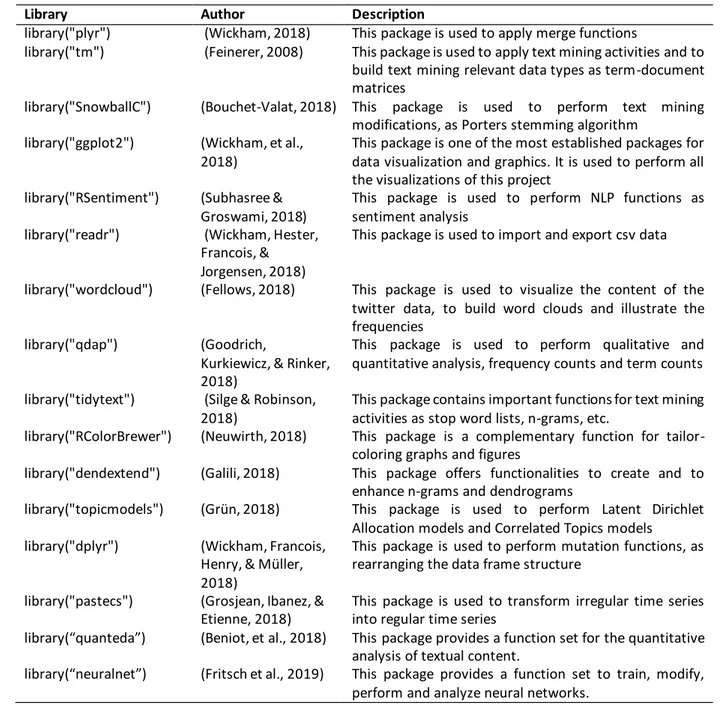
IBRARIESAs the present project will be executed with the programming language R, it was necessary to find reference projects, which applies the previously mentioned data mining techniques. Particularly, the Cambridge University data scientist Minerva Singh (2018) summarizes different text preprocessing and modeling techniques on twitter data, which will help to construct efficient R code and understand the data structures in R, as well as understand the functionalities of diverse text mining libraries in R studio. Respecting all the different approaches described in the state of arts chapter, the following text summarizes a selection of the most important libraries, which will be used in to perform text and data mining activities. In total over 80 libraries and packages were used.
Table 1 – Selection of applied R libraries
Library Author Description
library("plyr") (Wickham, 2018) This package is used to apply merge functions
library("tm") (Feinerer, 2008) This package is used to apply text mining activities and to build text mining relevant data types as term-document matrices
library("SnowballC") (Bouchet-Valat, 2018) This package is used to perform text mining modifications, as Porters stemming algorithm
library("ggplot2") (Wickham, et al., 2018)
This package is one of the most established packages for data visualization and graphics. It is used to perform all the visualizations of this project
library("RSentiment") (Subhasree & Groswami, 2018)
This package is used to perform NLP functions as sentiment analysis
library("readr") (Wickham, Hester, Francois, & Jorgensen, 2018)
This package is used to import and export csv data
library("wordcloud") (Fellows, 2018) This package is used to visualize the content of the twitter data, to build word clouds and illustrate the frequencies
library("qdap") (Goodrich,
Kurkiewicz, & Rinker, 2018)
This package is used to perform qualitative and quantitative analysis, frequency counts and term counts library("tidytext") (Silge & Robinson,
2018)
This package contains important functions for text mining activities as stop word lists, n-grams, etc.
library("RColorBrewer") (Neuwirth, 2018) This package is a complementary function for tailor-coloring graphs and figures
library("dendextend") (Galili, 2018) This package offers functionalities to create and to enhance n-grams and dendrograms
library("topicmodels") (Grün, 2018) This package is used to perform Latent Dirichlet Allocation models and Correlated Topics models
library("dplyr") (Wickham, Francois, Henry, & Müller, 2018)
This package is used to perform mutation functions, as rearranging the data frame structure
library("pastecs") (Grosjean, Ibanez, & Etienne, 2018)
This package is used to transform irregular time series into regular time series
library(“quanteda”) (Beniot, et al., 2018) This package provides a function set for the quantitative analysis of textual content.
library(“neuralnet”) (Fritsch et al., 2019) This package provides a function set to train, modify, perform and analyze neural networks.
20
4. PROJECT METHODOLOGY AND EXECUTION
The following chapter will discuss the research area of data mining and showcase important techniques and methodologies, which will be conceptualized later in this chapter. Specifically, text mining techniques will be explained, and statistical measurements will be presented, which will complement the literature review. To secure a systematical approach, the following chapters will include the executed R script. The following figure represents the technical methodology and summarizes all procedures which are described in the next chapters.
21
4.1. D
ATAP
REPROCESSINGThis chapter addresses the project scope “Preprocess the twitter data and perform data cleaning tasks to reduce noise” by extracting the delivered csv files and merge them with the extracted yahoo finance data. Data issues will be examined to discover anomalies and to solve them with data modification scripts. All data types will be viewed and declared to allow a smooth transition to the statistical exploration phase. The overall goal is to build a cleaned data set, which will be the foundation for further project execution.
4.1.1. Extract and Preprocess the Data into R Studio
The present twitter data from the companies Amazon, Apple, Facebook, Google, Microsoft, and Oracle were sent separately as multiple comma-separated-value (CSV) by NOVA IMS, which simplified the data repository in three variables, namely: Identification/ID, unstructured tweet content, as well as an unstructured timestamp. On first glance, it contains a different variable structure as the original twitter API provides, which means there is a loss of important information for this project “Twitter Developer Docs” (n.d., 2019). It is assumed, that the twitter data set was preprocessed beforehand, without finalizing important tasks as cleaning the text and applying modifications to the timestamp. Furthermore, comparing the Twitter API “Twitter Developer Docs” (n.d., 2019) (Singh, 2018), many variables were dropped beforehand, which increases the information loss even more, in particular variables as publisher, handle, is_retweet, language, etc.20
However, to consolidate over 100.000 CSV files the Windows command tool was used to merge the multiple files into one CSV file, which contained over 300 Megabytes of data and in total over 1.7 million observation points. With it, it is possible to examine and to preprocess the data into R Studio.
4.1.2. Explore Data Issues and apply Data Cleaning
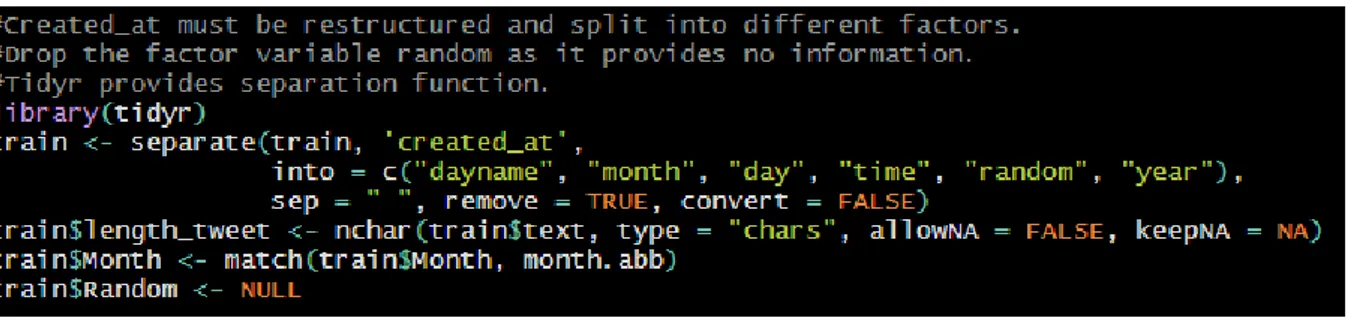
In first glance, the timestamp, as well as the text variable, are unstructured. For that sake, they must be transformed to ensure the quality of the data preprocessing. The first activity is to split the timestamp in such a manner, to use Twitter timestamp as a foreign key to merge them with the downloaded stock data from the Yahoo API. The following R code operationalizes this procedure:
22 Script 1 – Split the variable created_at
With this code, it is possible to restructure the variable created_at into 6 new variables. Simultaneously, it allows using date as a foreign key to merge the data set with the extracted data from the Yahoo API. The following data model describes the AS-IS state:
With the setup of the entity-relationship model, one problem becomes clear. The present database has multiple tweets for each day, but on the other hand for each day only one stock price information exists. For that sake, the twitter data for each day will be merged with one stock price, and the binary variable increase will be added to the stock price data set, which indicates if the stock market raised or decreased in comparison to the previous day. Simultaneously the variable increase is declared as the target variable.21
The biggest issue, which is observed in each company’s tweets, is the page break within the variable
text, which necessarily involves identifying and dropping broke observation points from the data set
in the ETL process, as neither R Studio nor Excel provides functions to eliminate page breaks within the loading phase. Many authors state to not delete outliers without operating replacement methods, but it is decided to drop the missing values as they contain roughly 1% of the data (Viljamaa, 2017). Authors claim that it is necessary to simplify semantic text to build in a later stage a
21 Later this will be discussed i n detail and further modifications will be applied (compare Chapter 4.2). Figure 12 –Data model for the present project
23 corpus for the sentiment analysis. For that reason, the library gsub will support the process to clean the text values and simplify them for each company, respecting the requirements of Bollen, Mao, and Zeng (2010) as well as Mejova (2009). They all discuss that the text must be screened for noise, which will have negative impact on the computation power. By cleaning insignificant terms and symbols the algorithms can detect qualitatively semantic contents. This is the reason, why it is crucial to clean the text from hyperlinks, digits, profile tags, punctuations, hashtags, as well as numbers. Other steps were to lower case the text, to get rid of white spaces, and to exclude stop words. In text mining, stop words are the most common words in any given language, which contain no semantic signal for the applied algorithms. The following script applies this method:
Script 2 – Deleting NA and cleaning the text variable
Another problem is the assembled and unstructured timestamp. It is necessary to split it, as it represents the foreign key for the merge, as well as to increase the variable input for further statistical explorations. As a result, the timestamp is split into dayname, month, day, time, year, and the aggregated and structured date variable. With it, the amount of factor variables increases for analysis purposes, and the twitter data set is ready for the merge with the queried and downloaded yahoo finance API data set for each company. The following R script merges the twitter data set with the yahoo API data set.
Script 3 – Merging the twitter and yahoo data set
The twitter data sets are extracted in the time of 29th November 2016 till the 6th December 2016. This time is selected for every company at the yahoo finance API website and with it, the following