L
L
A
A
B
B
O
O
U
U
R
R
M
M
O
O
B
B
I
I
L
L
I
I
T
T
Y
Y
,
,
I
I
N
N
D
D
U
U
S
S
T
T
R
R
Y
Y
E
E
V
V
O
O
L
L
U
U
T
T
I
I
O
O
N
N
A
A
N
N
D
D
S
S
O
O
C
C
I
I
A
A
L
L
N
N
E
E
T
T
W
W
O
O
R
R
K
K
S
S
:
:
A
A
C
C
O
O
-
-
E
E
V
V
O
O
L
L
U
U
T
T
I
I
O
O
N
N
A
A
R
R
Y
Y
M
M
O
O
D
D
E
E
L
L
R
R
i
i
c
c
a
a
r
r
d
d
o
o
M
M
a
a
m
m
e
e
d
d
e
e
S
S
e
e
t
t
e
e
m
m
b
b
r
r
o
o
d
d
e
e
2
2
0
0
0
0
8
8
W
W
P
P
n
n
º
º
2
2
0
0
0
0
8
8
/
/
6
6
7
7
DOCUMENTO DE TRABALHO WORKING PAPERR
R
i
i
c
c
a
a
r
r
d
d
o
o
M
M
a
a
m
m
e
e
d
d
e
e
††W
W
P
P
n
n
º
º
2
2
0
0
0
0
8
8
/
/
6
6
7
7
S
S
e
e
t
t
e
e
m
m
b
b
r
r
o
o
d
d
e
e
2
2
0
0
0
0
8
8
†Dinâmia/ISCTE – Departamento de Economia, Avenida Forças Armadas, 1649-026 Lisboa, Portugal.
E-mail: [email protected] – Tel.: (+351) 217938638. A Abbssttrraacctt 1 1..IINNTTRROODDUUCCTTIIOONN 22 2 2.. RREELLAATTEEDDLLIITTEERRAATTUURREE 44 3 3.. TTHHEEMMOODDEELL 99 4 4..TTHHEERREESSUULLTTSSOOFFTTHHEESSIIMMUULLAATTIIOONN 1177 5 5..DDIISSCCUUSSSSIIOONNAANNDDCCOONNCCLLUUSSIIOONNSS 3300 6 6..BBIIBBLLIIOOGGRRAAPPHHYY 3333 A ANNNNEEXX--RREECCRRUUIITTMMEENNTTDDEECCIISSIIOONNSSAANNDDFFIIRRMMSS’’SSUURRVVIIVVAALL 3377
L
L
a
a
b
b
o
o
u
u
r
r
M
M
o
o
b
b
i
i
l
l
i
i
t
t
y
y
,
,
I
I
n
n
d
d
u
u
s
s
t
t
r
r
y
y
E
E
v
v
o
o
l
l
u
u
t
t
i
i
o
o
n
n
a
a
n
n
d
d
S
S
o
o
c
c
i
i
a
a
l
l
N
N
e
e
t
t
w
w
o
o
r
r
k
k
s
s
:
:
A
A
C
C
o
o
-
-
E
E
v
v
o
o
l
l
u
u
t
t
i
i
o
o
n
n
a
a
r
r
y
y
M
M
o
o
d
d
e
e
l
l
Abstract:
This paper presents a model that was built in order to analyse the interdependencies between labour market dynamics and the evolution of industries’ structure, in situations where interpersonal links among workers influence individuals’ job decisions. The model was inspired by the case of industries that rely heavily on highly skilled labour and in which problems of incomplete information abound. The causal mechanisms here proposed constitute an alternative explanation for a number of well-known regularities of industry evolution and of labour mobility, being arguably more suitable to the analysis of those industries than the formal models available in the literature.
Keywords:
industry dynamics; labour mobility; social networks; simulation models.1.INTRODUCTION*
There are reasons to believe that changes in industry structures and worker mobility are not entirely independent phenomena. At the most obvious level, the growth of existing firms and the creation of the new ones is necessarily related to an inflow of workers to those firms, just as the contraction and the closure of firms have the opposite effects on the supply-side of the labour markets (Davis et al., 1996). Moreover, industry turbulence affects the labour markets not only in such direct way, but also indirectly through the vacancy chains that are opened/closed by firms’ growth/founding and contraction/failure (as pointed out, e.g., by Haveman, 1995). Reverting the direction of the causality, it has been noted for a long time (e.g., Staw, 1980) that worker turnover has both positive and negative consequences for organisations, and in this sense it may constitute an important determinant of industry dynamics. More recently, research on the importance of previous experience for entering firms (e.g., Helfat and Lieberman, 2002) draws attention to the possible role of workers’ turnover in bringing competences to, and therefore increasing the survival prospects of, newly founded firms. Finally, historical accounts of industries which are highly dependent on skilled labour (and specially those industries in the early phases of their lifecycles) have shown that the patterns of firms’ evolution and of labour force mobility are intrinsically related.1
Notwithstanding all the possible interdependencies between industry evolution and labour market dynamics, a lack of systematic discussion about the details of such co-evolution and its implications prevails in the literature. In fact, most theoretical models of industrial dynamics (for surveys see, e.g., Dosi et al., 1997; Sutton, 1997) tend to focus on the technological or financial determinants of changes in the structure of industries, abstracting from the influence of labour market determinants. In the same vein, the reference models of worker mobility (for a survey see, e.g., Farber, 1999) typically underestimate the mutual influence between industry dynamics and labour market forces. And while it is clear that the movement of workers between firms tends to be a minor issue in the evolution of several industries – specially those that essentially rely on low-skilled, homogeneous labour – in many other interesting contexts models of industry evolution which abstract from the role of labour market dynamics – or vice-versa – risk missing the main elements of the dynamic picture they propose to explain.
* This research was partly funded by the Portuguese Science and Technology Foundation (grant ref.
SFRH/BD/8765/2002). This version of the paper incorporates many of the comments and suggestions that were made on an earlier draft by Lorenzo Zirulia, Luis Carlos Carvalho, Steven Klepper and Olav Sorensen, to whom I am particularly thankful. The usual disclaimer applies.
1 See, for example, Baron (2004) on Silicon Valley’s hi-tech firms, or Mamede (2002) on IT consultancy in
Portugal. One could include here other industries such as higher education, biotechnology, management consultancy, law firms, among others; for a discussion of the specificities of this type of industries see, for example, Gallouj (2002).
This paper intends to contribute to fill such gap in the literature, by presenting a model that analyses the interdependencies between labour market dynamics and the evolution of industries’ structure, in situations where individuals’ job decisions are influenced by interpersonal links among workers. Being inspired by the case of those industries (see footnote 1) in which competition is based on recruitment (to borrow the expression used by Sørensen, 2004), the model takes into account some other features typically found in these contexts.
The basic features of the model are the following. There are only two types of agents: firms and specialists. Firms want to recruit as many specialists as possible, and want to attract the best specialists in the market. In this intent they face two crucial constraints: first, the total number of specialists available in the market is limited by a certain amount, so firms compete among them in recruitment; and second, firms are not able to assess the real skills of specialists (they form expectations about individuals’ real skills on the basis of their previous professional trajectories). On the other side of the market, each specialist is willing to work for firms with good technical performances, but they also value working for firms in which a high number of their acquaintances are employed. Specialists face as well a basic constraint: firms have a limited number of job positions to fill at each period, and therefore only the specialists with the highest levels of expected skills will be recruited by the most desirable employers.
The fact that firms cannot know with certainty the real skills of specialists is a central feature of the model. In the absence of such uncertainty, the outcome of the industry’s evolution would be straightforward: the most successful firms would employ the most skilled specialists and would unequivocally grow (and eventually eliminate all the rivals). Introducing information incompleteness in the functioning of the labour markets has a number of interesting implications, which the present model allows to analyse.
More specifically, while this model is able to replicate a number of well-known statistical regularities of industry evolution and of labour mobility, the underlying causal mechanisms clearly differ from the ones that are found in most models available in the literature – and are arguably more suitable than those models to the analysis of some industries. For illustrative purposes, the underlying mechanisms of the model to be presented below will be compared with the main features of Klepper’s (1996) model of industry life-cycle and the ones in Jovanovic’s (1979) model of job turnover.
The next section of the paper discusses the relation of the present contribution with the existing literature. Section 3 presents the model, and section 4 discusses the main results of the simulation. Section 5 summarises the main conclusions and implications.
2.RELATED LITERATURE
The model that will be presented in section 3 can be related to five streams of literature: studies of labour mobility, theories of industry dynamics, contemporary evolutionary approaches to economics (which partly overlap with the previous stream), research on the role of social networks in the labour markets, and case-studies of specific industries. In what follows I discuss the similarities and differences between the present model and each of those streams of research.
2.1. Labour mobility
Drawing on an extensive review of empirical studies that analyse of the stability and mobility of employment relations, Farber (1999) emphasises three central facts describing inter-firm worker mobility in modern labour markets: (i) long-term employment relationships are common (i.e., a significant proportion of workers are involved in durable employment relations), (ii) most new jobs end early, and (iii) the probability of a job ending declines with time (the relation is not necessarily monotonic – some studies find that the probability of a job change may first increase with tenure, before starting to decrease).
Different types of models have been put forward which can account for such statistical regularities. A particular influential example of such models is the one put forward by Jovanovic (1979). The building block of this model is the idea that the productivity of each particular job match is not known in advance – it is gradually revealed, with output being a noisy signal of match quality. As the expectations of both firms and workers are updated on the basis of each period’s output, both sides can decide whether to continue or to stop the employment relationship; furthermore, it is assumed that there is a fixed cost in starting a new relationship. Jovanovic’s model is particularly successful in replicating the statistical regularities listed above: initially, even if the observable output signals a bad-quality match, workers tend to remain in the firm since they know the signal is noisy and moving to a new firm involves costs; as time goes by, the assessment of match quality becomes more precise, leading either to a separation (because the match quality is too low) or to a permanent match (because its quality is high); thus, in an early phase more and more workers will decide to move, but on
the other hand an increasing number of workers is entering enduring employment relationships – and this allows to explain the non-monotonic feature of the tenure-separation relation.
In spite of its success in replicating a number of statistical regularities of worker mobility, Jovanovic’s model illustrate the tendency, often noted among students of the labour markets (see, e.g., Davis and Haltiwanger, 1999), to abstract from the effect of demand-side disturbances on employee turnover. On the contrary, in the model proposed in the present paper, the entry, exit, growth and contraction of firms is an essential (though not exclusive) ingredient in determining the inter-firm mobility of workers.
2.2. Industry dynamics
As in the case of labour mobility, the empirical evidence drawn from several studies on industry dynamics allows the identification of some statistical regularities (for surveys see Caves, 1998; Dosi et al., 1997; Geroski, 1995), including the following: the entry and exit of firms are two frequent, and very often correlated, phenomena; the distribution of the size of the firms is typically biased towards smaller scales; new firms are smaller than the average incumbent, have a small probability of survival, and those that survive grow faster than the average; several industries first verify an increase in the number of incumbents until they reach a peak, and then experience a shake-out in the number of firms, after which changes in market shares become less frequent, entry and exits are strongly reduced, and the industry structure stabilises.
Many formal models have integrated this type of regularities in their assumptions and/or replicated them in their outcomes, thereby providing alternative explanations for the observable patterns of industry dynamics. Klepper (1996) provides an example of a model that has been particularly successful in explaining several regularities found in the data – particularly in those industries that have experienced a shake-out in the number of incumbents. Shake-outs had been previously explained by Abernathy and Utterback (1978) on the following basis: after an initial period of uncertainty in which several firms offer their product innovations, a dominant design emerges in the market, reducing the uncertainty about the future technological trajectories; this creates an incentive for firms to invest in cost-reducing innovations, and the firms who are less efficient in the production of the dominant design are driven out of the market. Klepper (1996) has reversed the direction of causality, suggesting that the emergence of a dominant design is a result of the shake-out, rather than being at its origin; and the causes for the shake-out are to be found elsewhere: they are related to the fact that cost-reducing investments are more rewarding for firms operating at larger scales; firms that grow first tend to have lower costs and drive
others out of the market. After the shake-out, as prices decrease further and margins are compressed, the incentives to grow above the average will vanish, and the industry stabilises. Again, in spite of the success of Klepper’s model in replicating a number of statistical regularities associated with industry dynamics, it sheds little or no light on the ways through which changes in industry structures may be influenced by the mobility of individuals in the labour markets2 – a topic which is central to the model that will be presented below.
2.3. The evolutionary approach3
According to Nelson (1995), the evolutionary mode of explanation is characterised by its focus on a variable, or set of variables, which experience changes through time, and its main theoretical concern consists in understanding the dynamic process underlying the observed changes. Evolutionary theories suggest that the variable (or set of variables) under analysis is subjected to partially random disturbances that generate diversity in the system, and that there are mechanisms that systematically filter (i.e., select) the diversity thus generated (as Nelson notes, the predicted power of these theories strongly relies on the specification of the selective forces).
Given this general framework, the usual premises in evolutionary models are the following (Dosi and Nelson, 1994): (i) there is a continuous introduction of novelty in economic systems (which is partly exogenous to the system, and partly generated within the system); (ii) the actual and potential novelties are subjected to the pressures exerted by market (and possibly other) forces, which determine the adequacy and viability of those novelties; (iii) agents have an imperfect understanding of the present and future contexts of their actions (which is associated with the permanent introduction of novelty in the system, but also with the agents’ limited cognitive capacities), (iv) agents are heterogeneous, to the extent that they diverge in their understanding of the context and on their expectations about the future. Systems characterised by such features often display path-dependency and other properties which overrule the use of analytical approaches to modelling. On the contrary, computer simulation models – which are
2 This characteristic is shared by most models of industry dynamics, including the ones put forward by
Nelson and Winter (1982), Jovanovic (1982), Hopenhayn (1992), Jovanovic and McDonald (1994), Ericson and Pakes (1995), Klepper (2002), and Winter et al. (2003).
3 In the present context, the ‘evolutionary approach’ is understood as the type of modelling strategy that
particularly well-suited to the analysis of the patterns of structural change4 – are typically used
as the basic instrument of theoretical development.
Notwithstanding the fact that the prevailing evolutionary models of industry dynamics are basically silent about the role of labour mobility, the model to be presented below has all the features listed in the previous paragraph – and in this sense can be considered as being part of the evolutionary family.
2.4. The role of social networks in the labour markets
The fact that social networks can, and often do, influence the dynamics of labour markets has long been emphasised by economic sociologists (see Granovetter, 1995), and has been increasingly discussed by labour economists (e.g., Montgomery, 1991; Bentolila et al., 2004; Pellizzari, 2004). Studies within this tradition have revealed that employers and employees tend to know (or, at least, have information about) each other even before the beginning of their labour relation; and that social networks are extensively used by both firms and workers to find jobs and fill vacancies.5
Granovetter’s approach has a clear dynamic flavour, which is of interest here: worker mobility is not only (partly) determined by the social structure, but it helps in turn to change the social structure itself – since new personal links are being established as workers move between firms. And while his framework does not take into account the dynamics of firms and industries, it can easily be extended in order to consider the co-evolution of social networks, worker mobility and industry structures.
The model presented in this paper applies the same «structure shapes mobility, mobility shapes structure» kind of logic, to a context in which ‘structure’ refers both to social networks and to populations of firms. However, the role played by networks in determining job matches is not related here to the availability of information about job opportunities (the main focus of
4 In computer simulation models the conclusions obtained typically are in the form of time series of
specific numerical values, contrasting with analytical models where the conclusions sought are usually in the from of relations among the variables and parameters (for an early, and stimulating, discussion on this contrast see Cohen and Cyert, 1961).
5 Granovetter (1995) tends to emphasise the benefits of social networks for individual (not necessarily
social) outcomes in the labour market; namely, he suggests that: information given by personal acquaintances about the nature of a job is often considered more reliable; acquaintances may facilitate individual integration and learning in organisations; having personal acquaintances among colleagues can facilitate the access to promotion and other discretionary benefits (especially, if those acquaintances are well positioned in the organisational power structure, and if contracts are more difficult to be drawn exhaustively and enforced). On the other hand, it has been shown that in some contexts jobs found through acquaintances may be associated with lower wages – see, e.g., Bentolila et al., 2004; Pellizzari, 2004.
Granovetter’s analysis), but rather to the way they affect workers’ preferences in their job decisions.6
2.5. Industry specific case-studies
The basic motivation for the development of the model to be presented below is the fact that the mutual influence between the dynamics of industries and the inter-firm mobility of workers is often shown to be crucial in many industries, notwithstanding the scarcity of models considering such bidirectional causation. Theoretical and empirical inquires of industry evolution which abstract from the role of labour market dynamics (or vice-versa) in those contexts risk missing the main elements of the dynamic picture they propose to explain.
The strategy followed in the development of the present model was based on the attempt to capture, in a stylised form, some basic mechanisms and factors which affect the evolution of a specific type of industries (as they emerge from the empirical studies of such industries).7 In the
present case, the model is inspired by studies on the evolution of consulting industries (Gallouj, 2002; Mamede, 2002) which show that the growth of firms is very much affected by their capacity to recruit new specialists and to avoid poaching by competitors. This type of work also suggests that the general level of employee’s skills strongly influences the quality of the services provided, and therefore firms’ reputation and their prospects for future growth. Problems of incomplete information are pervasive in those industries. Consultancy is a highly idiosyncratic process in which the employees of both the services providing firms and of the client organisations interact extensively, and the outcomes of which strongly depend on the quality of the interactions between the personnel of both organisations. Given the relevance of idiosyncratic elements for performance, the relevant individual skills are not easily assessed on the basis of diplomas or other certificates. Moreover, consulting projects are most of the times a work done by teams of specialists, and it is often the case that firms are not able to differentiate between the individual contributions of each of the members involved. These features have two important implications: first, employers have to rely on less than perfect proxies of individual skills – such as individuals’ past job trajectories; second, individuals are typically not paid on the basis of their individual productivity – performance prizes that compensate all the members 6 The idea that individuals prefer to work in organisations that already employ their acquaintances can be
rationalised, for example, in terms of reduced costs of integration, easier access to promotions and other discretionary benefits, or emotional comfort.
7 In this sense, this model is close to the so-called ‘history-friendly models of industry evolution’ (Malerba
et al., 1999). However, my intention here is not to confront the outcomes of the simulations with the historical trajectory of any specific industry, as is often claimed to be the case with models belonging to the ‘history-friendly’ type. Instead, simulations are here used as ‘computer-aided thought experiments’ (in line with the approach suggested by Simon, 1996) that allow to rigorously analyse the implications of theoretical claims concerning causal mechanisms that are active in the ‘real world’.
of the teams without discriminating on the basis of individual efforts are a common feature in the industry (giving an incentive for individuals to move to the best performing firms, where collective prizes are expected to be higher).
As will be clear in the following section, the assumptions of the model try to reflect some essential features of such industries.
3.THE MODEL
The main features of the model are as follows. There are only two types of agents: firms and specialists (M is the set of firms, and N is the set of specialists). Firms provide consultancy services to the market, while specialists are employed by those firms. The consultancy services are assumed to be in high demand, so the size of the industry is constrained only by the number of specialists available. At each period (i.e., at each simulation step) specialists decide to which firm they want to work in that period, and firms decide which specialist they want to recruit. In their intent firms face two crucial constraints: first, the total number of specialists available in the market is limited by a certain amount, so firms compete among them in recruitment; and second, firms are not able to assess the real skills of specialists (they form expectations about individuals’ real skills on the basis of their previous professional trajectory). On the other side of the labour market, specialists are willing to work for firms with the best performance (since it is assumed that specialists’ financial rewards are partly dependent on their employers’ performance levels), and their choice may also depend on their location in the social network of specialists (it is assumed that specialist attach a positive value to working with personal acquaintances); but specialists face as well a basic constraint: firms have a limited number of job positions to fill at each period, and therefore only the specialists with the highest levels of expected skills will be recruited by the most desirable employers.
These basic features constitute the basis of the coupled dynamics which is central to the model: firms’ entry, exit, growth and contraction depend on the mobility of specialists in the labour market; the job decisions determining worker mobility are influenced by the performance of firms and the establishment of social links among workers; the evolution of the social network is shaped by both the mobility of workers and the evolution of firms.
In what follows I present the assumptions concerning the decisions of firms and individuals, the role of social networks, the functioning of the labour market, and the dynamics of the industry.
3.1. Firms’ size, performance, and expectations
Size. Let Bt: NxMt → be a function defining the nature of the work relationship between
each i є N and each q є M
0,1 t, such that: t at time q for not work does i if 0 t at time q for works i if 1 t iq t iq b bThe set of specialists working for firm q at time t is given by St(q) =
i N :bt =1
iq and the size of firm q at time t is given by
d
Nt(q
)
= |St(q)|. The set of firms for which specialist i is workingat time t is given by ()
bt =1
iq i
Et qMt : , and the following condition is imposed: = |E
) (i
dt M
t(i)| ≤ 1 (i.e., each specialist is employed at most by one firm at each period).
Performance. The performance of a firm in each period is determined by the skills of the specialists working for the firm during that period. Specialists’ real skills are assumed to be identically and independently distributed, according to a normal probability function (with mean μ and standard deviation σ being parameters of the model), at the beginning of the simulation, and to stay fixed thereafter. Let s(i) represent the level of real skills of specialist i. Then, the performance of firm q at period t, PFt , is given by the average real skills of the firm’s employees, that is:
q (1) ) ( ) ( ) ( q d i s PF t N q S i t q t
where, as before,
d
t(q
)
is the number of individuals working for firm q at time t.N
Expectations on skills. Individuals’ real skills cannot be directly observed by the market. In order to assess individuals’ skills, the demand side of the labour market takes into account the performance of the firms for which the individual has worked in the past; when individuals enter the labour market for the first time, their expected skills are equal to μ (the mean value of the distribution of real skills). Accordingly, the skills individual i is expected to hold at time t,
, are given by the equation:
1 t (2) 0 = | ) ( | if 1 = | ) ( | if * ) 1 ( ES * 1 1 1 ) ( 1 -t i 1 1 i E ES i E PF ES t t i t i E t i t t
where β є [0,1] is the autocorrelation factor of individuals’ expected skills (it is the same for all individuals), and is the last period’s performance of the firm employing individual i by that time. It is assumed that all the agents in the market (i.e, both firms and individuals) form their expectations about individual i’s skills at time t according to equation (2).
1 1() t t i E PF
3.2. The decisions of specialists and firms
The following assumptions concerning the determinants of individuals’ and firms’ behaviour are made.
(i) Firms’ revenues and costs. The level of fees per specialists of firm q at time t, , is directly proportional to the firm’s performance in the previous period:
; the total revenues of firm q at time t are given by , where Q represents the scale of services provision. Labour costs are the only costs to the firm, and the firm’s total revenues are redistributed among the firm’s employees. t q P T t M q PF P t q t q / 1 0, , )] ( [ * ) (PFt-1 q Q d q P TR t N t q t q t q
(ii) Specialists’ compensation. There are two elements in specialists’ financial compensation: wages (w) and performance prizes (wz). Specialist i’s wage at time t, , is independent of the employing firm and is directly proportional to the specialist’ expected skills at t (which is common to all firms in the market, as seen above): . On the contrary, the performance prize of specialist i at time t, , varies between employers and is determined in the following way:
t i
w
i , 0 N t T ES w t i t i / , t iwz
T t M, (q), S i , )] ( [ ) ( TR t ) ( t q
q q d Q ES w wz t N t i q S i t i t .Put differently, the difference between a firm’s total revenues and total wage costs is equally distributed among the firm’s employees.8
These assumptions imply that individuals prefer to work for firms with a better performance, for two reasons: first, firms which perform better pay higher performance prizes; second, the wage component of specialists’ financial compensation is proportional to their expected skills, and the latter depend on the performance of the firms they have worked for in the past.
8 This reflects the notion that firms are only able to observe the performance of teams of specialists, not
the individual contributions to performance. Therefore, every employee receives a share of the surplus, regardless of his actual contribution to the firm’s performance.
On the other hand, it is not obvious from those assumption what should be the behaviour of firms (namely, since all the revenues are distributed among the workers and thus profits are null). To keep matters simple, its is assumed that firms’ goal is to survive for as many periods as possible, and that in order to fulfil that goal they follow two simple decision rules in every period: (a) they want to hire as many specialists as possible, and (b) they prefer to hire those specialists with the highest (expected) skills.9
However, there is a limit to firms’ growth per period. The maximum total number of job contracts each firm can perform at each period, MCt , is fixed according to the following
equation: q (3) MCtq =
q 1 q 1 1 qt
if
0
)
(
and
t
t
if
)
(
*
0
)
(
or
t
t
if
0
t
q
d
q
d
q
d
t N t N t N
where is the time of entry of firm q, is the number of employees of firm q in the previous period, is a fixed maximum growth parameter (it is positive to assure that the potential rate of growth is higher for smaller firms
q
t
dt1(q) N 10), >1 is a growth rate parameter, and
gives the maximum number of employees of a firm at the time it enters the market, .
N0
t
qFinally, in assessing the value of working for each firm, individuals consider not only the performance of that firm, but also the number of links they have with other specialists working for the same firm. The way interpersonal links (and their value for specialists) are formalised is described below.
3.3. The role of social networks
Let At: NxN → be a function defining the nature of the relationship between any two
individuals, such that, for any i,j є N:
0 ,1
t
at time
linked
not
are
j
and
i
if
0
t
at time
linked
are
j
and
i
if
1
t ij t ija
a
9 The adequacy of such rules in the present context is discussed below, and in particular in the annex. 10 This is in accordance with most empirical findings concerning the so-called ‘Gibrat’s Law’ of
The set of interpersonal links individual i has with individuals working for firm q at time t is then given by ()
j S (q) :at =1
ij t i Ltq , and the total number of interpersonal links individual i has among firm q’s employees at time t is given by d (i) | Lt(i)| .
q t
Nq
Interpersonal links between individual specialists arise from the dynamics of the labour market.11 Two individuals may become linked at time t only if they are working in the same
firm at t. The probability of two not yet linked colleagues establishing an interpersonal link among them (conceptualised as a Bernoulli trial) is a decreasing function of the size of the employing firm.12 I.e., for every i, j є N:
(4)
) ( and ) ( ) ( if )] ( [ 1 ) ( ) ( if 0 ) 0 | 1 ( 1 i E j E i E i E d j E i E a a p t t t t N t t t ij t ijwhere is the number of specialists employed by i’s (and j’s) employer at time t. Futhermore, (that is, once they are formed, interpersonal links are never dissolved). )] ( [E i d t N ( t ij a p 1| t1 1)1 ij a
As suggested above, when choosing between two identically performing firms, specialist i will choose to work for the firm that employs the highest number of her personal acquaintances. The value to individual i of working for firm q at time t (given that q was an incumbent at t-1 – otherwise, see below), Vt(q), is then given by:
i (5) V (q) PF 1*[1 LF( ,dt (i))] Nq t q t i
where is the performance of firm j at time t-1, LF(.) is a function specifying the impact of interpersonal links on individual’s i valuation of firm q as an employe (i) is the number of interpersonal links individual i has among firm q’s employees at time t, α>0 is a scale parameter (which defines the value specialists attach to each individual they know in each firm). That is, when assessing the value of working for a certain firm, each individual takes into account that firm’s performance level and adds to this value some percentage points for each
1 t q
PF
r,dt Nq
11 It is assumed for simplicity that there are no interpersonal links before the start of the industry’s
evolution. The model can be easily extended in order to analyse different configurations of the initial network structure.
12 The intuition here is that as the scale of the firm increases there will be fewer opportunities for any two
form,
ees).
link he has among the firm’s employees, according to the ‘link function’ LF(.). This function can assume alternative forms. In the simplest possible case, LF(.) assumes a linear functional
) (i
t
Nq , implying that the marginal value of each link is constant (that
is, the same value is attached to every new link, irrespectively of the number of links the individual already has among the firm’s employ
. )) ( , ( d i d LF t Nq
) (q Vtq i 3.4. The matching mechanism
The job matching is done in the following way. Every period the labour market opens up. The list of specialists in the market is sorted in decreasing order of their expected skills and, for each individual, the list of firms is sorted in decreasing order of their value as employers. The first specialist in the list of individuals is allocated to the first job vacancy available, starting from the firm he values the most as an employer, and following the sorted list of firms; when the matching between the first individual and his preferred job vacancy has been achieved, the process is repeated for the other individuals in the list, following the ranking of expected skills, until all specialists have been allocated to some firm.13
3.5. Entry and exit of firms
At time t=0 (that is, before the beginning of the simulation) there are no firms. From t=1 onwards, at each simulation step t є T, one individual (the ‘entrepreneur’) is randomly picked among all the specialists14, and starts a new firm (firm q enters the industry at t=tq, for every q є
M).
New firms are assessed on the basis on their entrepreneurs’ skills (and not, as before, on the basis of the firm’s past performance, of course). Let e(q) represent the entrepreneur of firm q; then, the value to individual i of working for firm q at time t= tq is given by
(5’) ES(q) *[1 LF( ,dtq(i))] Nq t
q
e
13 The most attentive reader will note a contradiction between this assumption of the labour market
opening up in every period, and the assumption that specialists choose employers according to the interpersonal links they have in each firm. In fact the former assumption seems to suggest that specialists are changing firms at every period, so it does not seem to make much sense to consider who was working where in the previous period. In fact this is not the case: while that matching scheme greatly simplifies the computation of the dynamics, the labour market turbulence associated with it is only apparent – as soon as interpersonal links are formed, specialists will start to cluster within some firms, meaning that they will usually find their acquaintances in the firms to which they choose to work (although some coordination failures are expected to occur, specially in the more turbulent phases of the industry’s evolution – as it happens in the real world).
where (that is, when a new firm is formed, each specialist has at most one link – the entrepreneur her self – with the firm’s specialists).
i N idtq
Nq() 0 ,1,
Accordingly, the dynamics of this industry works as follows. In the first step of the simulation, one specialist is randomly chosen to start a new firm. At this point, the system has not produced any further information: there are no interpersonal links to influence job decisions; specialists have all the same expected skills (formally, j), including the new firm’s entrepreneur; therefore, a given number of specialists (see parameter λ in equation 3) will be randomly allocated to the first firm entering the market. But from the very first period onwards, firms will display different performance levels (since specialists’ real skills differ), a network of personal links will start to be formed, and consequently firms will start to differ in their capacity to recruit specialists. On the other side of the labour market, specialists will immediately start to differ in their expected skills according to the firms they have been working for. Each new firm entering the market will then inherit the characteristics of its entrepreneur, what includes the entrepreneurs’ expected skills (which is initially taken as a proxy of the firms’ competences) and her position in the network of interpersonal links; in other words, the post-entry performance of each new firm will partly depend on the past trajectory of its entrepreneur (it will also depend on the firm’s success in the noisy process of recruitment).
i N, j i, , t j t i ES ES
Throughout the simulation run some firms will grow and others will shrink. When incumbent firms loose all its employees (or when a new firm is not able to recruit any specialist besides its founder for a number of subsequent periods) they exit the industry; in the case of unsuccessful entries, the new firms’ entrepreneurs will re-enter the labour market, and eventually be recruited by an incumbent firm.
I turn now to the analysis of the possible outcomes of such dynamics.
4.THE RESULTS OF THE SIMULATION
The main aim of the model that was presented before is to study the implications of the interdependency between industry dynamics and labour mobility, in a context where interpersonal links influence individuals’ job decisions. Given that aim, the analysis of the simulation outcomes is focused on the variations in the parameter α – which determines the value that specialists attach to links with other individuals when assessing firms as potential employers (see equations 5 and 5’) – while other parameters are left unchanged.
Thus, in all the simulations to be discussed below both the number of specialists and the number of periods (which determines the number of firms entering the market) were fixed at 250. The mean of the distribution of individuals’ real skills was normalised to 1 and the standard deviation was fixed at 0,25. The autocorrelation factor of individuals’ expected skills (parameter
β in equation 2) was fixed at 0,9. The initial maximum size of potential entrants was fixed at 3,
and parameter γ and in equation 3 were fixed at 2 and 1.05, respectively. Each simulation for each set of values of these parameters was repeated 30 times in order to analyse the robustness of the results. In section 4.3 below, I discuss the criteria underlying the choice of these values and the consequences of changing them in terms of simulation outcomes.
The main indicators used in the analysis were the following15:
final number of incumbents: the number of firms employing more than 1 individual at the final step of the simulation;
four-firm concentration ratio: the combined market share of the four largest firms in the industry (ranging from 0 to 100) (C4);
Hirshman-Herfindahl index: the sum of squares of the market shares of all the firms in the market (ranging from 0 to 10.000) (HHI);
industry turbulence: the sum of firm exits and entries divided by the total number of incumbents;
proportion of job changes: the number of individuals who have moved to a new firm divided by total employment;
network density: the number of pair-wise links that were established among individuals over the total number of possible pair-wise links;
The remainder of this section presents the most relevant results of the simulation exercises.
4.1. When interpersonal links are irrelevant (α=0)
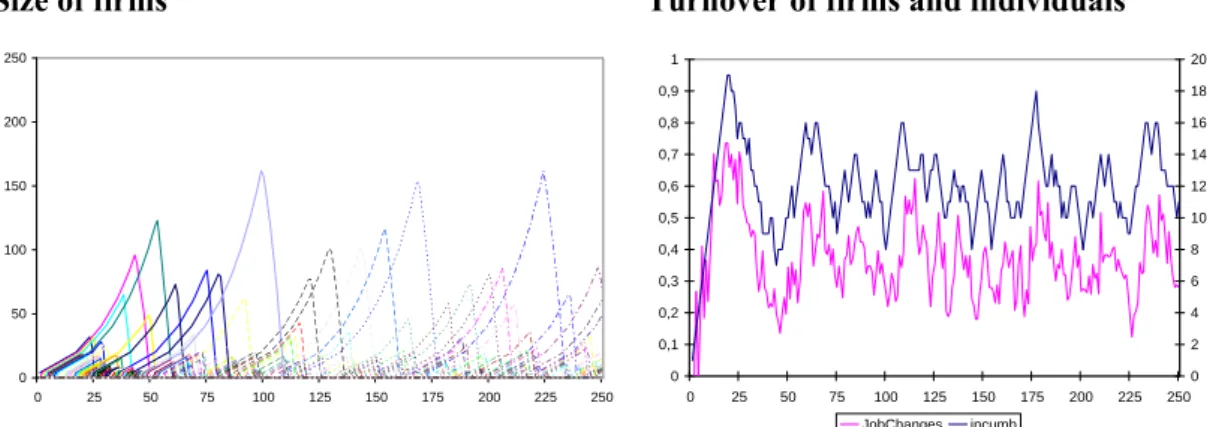
When specialists do not attach any value to interpersonal links (or when these are simply absent), individuals’ job decisions are determined only by the performance of the firms in the market. That is, individuals will prefer to work for firms with the best performance possible. But since firms’ performance levels are determined by the average value of real skills of their employees, the performance levels of firms will vary as they grow and as workers move from firm to firm. This gives rise to such dynamic patterns as the ones illustrated in Figure 1 below.
Size of firms 0 50 100 150 200 250 0 25 50 75 100 125 150 175 200 225 250
Turnover of firms and individuals
0 0,1 0,2 0,3 0,4 0,5 0,6 0,7 0,8 0,9 1 0 25 50 75 100 125 150 175 200 225 250 0 2 4 6 8 10 12 14 16 18 20 JobChanges incumb
Figure 1 - Industry and labour market dynamics when links among individuals have no value (α=0)
The graphs presented above illustrate the main patterns of industry evolution and labour market dynamics. On the left-side we have the evolution of firms’ size, with the vertical axis measuring the number of employees. The right-side graph shows both the evolution in the number of incumbents and the proportion of individuals changing jobs at each period.
In Figure 1 we observe a situation of great instability, where each firm grows quickly after it enters the market, until it reaches a peak. After that point the number of employees rapidly decreases, and the firm eventually exits the market. It can also be noticed that the patterns of job mobility follow closely the evolution of incumbent firms: when the number of incumbents is small, the proportion of employees moving to a different firm in each period is lower; contrarily, it is in the periods during which a higher number of firms is able to survive after entry that we observe the highest levels of job changes.
The cause for such behaviour resides on a paradoxical process in which competitive success is itself the cause of firms’ failure. As a result of both the random process of firm creation (which
leads to firms entering the market with varying levels of performance, depending on their entrepreneurs’ skills) and the noisy job matching mechanism, a certain firm is able to sustain high levels of performance for a number of periods. Its superior performance allows it to hire more employees than the competitors, and consequently it grows above the average. Ideally, this firm would be able to identify the best specialists to hire, and the most skilled individuals in the market would want to be employed by such firm (since it would certainly be the best performing firm in the industry). But as the firm grows, since the assessment of individuals’ real skills is less then perfect, it will eventually start to hire specialists whose skills are below the firm’s current average, and therefore its performance will start to decrease. The most direct competitors will soon surpass the firm’s performance level and begin to attract its employees, starting with the ones most valuable to the market (what accelerates the process of declining performance and consequent shrinking of the former leading firm). One of such competitors eventually becomes the biggest firm in the industry, and as it reaches its highest level of performance the same process happens again and again, until the end of the simulation.16
In the following sections I discuss how the outcomes of the model change when social networks are considered.
4.2. The value of interpersonal links
As explained in part 2 above, the worth of interpersonal links (henceforth referred to as ‘link value’) is here modelled in a straightforward fashion: given any two firms with identical performance levels, a specialist prefers to work to the firm within which she has the highest number of personal links. In the present section I concentrate on the case of the linear form of the ‘link function’, and discuss at the end the implications of using alternative specifications.
It should be clear what to expect in terms of individual decisions when we start considering the presence of valuable interpersonal links: as the industry evolves, individuals will establish links with some of the other employees working for the same firm; while the number of interpersonal links is low, these should not prevent the mobility of workers between firms; but such links will subsist even if individuals move to different firms, and they will influence individuals’ future job trajectories; firms employing a higher number of someone’s acquaintances will become 16 In such scenario one may question the validity of the assumption that firms are willing to grow as much
as possible; in this context the outcome of such decision is always deleterious to firms’ performance, and one could argue that firms would be able to prolong survival by imposing some threshold on the expected skills of prospective employees. In annex A.1 I make use of survival analysis in order to show that employing as much specialists as possible (irrespectively of their expected skills) is on average the best strategy to follow; this is even more so as soon as social networks start playing a role in specialists’ job decisions, as will be shown. The reason for this result is to be found on the strong information incompleteness that characterises the model.
more attractive to that individual as potential employers; thus, we can expect to observe groups of linked individuals ending up working for the same firms; furthermore, as interpersonal links are fostered inside firms, when individuals stay for longer periods in the same firm it becomes more probable that they establish links with all the others co-employees (namely, with those that did not influence the individual’s initial decision to work there). In sum, introducing interpersonal links as a factor influencing individuals’ job decisions is expected to bring about some stabilisation in the evolution of the industry’s structure.
In fact, this will be shown to be the case. Irrespectively of the functional form used to account for the value of interpersonal links, as the level of ‘link value’ increases, the proportion of individuals changing jobs at each period decreases and the industry becomes less turbulent (and, consequently, the number of incumbent firms stabilises). The precise way in which that happens, and its consequences in terms of industry evolution and labour market dynamics will become clear below.
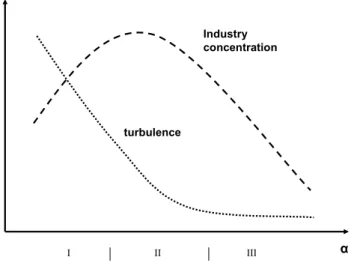
Figure 2 illustrates how increases in the level of the ‘link value’ parameter, α, affect the patterns of the industry’s structural evolution, namely in terms of industry concentration and of turbulence in both sides of the labour market.
turbulence Industry concentration α I II III
Figure 2 – The impact of changes in ‘link value’ (parameter α) on the patterns of industry evolution
The graph displays three distinct areas, which correspond to different types of outcomes that are obtained as the level of ‘link value’ increases. As one could expect, for low levels of ‘link value’ (area I) the model does not behave differently from the case of valueless interpersonal links (see section 4.1): in this case, the patterns of industry evolution and labour mobility are
characterised by great instability, with workers frequently moving between firms and firms rapidly contracting after they have reached a peak in size.
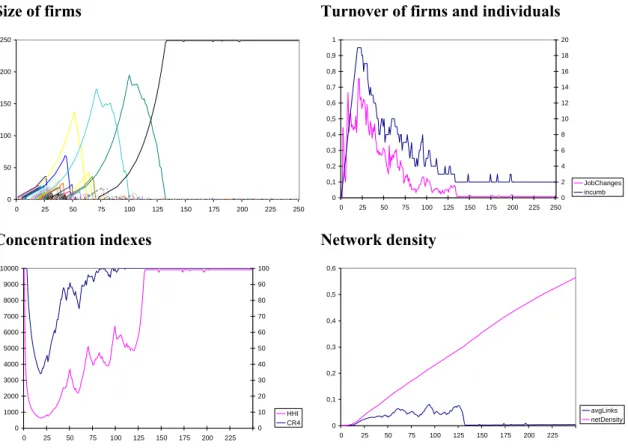
However, as the ‘link value’ increases the model starts to reveal more stable dynamic patterns. For intermediate levels of the ‘link value’ parameter (area II in Figure 2), after an initial period of high industry turbulence and frequent job changes, the industry stabilises in a highly concentrated structure, typically a monopoly. Figure 3 below shows the main features of such situation (the ‘link value’ parameter is fixed at 1%).
Size of firms 0 50 100 150 200 250 0 25 50 75 100 125 150 175 200 225 250
Turnover of firms and individuals
0 0,1 0,2 0,3 0,4 0,5 0,6 0,7 0,8 0,9 1 0 25 50 75 100 125 150 175 200 225 250 0 2 4 6 8 10 12 14 16 18 20 JobChanges incumb Concentration indexes 0 1000 2000 3000 4000 5000 6000 7000 8000 9000 10000 0 25 50 75 100 125 150 175 200 225 0 10 20 30 40 50 60 70 80 90 100 HHI CR4 Network density 0 0,1 0,2 0,3 0,4 0,5 0,6 0 25 50 75 100 125 150 175 200 225 avgLinks netDensity
Figure 3 - Industry and labour market dynamics for intermediate levels of the ‘link value parameter
In addition to the graphs displaying the firms’ size and the turnover of firms and individuals (which were introduced in Figure 1 above), Figure 3 presents two other graphs. On the lower-left quadrant we have the C4 and the HHI concentration indexes. The lower-right chart shows the evolution of the network density, together with the external links statistic (which only considers the links among individuals working for different firms, when calculating the network density).
Just as in the case of irrelevant interpersonal links, during the first half of the simulation run we can observe a recurrent situation in which some successful firm grows above the others for
some periods, and then it invariably starts shrinking until it looses all its employees. However, two main differences in comparison to the situation analysed in section 4.1 can be identified from the simple inspection of Figure 3: first, the successive leading firms are able to reach increasing scales and survive for longer periods; second, in this sequence of successive leaderships, at some point one firm is able to capture all the labour force, and from that moment onwards it becomes the indisputable monopolist.
Again, it is immediately clear how the introduction of interpersonal link effects brings about this aggregate outcome. At every step of the industry’s evolution, new interpersonal links are being established among co-workers. As the number of links grows, they increasingly interfere in individuals’ job decisions. During the initial stage of the process the number of links is not sufficiently high to avoid great job turnover; this allows the simultaneous presence of a relatively high number of incumbent firms, which operate in a rather unstable competitive environment (along the lines described before for the baseline simulation). But as the number of links grow, the ‘link effect’ will allow some firms to attract an increasingly high number of individuals to their ranks; the reverse of this is that it becomes ever more difficult for other firms to survive, leading to a ‘shake-out’ in the number of incumbents, soon after the industry has reached its highest number of operating firms. After some firm has become the dominant player in the industry (i.e., after it captures about 40% of the labour force), very demanding conditions are required for another firm to overcome the dominant one.
In order to understand how changes in industry dominance can take place, one needs to take into account the fact that firms are not born equal; in fact, when they enter the market their initial performance is dependent on the skills of their first employees, in particular the ones of the founding entrepreneur. Furthermore, entrepreneurs are differently positioned in the network of interpersonal links, which means that, from the very beginning, firms are differently able to attract individuals and retain them in their ranks. After the industry’s shake-out takes place, only firms that enter the market with very high performance levels and with adequate links to other firms’ employees are able to survive. Still, these are necessary, but not sufficient conditions for survival. In fact, it may happen that a firm which enters the market with the ‘right’ characteristics (in terms of expected performance and interpersonal links) is nevertheless unlucky during the noisy job matching processes (i.e., in a number of successive periods the firm hires individuals whose skills are lower than expected). In sum, for intermediate levels of the ‘link value’ parameter, as the selection conditions become tougher (due to the increasing density of interpersonal networks, especially within the dominant firms), firm survival demands not only superior characteristics but also chance. At a certain stage the density of the network of
interpersonal links is too strong for any entering firm to be able to capture employees to its ranks, and the industry stabilises in a monopolistic structure.
Finally, for higher levels of the ‘link value’ parameter (area III in Figure 2), we obtain less concentrated and even more stable patterns of industry structure. In fact, after some threshold, further increases in the level of ‘link value’ imply an increase in the average number of incumbents and a corresponding decrease in the concentration ratios. Figure 4 below presents the typical outcome of a simulation when the ‘link value’ parameter is fixed at 5%.
Size of firms 0 50 100 150 200 250 0 25 50 75 100 125 150 175 200 225 2
Turnover of firms and individuals
Concentration indexes 0 1000 2000 3000 4000 5000 6000 7000 8000 9000 10000 0 25 50 75 100 125 150 175 200 225 250 0 10 20 30 40 50 60 70 80 90 100 HH CR Network density 0 0,1 0,2 0,3 0,4 0,5 0,6 0 25 50 75 100 125 150 175 200 225 250 avgLinks netDensity
Figure 4 - Industry and labour market dynamics for high levels of the ‘link value’ parameter
As can be seen in the graphs above, some of the dynamic patterns are common to the ones identified for intermediate levels of the ‘link value parameter’: once again we have an initial period during which many firms enter the market and are able to survive and grow for a number of periods, and during which individuals are changing jobs frequently; after that, some firms are able to grow above the others, attracting a high number of workers, and causing a shake-out in the number of incumbent firms. But the similarities with the previous case stop here. In fact, by comparing the graphs it can be noticed that the proportion of job changes in the initial period has decreased. This means that, as could be expected, interpersonal links start to influence
0 0,1 0,2 0,3 0,4 0,5 0,6 0,7 0,8 0,9 1 0 25 50 75 100 125 150 175 200 225 250 0 2 4 6 8 10 12 14 16 18 20 JobChanges incumb
individuals’ job decision since the early evolution of the industry; as a result, individuals more easily ‘get stuck’ in a firm (which explains why the proportion of links external to the individuals’ own employing firms is even lower than before – see chart in the bottom-right quadrant).
Consequently, firms which perform well enough in the early stage are more likely to survive, even if their performance levels decrease afterwards – since they can rely on the influence of interpersonal links among its employees to prevent poaching from competitors. The ‘first-mover advantages’ are not limited to the ability to retain present employees: firms that enter the market early and which maintain high levels of performance for a while are more able to attract individuals with high expected skills (and retain them in their ranks afterwards).
However, such ‘first-mover advantages’ are not absolute. As illustrated in Figure 4, even firms which attempt to enter the industry after the shake-out episode may be able to grow and survive. This is because the successful incumbents tend to reduce their performance levels as they grow; just as in the case where interpersonal links were irrelevant (see Figure 1), growth is a source of risk to firms, since in order to grow firms have to hire individuals whose skills may be lower than the firms’ current average (and in fact this can be expected to happen after some point, since firms start by hiring those individuals whose expected skills are highest). But in the present case, the ‘risk of growth’ is not as high as before, since firms can rely on the network of interpersonal links. That is, market leaders can afford to have lower performance levels than competitors. Therefore, as long as their entrepreneurs are highly skilled and have good links to other workers, late-comers may still achieve a considerable competitive position.
But this is true only up to some point. After a number of periods the network of interpersonal links inside the firms is so dense that it becomes virtually impossible for prospective entrants to attract workers to their ranks. Every attempt by an entrepreneur to launch a new venture is doomed to failure (and those individuals tend to go back to their former employing firm, where the number of interpersonal links among the employees is highest).
If we increase even more the level of the ‘link value’ parameter, the result is that the average number of incumbents will increase even more: interpersonal links will start influencing the results even earlier in the industry’s evolution, and firms will more easily retain employees, in spite of their relatively low performance. This also means that successful entry becomes more probable in later periods, since there will be more incumbent firms with low levels of performance, which can be challenged by ‘late-comers’.
4.3. Robustness issues
The complexity of the model presented in this paper was deliberately kept at a relatively low level. Its development aimed at illustrating the possibility and usefulness of considering the coupled dynamics of industry structures and labour mobility – something that has been absent from most models available in the relevant literature. Therefore, in order to focus on that aim and avoid unnecessary complications, the number of parameters and behavioural equations were kept to the minimum.
In spite of this option for a parsimonious approach to modelling, the space of parameters in the present model is virtually infinite (as is often the case with simulation models). In fact, the results presented in the preceding sections are based on the exploration of variations in the value of a single parameter, α. It is then worth to discuss the criteria behind the choice of parameterisation used, and the possible implications of changes in the parameter values.
4.3.1. The choice of parameter values
In what regards the choice of parameter values, three different cases can be distinguished. First, there are those parameters in which the choice of values was determined by the constraints imposed by the software used for the analysis of the results. These were: |N| (the number of specialists), |T| (the number of simulation steps) and |M| (the number of entering firms, which is attached to the value of |T| – see section 3), all of which were fixed at 250. An arbitrary choice of |T| (and, consequently, |M|) could be problematic if the dynamics of the system for t>|T| would lead us to modify the main inferences emerging from the analysis. However, the discussion above was basically centred on the mechanisms leading to an initial rise in the number of incumbents followed by a shake-out the industry structure (for moderate and high levels of parameter α) and the value of |T| is more than enough to study those effects. On the other hand, changes in |N| (the total number of specialists) lead to variations in the number of incumbent firms, but, as could be expected, do not modify the general dynamic patterns of the system.
A second case regards those parameters that determine the limits to the size of firms. These include (see equation 3): λ (which determines the maximum initial size of firms), and γ and δ (which determine the maximum number of specialists a firm can recruit in each later period), as
a function of its size in the previous iteration. Here the choice of parameter values was done on the basis of empirical data; namely, I have used Portuguese annual data on knowledge-intensive business services (KIBS) firms during the period 1991-2000.17 In what concerns parameter λ, I
have simply computed the average size those firms in their first year of life – which was 3,13 (and, accordingly, the value of λ was fixed at 3). In order to fix the values of γ and δ I have proceeded as follows: first, I have computed the maximum growth, MG, which was observed for each firm size from one year to the next, during the whole period covered in the dataset – this was taken as the empirical counterpart of variable MCt in equation 3; second, I estimated
the empirical model MGt =a+b*N +εt where Nt represents the size of firm q at time t;
the estimated coefficients were a=22,33 and b=1,309. These results give us a linear approximation to the relation between the size of a firm in one year and its potential maximum size in the year after; it is, however, improbable that the year, as a time unit, constitutes the most adequate empirical counterpart of the simulation steps in the present model. In fact, simulation steps represent in this context the moments in which the labour market opens up and new job matches are obtained. It is reasonable to think that, in reality, this will take place at time periods shorter than one year, such as quarters or months. Therefore, assuming that the maximum potential annual growth of all the firms in the database would be obtained according to the function MCt =22,33+1,309*N , I have computed the quarterly and monthly equivalents of
such growth pace, and estimated new empirical models in order to obtain the coefficients relating firms’ size and firms’ potential growth at those shorter time spans. The estimated coefficients were a q q 1 t q q q q 1 t q
Q=2,174 and bQ=1,07 for quarterly changes, and aM=1,295 and bM=1,023 for
monthly changes. The values for parameters γ and that were used in the simulations discussed above (to recall, γ=2 and =1.05) are in between the quarterly and monthly estimated coefficients in the potential growth equation.
The third case regards the two remaining parameters of the model: the mean of the distribution of specialists’ real skills, μ (which was normalised to 1); the standard deviation of that distribution, σ (its value was fixed at 0.25); and parameter β in equation 2 (the autocorrelation factor, determining the way expectation of specialists’ skills are formed in the market – which was fixed at 0.9). The problem with these parameters is that it is hard to identify measurable empirical counterparts that can guide us in fixing their values, and therefore the decision
17 For a definition of KIBS see EMCC (2005). For a description of the official database which was used in
the present context, «Quadros de Pessoal» (organised by the Portuguese Ministry of Labour and Social Solidarity) see, for example, Cabral and Mata (2003).