1
Regional Innovation Performance of Firms in Portugal Purificación Vicente Galindo1, Teresa de Noronha Vaz2,
Peter Nijkamp3 and Eric de Noronha Vaz4
Abstract
Portuguese strategic choices on innovation and R&D have led, over the past two decades, to an improved situation of positive achievements, in which the regions of Lisbon and Algarve have taken the lead and are the only ones in the country to converge towards the European average growth rate. Regarding the other Portuguese regions – despite significant national growth rates in the 1990s as well as a successful attempt to cope with the EMU –, these are lagging behind the EU average in what concerns gross production, investment or employment generation. Meanwhile, one of the greatest public policy efforts was to diffuse much of the European funds across the entrepreneurial tissue. After a long pathway, it is now timely to evaluate the firms’ contribution to national and regional growth, their obstacles and impacts.
For the purpose of this paper, innovation has been employed here as a major contributor for the policy evaluation process referred to above. Our investigation aims to explain the present performance of Portuguese firms located throughout the country and to explore those innovation determinants that have been identified by region. To offer a thorough investigation, our analysis defines a set of regionalized firms’ behavioural patterns regarding innovation.
For our applied modelling work, we employ methodologically the External Logistic Biplot, which is then applied to an extended sample of institutions. Variables such as ‘Promoting knowledge’, ‘Management skils’, ‘Promoting R&D’, ‘Knowledge transfer’, ‘Promoting partnership & cooperation’ and ‘Orientation of public measures’ have been explained as crucial in earlier studies and now used to describe regional institutional profiles. Such profiles exhibit great variety in the way they combine determinants to promote regional innovation and the creation of a gradient of capacity to dynamically innovate associated to each firm made it possible to analyze the innovation gradient of each region in Portugal. Our paper presents and investigates, systematically, these findings.
Key Words: Innovation, Firms Performance, Regional Innovation Systems, Portugal, External Logistic Biplot
1
Department of Statistics, University of Salamanca, Spain and
CIEO – Research Centre for Spatial and Organizational Dynamics, Portugal
2
Corresponding author: mtvaz@ualg.pt, Faculty of Economics and CIEO – Research Centre on Spatial and Organizational Dynamics, University of the Algarve, Portugal
3
Faculty of Economics and Business Administration, VU University Amsterdam, The Netherlands
4
Institute of Statistics and Information Management, Universidade Nova de Lisboa and CIEO – Research Centre on Spatial and Organizational Dynamics, University of the Algarve, Portugal.
2
1. Introduction
Portugal is a highly asymmetric country. This phenomenon, common to most of the southern European countries, has been extensively studied from the perspective of regional science Nijkamp, P. (2009). In the Portuguese case, most of the socio economic indicators demonstrate that concentration of activities is growing in the northern-western areas (OECD, 2008) due to different factors. Probable constrains are related to constrains in the knowledge flow, designated as knowledge filters in the current literature (Acs et al., 2004 or Audresch et al., 2006 or Stough and Nijkamp, 2009), in any case also a lack of a clear focus on regional innovation systems as pointed out by OECD, 2008.
Fagerberg, 1987, proved that a long lasting technology gap could explain why growth rates differ among countries and regions. Notwithstanding the theoretical justification, most of the detected empirical problems have remained, so far, unsolved. In general, the causes for this heterogeneous behaviours and cyclic nature of disadvantage in the European southern peripheries has attracted many scholars (Hall and Wee, 1995), also calling for the attention of interested policy makers (Landabaso, 1997). One reason to be considered is the fact that the role of firms and in particular of the smallest ones, in the dynamics of regional growth has not yet been duly investigated. Despite those significant efforts made by the Italian School founded by the GREMI group (Camagni, 1991, 1995a, 1995b, 1999) or, later on, by many other northern European researchers, as for example Asheim, 2003 still not much is certain in what concerns the direct contribution of individual firms or even industrial clusters to foster regional growth, the analyses of spill-over effects being crucial to in this regard (Kaiser, 2002 or Fischer, 2006).
Because the area of influence of each firm varies with its nature, firms environments cannot be defined easily form a geographic perspective (Kirat and Le Bas, 1995). However, for a definition, the firm’s environment should be associated, firstly, to those agents involved in the defence of some historical specificity to employment of its qualified technicians (Teigland and Schenkel, 2006). Secondly, it should also be established based upon the many strategic interactions occurring such as those
3
connections that comprise productive links within the firm’s industrial structure: the cluster, which may be (or may be not) located in the near proximity of the firm. Finally, firm’s environment is highly influenced by the nature of the involved public institutions and their regulations – they may facilitate or aggravate the quality of all interactions. In this context, much can be argued if the strategic decision of firms is mainly internally or externally driven, considering that their capabilities to confront uncertainty is frequently oriented to the future need of resources and clients. Langlois & Robertson, 1995, developed the idea that “questions of firm strategy and firm boundaries are closely related”.
These strategic choices will be usually solved by firms using market solutions, but through which decision-making process? As assessed by Freel, 1998 “little is known about how technologically innovative firms may grow, learn or adapt to changes in their environments”. In his presentation of a conceptual framework of evolutionary strategic learning, he analyses how innovative small firms accumulate knowledge through learning, acting as a process of uncertainty-reduction. These processes do not necessarily work to get economies of scale, but improve the better understanding of cost composition, thereby helping to find out the better decision. Acquisition of knowledge sometimes involves the entrepreneur in a capability of strategic learning viewed as an opportunity to access economies of scope rather than scale. Thus, the routines of innovative firms are different from those of their non-innovative counterparts: examples are the different forms of human capital on pre-start knowledge about costs, a greater reliance on external networks for advice and support.
Empirical studies often underline the role of the environment, defined as the local context into which enterprises develop their activities (Keeble, 1997 and Freel, 1998). Others emphasize the fact that this unique link is indeed a bi-univocal flow (Vaz et al., 2004).
Literature advanced demonstrating that organizational learning and institutional networking work together in the behaviour of innovative firms (Fagerberg, 2003), in spite of the fact that some observations proved a reluctance of firms to cooperate locally (Wig and Wood, 1997). As a possible solution some studies point out for the need of specific networks for technological learning through external sources. There are
4
interfaces helping them to combine sources of technical know-how, information and relations (Stough et al., 2007). They are probably organized with institutional local networks, whose help comes from their capacity to create cohesion or a favourable context for innovation: this cohesion may be represented as some sort of proximity, more cultural and social than geographical (Belotti, 1999).
So to say, the environment appears as a critical factor for the development or atrophy of the enterprise in all studies reported. For example, a negative effect of the SMEs’ environment on innovative activities is observed in an empirical study from Kalantaridis (1999), regarding an agglomeration of manufacturing SMEs that failed to transform geographical proximity into an innovative milieu. The author focused upon the experience of Bedfordshire, a county that was characterized by close proximity to the London markets, the presence of R & D facilities, a considerable agglomeration of engineering SMEs and the existence of two complementary universities: factors often identified in the literature as conducive to innovative activity. "However, these locational advantages failed to act as the stimulus of a cluster of innovative SME's, the rates of innovative activity in the locality were well below those reported elsewhere in the UK." (Kalantaridis, 1999, p.74). ) In Ireland, in a marginal rural area extended to three counties, a group of 123 start-up was studied. The owners were asked their viewpoints on the institutional setting in which they operated their enterprises (McDonagh et al., 1999). Quite often, these owners had been born in the local area and came from families which were self-employed. They were acknowledging the great help received in establishing their businesses from public agencies (grants), but also underlining other important assistances: attitude of local bank managers, staff commitment, etc. Yet, the main idea coming out of the analysis is the lack of an adequate local entrepreneurial culture – too few people coming forward with business ideas, or the ideas proposed being more often imitative than innovative.
2. Factors to measure innovative activities in firms
Measurement of innovative activities became important during the 1990s, when the role of firms in the creation of jobs appeared prominent and, jointly to the emergence of innovations, a topic of broad public interest. In general, statistical inquiries are producing data concerning two discussable proxies: R&D expenditures and numbers of
5
inventions patented. Eventually, employment in R&D related activities. No direct measure of innovation outputs exists so far. The second topic explored has been the manner in which the market structure may influence the innovative activities, and conversely, the extent to which technological change has an impact on the size distribution of firms. All scientific results in such discussion have been empirically oriented, and related to several advanced industrial countries. Very occasionally, a few studies concerned rural or gapping areas (Vaz et al, 2004). The debate invariable points out that there are considerable ambiguities and inconsistencies in the results of empirical studies directly relating R&D or patents to innovation (Acs and Audresch, 1991), even more significantly if in presence of less favoured areas.
New innovation output indicators have been defined having as reference the total number of innovations. Kleinknetch and Bain, 1993 proposed several methods for collecting data: postal surveys for self-assessment by managers of their innovations or literature-based counting of innovations (in trade journals). Experiences with the first method (in Great Britain, Norway, Denmark, Germany and Netherlands) and with the second one (in United States, Netherlands, Ireland) helped to discuss the issues and related ways to work towards general inquiries. However, most of these methods proved to be quite subjective, making a scientific consensus difficult for the general use of the scientific community. When the Community Innovation Survey (CIS) has been implemented by EUROSTAT to collect firm-level data on inputs to, and outputs of, the innovation process across a wide range of industries and across member-states and, occasionally, across regions, a great toll allowed many advances in the comparative analyses of innovativeness across firms, regions and nations.
In spite of its limits, the CIS is bringing confirmation of the actual composition of inputs engaged by the firms for the technological change. Their evaluation at the level of all industries show a break-down of expenditures devoted in EU to innovative activities: formal R&D in labs represents only 41% of the total, while product design costs account for 22%, and in trials, tooling up and training there are 27%. In such figures there is room for the technological developments and imitations looked for in small firms.
6
The macro-level empirical data suggests that the decision-makers are correct when concluding that firms, also the smaller ones, are job creators and engines of economic growth. However, such statements do not help to produce more scientific evidence for the precise role that firms play in the growth mechanisms. Within the context of a learning economy, as ours, all enterprises have to adapt their technology to new standards of the distribution and to the logistic channels, in an intensifying competition, mostly to meet the requirements of consumers and public bodies. Big corporations are well organised to learn and acquire the new inputs, using them first for the dynamics of their own innovative activities (Nonaka and Takeuchi, 1995). A different situation, however, is observed for small firms, whose organization is not so developed for immaterial investments. Yet, we presume that all enterprises of small size are also able to make some kind of efforts to acquire the necessary knowledge to evolve with new technologies and to adapt their productions along the industrial and social evolution.
All categories of enterprises are considered within one industry, but they may belong to different regional or local innovation systems into which they are interacting and competing for innovative and market activities with the same tools and the same knowledge flows (Cook et al., 1998 and Lester, 2006).
In a way, inspired by Grosjean and Crevoisier, 1998, it could be argued that such regional or local innovation systems result from historical, path-dependant processes, with high degrees of institutional and organizational specificities (Wright, 1997). Thus, into an industrial context, firms are embedded in a technological regime, defined by the level and type of opportunity conditions for innovations, by the cumulativeness of technological knowledge and means of knowledge transmission. The examination of the technological regime of an industry allows some predictability about the kind of enterprises which may innovate, due to the possibilities of protecting innovations (appropriability), to the strength of a dominant design (opportunity), to the nature and the continuity in the learning processes (cumulativeness), to the tacitness of knowledge and the means of transmission used.
This theoretical framework suggested a set of related issues that may determine regional patterns of firms’ capacity to dynamically innovate. In order to pursue the goal of detecting them we have applied our investigation to the Portuguese knowledge and innovation system, using a set of private companies and public organizations located in
7
Portugal, evaluated by their WebPage contents. On the basis of this data set, geographically located and classified by NUTS 2, a combination of multivariate statistical methods was employed to detect group performances and them by the gradient of capacity to dynamically innovate. The results demonstrate that this method can provide useful information for policy evaluation of innovation systems at both the regional or national levels. An earlier publication (Galindo, et al., 2010), provides further details on the sampling and variables5.
3. Methodology
The information used in our analysis was organized in an IxJ binary data matrix (Y) in which the I rows correspond to the above-mentioned 620 units and the J columns correspond to the above-mentioned 10 binary innovation attributes scored as binary variables, viz. present or absent (1 or 0):
As a means to obtain the main innovation gradients, of the entities and their relation to the observed characteristics, we apply a novel algorithm, recently proposed by Demey et al., 2008, that combines Principal Coordinates Analysis (PCoA) and Logistic Regression (LR) to construct an External Logistic Biplot (ELB).
The algorithm starts with a PCoA, as a technique for ordering the units, in a Euclidean space, on the latent gradients. The second step of the algorithm is adjusting a logistic regression model for each variable by using the latent gradients as independent variables. Geometrically the principal coordinates scores can be represented as points in the map and the regression coefficients are the vectors showing the directions that best predict the probability of presence of each character.
To search for the variables associated with the ordering obtained in PCoA, we look for the directions in the ordering diagram that better predict the probability of the presence of each unit. So, the second step of the algorithm is adjusting a logistic regression model
5These variables are the following: Promoting knowledge (PK); Studying process (SP); Managing (Mg); Promoting R&D (PRD); Knowledge transfer (KT); Support to
entrepreneurship (SE); New product development (NPD); Promoting partnership and cooperation (PPC); Application of external technologies (AET); Orientation (Or).
8
for each variable by using the latent gradients as independent variables. According to the geometry of the linear biplot for binary data (Vicente-Villardón et al. 2006), in which the responses along the dimensions are logistic (Logistic Biplots, LB), each variable is represented as a direction through the origin.
For each character, the ordination diagram can be divided into two separate regions predicting presence or absence, while the two regions are separated by the line that is perpendicular to the character vector in the Biplot and cuts the vector at the point predicting 0.5. The characters associated with the configuration are those that predict the respective presences adequately.
Measures of the quality of the representation of units, and variables on the graphical representation are also calculated in this framework. The quality of representation of a unit is measured as the percentage of its variability accounted by the reduced dimension solution, and it is calculated as the squared cosine of the angle between the point/vector in the multidimensional space and its projection onto the low dimensional solution. As the representation is centred at the origin, the variability of each unit is measured by its squared distance to the centre, so that the quality of representation can be measured by the ratio between the squared distance in the reduced dimension and the squared distance in the complete space.
The quality of representation of a variable is measured as a combination of three indexes: the p-value of the logistic regression, in order to test the relation of the solution and each variable (using the deviance); the Nagelkerke R squared; and the percentage of correct classifications, using 0.5 as a cut-off point for the expected probability. As a way to identify which gradient (dimension) is most related to each variable, the cosine of the angle of the vector representing the variable and the dimension is calculated. The variable is more related to a particular gradient when the absolute value of the cosine is higher than the cosine for other gradients.
To produce an elegant solution, we represent a Voronoi diagram of the spatial relationships; that is, a special decomposition of a metric space determined by distances to a specified discrete set of points: centroids from a k-means cluster analysis of the ELB coordinates.
9
A computer program, based on Matlab code, for implementing these methods is available and can be obtained from the website: http://biplot.usal.es.
4. Empirical results
The Principal Coordinates Analysis is developed over the dissimilarities matrix, based on the Russel and Rao coefficient. It has produced the following results (see Table 1). The inertia first principal plane (two-dimensional solutions) accounts for 77.53 per cent of the variability. The first eigenvalue is significantly higher than the second one, meaning that, even if the two innovation gradients are considered, the first (horizontal) dimension accounts for most of the information.
Table 1. Eigenvalues, percentage of accounted variance
Eigenvalue % of variance Cumulative %
37.49 57.99 57.99
6.78 10.49 68.49
5.85 9.05 77.53
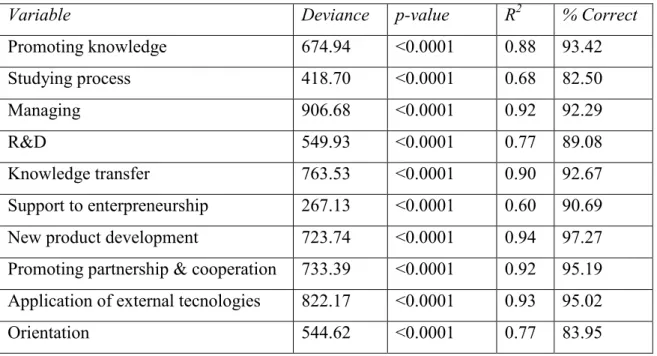
Table 2. Goodness-of-fit of the variables
Variable Deviance p-value R2 % Correct
Promoting knowledge 674.94 <0.0001 0.88 93.42 Studying process 418.70 <0.0001 0.68 82.50 Managing 906.68 <0.0001 0.92 92.29 R&D 549.93 <0.0001 0.77 89.08 Knowledge transfer 763.53 <0.0001 0.90 92.67 Support to enterpreneurship 267.13 <0.0001 0.60 90.69
New product development 723.74 <0.0001 0.94 97.27
Promoting partnership & cooperation 733.39 <0.0001 0.92 95.19 Application of external tecnologies 822.17 <0.0001 0.93 95.02
10
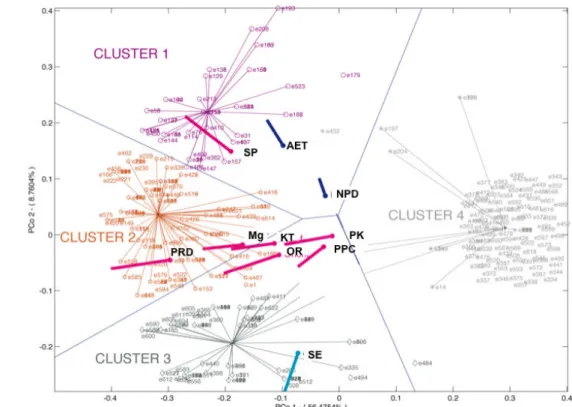
In Figure 2 (ELB map) below we can observe a complex representation of the main patterns to dynamically innovate according to the ten considered variables: Promoting knowledge (PK); Studying process (SP); Managing (Mg); Promoting R&D (PRD); Knowledge transfer (KT); Support to entrepreneurship (SE); New product development (NPD); Promoting partnership and cooperation (PPC); Application of external technologies (AET); Orientation (Or). Each company profile has a particular location on the graph. The distance between any two company-points of the configuration approximates, as closely as possible, the dissimilarity between them.
The global goodness of fit as a percentage of correct classifications in the Biplot is 90.43 per cent. The goodness of fit (quality of representation) indexes for each variable is shown in Table 2. All the R-squared values are higher than 0.6, and therefore all variables are closely related to the two dimensional PCoA solution.
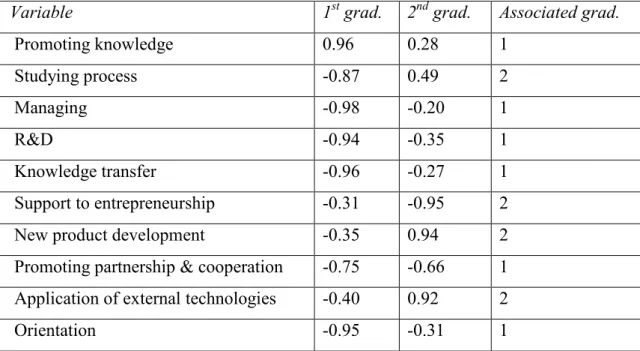
Table 3. Cosines of the angles
Variable 1st grad. 2nd grad. Associated grad.
Promoting knowledge 0.96 0.28 1 Studying process -0.87 0.49 2 Managing -0.98 -0.20 1 R&D -0.94 -0.35 1 Knowledge transfer -0.96 -0.27 1 Support to entrepreneurship -0.31 -0.95 2
New product development -0.35 0.94 2
Promoting partnership & cooperation -0.75 -0.66 1
Application of external technologies -0.40 0.92 2
Orientation -0.95 -0.31 1
Table 3 contains the cosines of the angles of the variables with the dimensions. It has to be pointed out that any direction in the two-dimensional solution, and not just the main dimensions, can be considered as innovation gradients. The graph can help us to look for the most interpretable directions. An analysis of the cosines’ value in the graph identifies two main directions for innovation gradients. A third column has been added
to Table 3 showing which variables are most related to each direction. The first gradient is almost parallel to dimension 1 (horizontal) and the second to dimension 2 (vertical). Although the variable ‘Promoting knowledge’ has a higher cosine with the first dimension, it has been assigned to the second gradient after inspecting the graph.
From the graph and the quality indexes, we can conclude that the first innovation gradient is mainly given by a combination of the following variables:
knowledge (PK); Managing (Mg); Promoting R&D (PRD); Promoting partnership and cooperation (PPC);
Observing the directions of the vectors
concluded that the presence of all those attributestend to show up together (as we hypothesized in the introduction). The graphical representation corroborates the interpretation of the innovation gradients
can also be concluded from the graph that there is a high correlation between Promoting knowledge, Studying processes, Managing, Promoting R&D, Knowledge transfer and Orientation. This is because they have
Figure 1. Voronoi diagram representation of spatial relationships and cluster
A
11
to Table 3 showing which variables are most related to each direction. The first gradient is almost parallel to dimension 1 (horizontal) and the second to dimension 2 (vertical). Promoting knowledge’ has a higher cosine with the first dimension, it has been assigned to the second gradient after inspecting the graph.
From the graph and the quality indexes, we can conclude that the first innovation mainly given by a combination of the following variables:
knowledge (PK); Managing (Mg); Promoting R&D (PRD); Knowledge transfer Promoting partnership and cooperation (PPC); Orientation (Or).
Observing the directions of the vectors relative to the first latent attribute, it can be concluded that the presence of all those attributestend to show up together (as we hypothesized in the introduction). The graphical representation corroborates the interpretation of the innovation gradients in terms of their relations to the variables. It can also be concluded from the graph that there is a high correlation between Promoting knowledge, Studying processes, Managing, Promoting R&D, Knowledge transfer and Orientation. This is because they have small angles pointing in the same direction.
Voronoi diagram representation of spatial relationships and cluster to Table 3 showing which variables are most related to each direction. The first gradient is almost parallel to dimension 1 (horizontal) and the second to dimension 2 (vertical). Promoting knowledge’ has a higher cosine with the first dimension, it has been assigned to the second gradient after inspecting the graph.
From the graph and the quality indexes, we can conclude that the first innovation mainly given by a combination of the following variables: Promoting Knowledge transfer (KT);
relative to the first latent attribute, it can be concluded that the presence of all those attributestend to show up together (as we hypothesized in the introduction). The graphical representation corroborates the in terms of their relations to the variables. It can also be concluded from the graph that there is a high correlation between Promoting knowledge, Studying processes, Managing, Promoting R&D, Knowledge transfer and
small angles pointing in the same direction.
12
Voronoi diagram of the spatial relationships is represented in Figure 1. We are given a set of points s in the plane, the centroids from a k-means cluster analysis onto the ELB coordinates, which are the Voronoi sites. Each site has a Voronoi cell, consisting of all points closer to a centroid than to any other site. The segments of the Voronoi diagram are all the points in the plane that are equidistant to the two nearest sites. The Voronoi nodes are the points equidistant to three (or more) sites. Two points are adjacent on the convex hull if and only if their Voronoi cells share an infinitely long side.
Analyzing Voronoi diagrame and cluster we are able to find four groups of entities with homogeneus paterns in the two gradients considerated.
At national level, the institutions positioned on the left side of the graph have a higher capacity to dynamically innovate because they tend to aggregate higher values of those variables (attributes) – this happens in CLUSTER 2. However, the institutions positioned on the right side of the figure lack most (or all) of such attributes – this happens in CLUSTER 4. As such, this measurement may be interpreted as a complex innovation index, defined here as the Gradient of Capacity to Dynamically Innovate (GCDI). Using this method, the scores of the variables on the first gradient can be ordered to obtain the sequence of attributes that define the degree of innovation. The most innovative institutions have the total number of characteristics, and then they are followed by those entities that have all of them, except Promoting R&D (PRD) whose score is situated to the left of the graph. The next group would have all the attributes related to the gradient, except Promoting R&D and Managing (Mg), and so on.
The second innovation gradient is a combination of Studying process (SP); New product development (NPD); Application of external technologies (AET) pointing in the positive direction; and Support to entrepreneurship (SE) pointing in the opposite direction. This secondary gradient is not correlated with the first one and summarizes an aspect of innovation independent from the main dynamic pattern. The institutions situated on the top, cluster 1, of the graph would combine the first three pointed out previously and the last would be absent; while the institutions situated at the bottom, cluster 3, would have the last one with an absence of the first three attributes pointed out previously. Some profiles could already be associated to these clusters: cluster 2, the
13
multiple innovative profiles; cluster 4, the non-innovative one; the other two clusters suggest focused profiles.
5. NUTS distributions into the Clusters
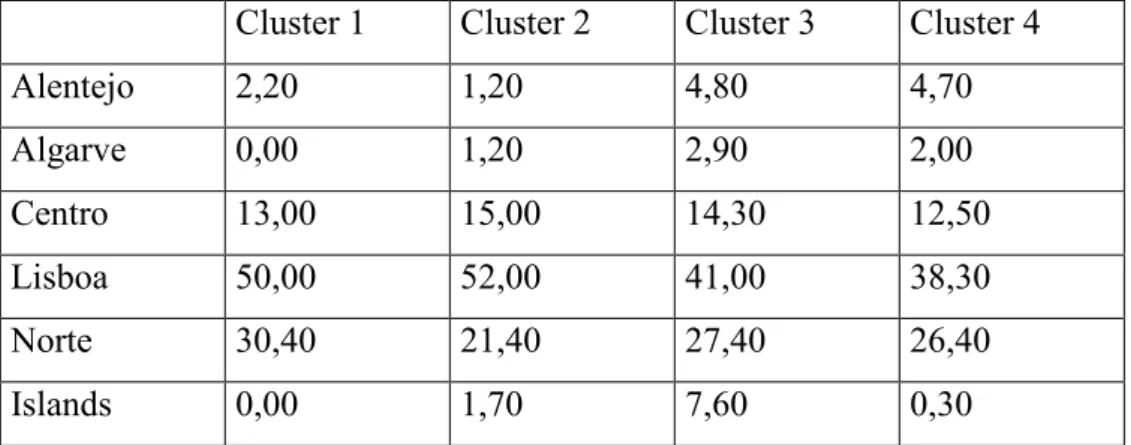
Once we have identified and represented the institution clusters on the Euclidean map containing the two innovation gradients, we study the composition of the groups according to the geographical distribution. The following Table 4 shows the cross-tabulation of clusters and regions.
Table 4. Cross-tabulation between clusters and regions
Cluster 1 Cluster 2 Cluster 3 Cluster 4
Alentejo 2,20 1,20 4,80 4,70 Algarve 0,00 1,20 2,90 2,00 Centro 13,00 15,00 14,30 12,50 Lisboa 50,00 52,00 41,00 38,30 Norte 30,40 21,40 27,40 26,40 Islands 0,00 1,70 7,60 0,30
Note: Percentage within cluster
Table 5. Cross-tabulation between regions and regions
Cluster 1 Cluster 2 Cluster 3 Cluster 4
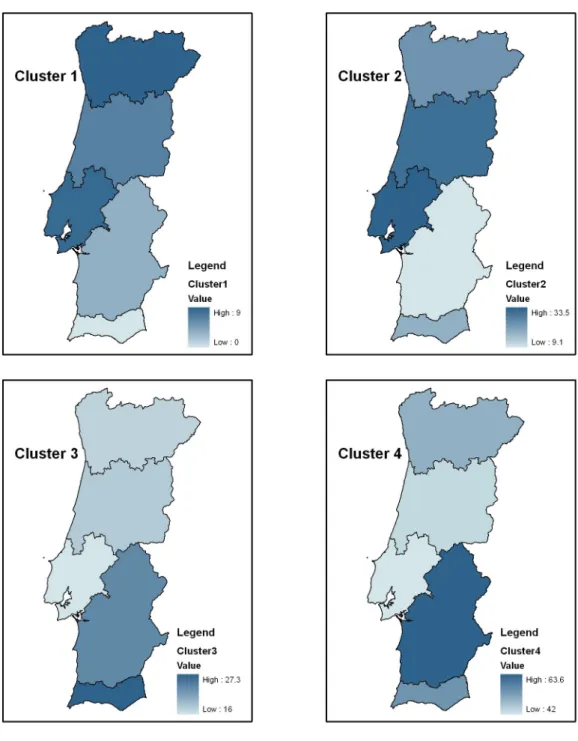
Alentejo 4,5 9,1 22,7 63,6 Algarve 0 18,2 27,3 54,5 Centro 7,1 31 17,9 44 Lisboa 8,6 33,5 16 42 Norte 9 23,7 17,3 50 Islands 0 25 66,7 8,3
14
Data in Table 4 and 5 may be translated in the following Figure 2, a comparative spatial analyses of the regional profiles of firms towards innovative patterns in the country.
15
6. Conclusions
From the application of the Logistic Biplot methodology to the institutional databases we were able to demonstrate that institutions are very diverse in the way they combine determinants for their patterns towards the dynamics of innovation - the two-dimensional PCoA solution accounts for the main interpretation of the regional variation patterns related to the data used.
Considering the relation of the variables to the innovation gradient of capacity to dynamically innovate, we are able to conclude that the determinants ‘Promoting knowledge’, ‘Managing’, ‘Promoting R&D’, ‘Knowledge transfer’, ‘Promoting partnership & cooperation’ and ‘Orientation’, are the most influential ones.
There is not a homogeneous distribution of the regions among the clusters, as we expected. The 80.4% of the institutions with higher innovation levels (cluster 1) are in Lisbon region (50%) and the North region (30.4%), 13% are in the Centre of the Country, just one institution (2,20%) in the Alentejo region and none in the Islands or the Algarve.
Within cluster 2, 52% of the institutions are also in the Lisbon region, 21.4% in the North and 15% in the Centre. We can conclude, from the previous paragraphs, that the institutions possessing a higher level of innovation are concentrated in the Lisbon-Centre-North regions.
Cluster 3, characterized by different innovation indices, has an internal distribution similar to the previous groups: most of the institutions are from the Lisbon (41%), North (25.7%) and Centre (14.3%) regions. In this case the institutions from the Islands are the 7.6%.
Also, 38% of the institutions in Cluster 4 (no innovation) are from Lisbon and 26.4% from the North. The highest percentage of non-innovative institutions are concentrated in the group Lisbon-North-Center (Middle-North of the country)
16
Although Lisbon is the region with institutions possessing the highest innovation level, we have to note that from the 269 in that region 42% don’t have any of the innovation characteristics and 8.6% the highest innovation level. A similar situation occurs for the North and Centre regions. For the rest of the areas, the percentage institutions without any innovation, is higher.
By detecting the specific nature of the innovative regional structure of innovative firms and public institutions in Portugal, many advantages and fragilities in the firms’ capacity to cooperate may be identified and clearly interpreted; and, moreover, their cooperative patterns (networks) can be closely examined. Such a goal represents a step towards into governance structures in agreement to Storper and Harrison, 1991, whose impressive amount of work remained inconclusive due to lack of empirical evidence. Acknowledgements
This paper has been partially supported by the Portuguese Foundation for Science and Technology (FCT).
References
Acs, Z. J. and Audretsch, D. B. 1991. Innovation and Technological Change. An International Comparison. The University of Michigan Press.
Acs, Z. J. and Audretsch, D. B. 1993. Analysing innovation output indicators: the us experience. in: Kleinknetch, A. and Bain, D. eds. New Concepts in Innovation Output Measurements. S. Martin’s Press. New York. 10-41.
Acs, Z. J., Audretsch, D. B., Braunerhjelm, P. and Carlsson, B. 2004. The missing link: the knowledge filter and entrepreneurship in endogenous growth. CEPR Discussion Paper.
Audretsch, D. B., Keilbach, M. C. Lehmann, E. E. 2006). Entrepreneurship and Economic Growth. Oxford University Press. Oxford.
Asheim, B. T. and Isaksen, A. 2003. SMEs and the regional dimension of innovation. in: Ascheim et al. Eds. Regional Innovation Policy for Small-Medium Enterprises. Edward Elgar. Chaltenham. 21-46.
Belotti, C. 1999. La modernisation technologique des petites entreprises en zone rurale. Réflexions autour d’études de cas suédois. Revue Internationale PME. 12. 1-2. 127-150.
17
Camagni, R. 1991. Introduction: from the local milieu to innovation through corporation networks. in: Camagni, R. Ed. Innovation networks: spatial perspectives. Belhaven Press. London and New York. 1-9.
Camagni, R. 1995a. Espace et temps dans le concept de milieu innovateur. in: Ralllet, A. and Torre, A. eds. Économie Industrielle et Économie Spatiale. Economica, Paris. 193-210.
Camagni, R. 1995b. Global network and local milieu: towards a theory of economic space. in: Conti, S., Malecki, E. and Oinas, P. Eds. The Industrial Enterprise and its environment: Spatial Perspectives. Avebury. England. 195-213.
Camagni, R. and Maillat, D. 1999. The innovative milieu paradigm in contempory spatial economy. Revue d’Économie Régionale et Urbaine. 3. 425-428.
Cooke, P. (1998), Regional Innovation Systems: Designing for the Future – REGIS. Cooke, P., Braczyk, H-J and Heidenreich, M. eds. 1998. Regional Innovation Systems:
The Role of Governances in a Globalized World. 2nd Edition. Routledge. London. Demey, J. R., Vicente-villardón, J. L., Galindo, M. P. and Zambrano, A.Y. 2008.
Identifying molecular markers associated with classifications of genotypes by external logitic biplot. Bioinformatics. 24. 28-32.
Fagerberg, J. 1987. A technology gap approach to why growth rates differ. Research Policy. 16. 87-99.
Fagerberg, J. 2003. Schumpeter and the revival of evolutionary economics: an appraisal of the literature. Journal of Evolutionary Economics. 13. 125-59.
Fischer, M. M. 2006. Innovation, Networks and Knowledge Spillovers. Springer. Berlin. Freel, M. 1998. Evolution, innovation and learning: evidence from case studies.
Entrepreneurship & Regional Development. 10. 2. 137-149.
Galindo, P. V., Noronha Vaz, T. and Nijkamp, P. 2010. Institutional capacity to dynamically innovate: an application to the portuguese case. Technological Forecasting & Social Change. Accepted.
Grosjean, N. and Crevoisier, O. 1998. Systemes de Production Territoriaux: vers une methode systematique d'identification et d'evaluation. Université de Neuchâtel. Hall, R. and Wee, M. 1995. The regions in a enlarged europe. in: Hardy, S., Hart, M.,
Albrechts, L. and Katos, A. Eds. An Enlarged Europe. Regions in Competition? Regional Policy and Development. 6. Jessica Kingsley Publishers and Regional Studies Association. London. 8-21.
18
Kaiser, U. 2002. Measuring knowledge spillovers in manufacturing and services: an empirical assessment of alternative approaches. Research Policy. 31. 1. 125-144. Kalantaridis, C., Kirat, T. and Le Bas, C. 1995. Apprentissage technologique et
interactivité dans les systèmes localisés de production et d’innovation. in: Rallet, A. and Torre, A. eds. Économie Industrielle et Économie Spatiale. Association de Science Régionale de Langue Française. Paris. 422-443.
Pheby, J. 1999. Processes of innovation among manufacturing SMEs: the experience of Bedfordshire. Entrepreneurship & Regional Development. 11. 1. 57-78.
Keeble, D. 1997. Small firms, innovation and regional development in britain in the 1990s. Regional Studies. 31. 3. 281-293.
Keeble, D. and Wilkinson, F. 1999. Collective learning and knowledge development in the evolution of regional clusters of high technology SMEs in Europe. Regional Studies. 33. 4. 295-303.
Keeble, D. and Wilkinson, F. 1999. Networking and collective learning in regionally-clustered high-technology SMEs in Europe.
Kleinknetch, A. and Bain, D. 1993. New Concepts in Innovation Output Measurements. St Martin’s Press. New York.
Landabaso, M. 1997. The Promotion of innovation in regional policy: proposals for a regional innovation strategy. Entrepreneurship & Regional Development. 9. 1. 1-24.
Langlois, R. N., Robertson, P. L. 1995. Firms, Markets and Economic Change, Routledge. London & New York. 177.
Lester, R. 2006. Prospects for local innovation systems. Seminar held in September 2006 at the Department of Economics. National University of Ireland. Galway. Mcdonagh, P. 1999. Supporting entrepreneurship in marginal rural areas: experience
from the west of ireland. in: Byron, R. and Hutson, J. Eds. Local Enterprise on the North Atlantic Margin. Ashgate. England and USA. 15-43.
Nijkamp, P. 2009. Regional development as self-organized converging growth. in: Kochendorfer, G. and Pleskovic, B. Eds. Spatial Disparities and Development Policy. Washington DC: The World Bank. 205-282.
Nonaka, I. and Takeuchi, H. 1995. The Knowledge-Creating Company. Oxford University Press. New York & Oxford. 284.
19
Storper, M. and Harrison, B. 1991. Flexibility, hierarchy and regional development: the changing structure of industrial production systems and their forms of governance in the 1990s. Research Policy. 20. 407-422.
Stough, R. and Nijkamp, P. 2009. Knowledge spillovers, entrepreneurship and economic development. Annals of Regional Science. 43: 835-838. Springer. Stough, R., Nijkamp, P. and Vaz, M. T. N. eds. 2007. Local Knowledge and Innovation
Policy in Government and Policy. Special Issue of Environment and Planning C. 25(5).
Teigland, R. and Schenkel, A. 2006. Exploring the role of communities of practice in regional innovation systems. in: Coakes, E. and Clarke, S. eds. The Encyclopaedia of Communities of Practice. In Information and Knowledge Management. Hersley. Idea Group.
Vaz, M. T. N. 2004. The environmental context for small firms in the EU. in: Vaz et al. Eds. Innovation in Small Firms and Dynamics of Local Development. 13-31. Vicente-Villardón, J. L., Galindo-Villardon, M. P. and Blazquez-Zaballos, A. 2006.
Logistic Biplots. in: Greenacre, M. and Blasius, J. eds. Multiple correspondence analysis and related methods. Boca. Raton. FL: Chapman Hall. 503-521.
Wig, H. and Wood, M. 1997. What comprises a regional system of innovation?. Regional Policy and Development. 18. 66-98.
Wright, G. 1997. Towards a more historical approach to technological change. The Economic Journal. 107. 1560-1566.
Websites
Community Innovation Survey (CIS),
http://epp.eurostat.ec.europa.eu/cache/ITY_OFFPUB/KS-EM-08-001/EN/KS-EM-08-001-EN.PDF
Strategies for Collective Efficiency (2009),
(http://www.pofc.qren.pt/PresentationLayer/conteudo.aspx?menuid=457) http://biplot.usal.es).