Rhythmic ammonium regeneration and flushing in
intertidal sediments of the Sado estuary
Carlos Rocha
IPIMAR, Av. de Bra&a, 1400 Lisboa, Portugal Abstract
The effects of exposure to the atmosphere on ammonium cycling in intertidal sediments were examined at a single site in the Sado estuary (Portugal) during a tidal cycle in November 1994. During a 9-h period, covering pre-ebb to postflood, 11 high-resolution vertical profiles of dissolved and sorbed ammonia and water content were collected. In addition, the vertical distribution of temperature was measured, primarily at the beginning and the end of the exposure period. The most dramatic changes occurred at the end of the exposed period when water flooded the sediment; -75% of the dissolved and sorbed NH;’ pool (44.2 mmol m-*) was flushed into the water column by buoyancy-driven Porewater exchange. Some 64% of the flushed inventory (28.2 mmol m-*) was produced during the exposure period, at an average rate of 4.9 mmol NH, t m-* h I. The build-up of ammonium in the sediment was faster in the sorbed pool than in the dissolved pool. An average first-order carbon mineralization rate of 85.2 mmol C m * h-l during exposure was estimated from the ammonification rate. Residence times for the organic carbon and nitrogen pools were also calculated (37.5 and 43.4 d, respectively), giving indication of the rapidity of the turnover of organic matter possible in estuary intertidal sediments.
Sediments are sites of intensive organic matter and nutri- ent regeneration. Benthic mineralization becomes increas- ingly important to the trophic chain as the water column gets
shallower (Nixon 1981; Walsh 1991; Jorgensen 1983; Em- erson et al. 1984). Intertidal areas constitute major portions of the meso- and macrotidal estuaries across the world. In such systems, the daily alternation between atmospheric ex- posure and tidal inundation creates a series of interrelated biotic and abiotic changes that are important to benthic min- eralization (Riedl and Machan 1972; Anderson 1983; de Jonge and van Beusekom 1995). During exposure to the at- mosphere, dewatering occurs by evaporation and drainage (Todd 1964; Anderson and Howell 1984; Howes and Goeh- ringer 1994). Evaporation changes solute gradients, and per- colation (Porewater migration) is a vehicle for the transport of solutes through the sediment in shorter time scales than is allowed for by molecular diffusion only (Webb and Theo- dor 1968, 1972; van der Loeff 1981; Huettel and Gust 1992a,b). The sediment structure also changes in response to dewatering- either sediments are elastic, and they com- pact in response to water loss, or the emptied pore space is occupied by intruding air (Huettel and Gust 1992b), thus enhancing aerobic processes at the air-sediment interface (Seitzinger 1988; Nielsen et al. 1990; Risgaard-Petersen et al. 1994). Either way, the ratio between particle surface and Porewater volume changes, affecting processes at the liquid- solid interface (Berner 1980; Boatman and Murray 1982;
L Present address: Department of Microbiology, Universidade do
Algarve-UCTRA, Campus de Gambelas, 8000 Faro, Portugal.
E-mail: [email protected] Acknowledgments
I thank Graca Cabecadas, Maria Jose Brogueira, and Maria Alice Conccicao for supporting my work. Comments on the original manuscript by Ola Holby, Michiel Rutgers van der Loeff, Carlos Vale, and Bjorn Sundby were equally appreciated. This work was
cofinanced by a National Science and Technological Research
Board (JNICT) Ph.D. grant to the author (ref. 2169/IG/92).
Ma&in and Aller 1984). In addition, biogeochemical reac- tion rates could increase on very short time scales in re- sponse to escalating temperature, thus increasing the benthic turnover rate of organic matter for short periods.
In order to understand the way that exposure modifies conditions within sediments and how this transient pertur- bation will affect nutrient cycling, the effect of exposure on the ammonium pool of a tidal flat located in the Sado es- tuary, Portugal, was studied. Previous work in the Sado es- tuary (Cabeqadas and Brogueira 1991) suggested that NH,+ availability limits pelagic productivity, as in similar systems elsewhere (Nixon 1981). Further results obtained from tidal flats (Rocha et al. 1995a) suggest that large NH,+ pools are available in intertidal sediments and that these pools are pe- riodically tapped by the incoming tide to provide tidal water microphytes with an abundance of nutrients. Falcao and Vale (1995) found abrupt increases in NH, I concentrations in the water when flooding of the tidal flats in the Ria Formosa (South Portugal) occurred during the day. The present work attempts to show that the variability observed in NH,+ depth profiles in intertidal sediments can be systematic and is re- lated to the periodic tide. The purpose of this work is also to propose a mechanism whereby the benthic NH,+ pool present in these sediments could be rapidly transferred to tidal waters, following an exposure period during the day.
Study area
Site characterization-The Sado estuary (Fig. l), located on the southwest coast of Portugal (37”25’-38”40’N, 7”40’- 8’5O’W) is part of a hydrological basin that covers an area of 7,640 km*. It is a mesotidal coastal-plain, lagoon-type estuary, dominated by a wide bay and a narrow channel. The tidal regime is semidiurnal with amplitudes between 4 m in spring tide and I m for neap tide. River discharge is con- trolled by a pronounced dry-wet regime, with large inter- annual variations. Limits of salt intrusion are located well inland, up to 30 km up-river. About 50% of the total estuary area (-200 km*) is intertidal.
~1 P Bathymetry in meters
Fig. 1. estuary.
Location of the sampling site in Comporta inlet, Sado
The study site is located in Comporta, an 1 l-km2 area of tidal flats inside the estuary with a low average depth of l- 3 m in the main channel. Freshwater inputs are negligible, occurring mostly by land drainage in winter. Nearly 80% of the site is intertidal, with mounds of Spartina spp. and some areas covered by eelgrass (Zostera spp.). The sampling site is located in a 4-m* area of tidal flat, comprised of sediment with homogeneous surface, free of algal cover throughout the year, and is located on a slight slope that merges even- tually into the main channel.
Methods
Sampling-Eleven high-resolution cored samples were
taken when sediment was exposed during the day in Novem- ber 1994. Sampling intervals varied between 2 h during ex- posure to 30 min during ebbing and flooding of the site. A total of six minicores (6 cm in length) are pooled for each profile. The minicores are sliced in situ, layers of the same depth combined, and this material is introduced into Oak Ridge centrifuge tubes that are quickly placed in isothermal cases (-4°C). These are frozen (- 18°C) immediately after arrival at the laboratory (at the most, 6 h later). Total han- dling time for each sample (six pooled minicores) did not exceed 2 min until placed in isothermal storage. With this method, no significant effects of air contamination on NH,’ are observed (Mackin and Aller 1984), nor are significant changes expected in NH, + adsorption with time in the stored sediments (Rosenfeld 1979). Fourteen temperature profiles at hour and half-hour intervals during exposure (and some at 10-min intervals during site flooding and ebbing) were taken with a type E (Chromel-Constantan) thermocouple needle probe, calibrated with a platinum RTD probe. Air and sediment surface temperatures were measured simultaneous- ly. Voltage output from the probes was measured with a high-accuracy multimeter (Fluke 45 DD).
Analyses-After thawing, sediment samples were homog- enized by Vortex stirring (while still sealed inside the cen- trifuge tubes), and a subsample was taken under a continu- ous N, stream for water content (weight loss at 105°C). Pore water was then extracted by centrifugation (3,000 r-pm, 10 min), and the supernatant (l-2 ml) was filtered through 0.45- pm AcetatePlus MS1 filters and immediately poisoned with 10 ,ul of a saturated HgCl, solution (Blackburn and Henrik- sen 1983; Oremland and Capone 1988). Ammonium con- centrations (NH,+ ) were measured with an Alliance Integral AutoAnalyzer system. Reproducibility of -C- 1% was ob- tained, and the detection limit was 0.03 PM for NH,+. Loosely sorbed ammonium was extracted with 2 M KC1 so- lutions (Rosenfeld 1979) and the results were calculated as a function of bulk volume (Ma&in and Aller 1984) after correction for the contribution of Porewater NH, + in the cen- trifuged samples to the total amount found in the extractant. A separate core (length of 25 cm, 4 of 5.5 cm) was taken for sediment particle analysis and to measure total carbon and nitrogen in the particulate phase. Total C and N were measured on a Carlo Erba 1400 CNS analyzer (according to Hirota and Szlrper 1975). Core slices were sequentially sieved to determine the percent composition of very coarse sand (l-2 mm), coarse sand (0.5-l mm), fine sand (63-500 pm), and silt + clay (<63 pm). Median values of size class- es were used to calculate a weighed average value of particle size for each depth.
Ammonium sorption isotherms-An incubation experi-
ment was run in the laboratory under controlled temperature conditions in order to study the heterogeneous equilibrium of NH,-+ in Sado estuary sediment. Two separate fresh batch- es of sediment I:O-l-cm and l-2-cm depth) were collected from the sampling site and homogenized prior to use. Pre- cisely weighed ,aliquots in the range of 2-3 g were placed in 50-cm3 Oak Ridge centrifuge tubes. Ten cubic centimeters of a solution enriched in ammonium to various concentra- tions (4.4, 58,7. 221, 427.4, 707.3, 1,035.1, 1,308.5, and
1,757.5 PM, as measured after preparation) were added to the sediment, re:sulting in a group of 16 slurry samples, in- cluding two replicates for each concentration in solution. The standard solutions were poisoned with N-serve to 10 mg drne7 (Blackburn and Henriksen 1983; Oremland and Capone 1988; van Raaphorst and Malschaert 1995) to avoid possible nitrification during incubations. The slurries were incubated under thermostated conditions (25°C) in shaking frames. Subsequlent procedures of Porewater separation and KC1 extractions were carried out as described previously. Final control checks of nitrate concentrations were made in order assess any nitrification-the added N-serve did indeed block nitrification activity. Isotherms were obtained by plot- ting sorbed ammonium vs. the corresponding NH,+ concen- tration in the supl=rnatant (Rosenfeld 1979; Ma&in and Aller 1984; van Raaphorst and Malschaert 1995).
Results and disl:ussion
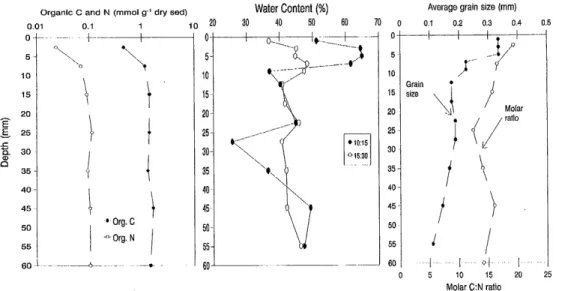
Sediment characterization-The grain size analysis shows that the sedimen: column at the sampling site is vertically structured into two different layers (Fig. 2). The top layer
Organic C and N (mmol 9.’ dry sed) Water Content (77) Average grain size (mm) 0.01 0.1 1 ,. 20 30 40 50 60 70 0 0.1 0.2 0.3 0.4 0.5 0 5 10
-. t- I
I -t--
i
/
_- .-J”
15 0 5 10 15 20 25 30 35 40 45 50 55 60 Grain l size \\ 4 l’ I 20 -z .fi- 25 c 2% 30 rs 35 / Molar fJ ratio 40 45 50 55 60 I I ’ org. c i -(> Org. N I -.-.----*..- - .-.* I I 01 I 10 15 Molar C:N ratioFig. 2. Physical characterization of the sediment particles. Local depth variation of organic C and N content and molar C : N ratio, compared with the average grain size depth profile.
(O-l cm) is sandier (63% sand, 37% clay + silt) and the the total C and N (results not shown). The top sediment layer
deeper sediment (l-6 cm) contains a larger clay + silt frac- is depleted in organic C and N in comparison to relatively
tion (50-85%). The surface sediment layer is presumably constant levels below 1 cm. Early remineralization of or-
more permeable as a result of hydrodynamic reworking (de ganic matter by heterotrophic decomposition preferentially Jonge and van Beusekom 1995). This will lead to enhanced depletes nitrogen from the organic matter pool. Regeneration dewatering in this layer and, consequently, to the creation of of C, N, and P is, therefore, determined by the C : N : P molar an environment propitious to rapid heterogeneous reactions. ratio in deposited organic matter (Berner 1980; Jorgensen Inorganic carbon and nitrogen make up for less than 4% of 1983). As the organic C : N molar ratio found in the sediment
[NH, ‘1 @mol dm-2 bulk sediment)
. b
10.45eXpos4d
i b
Fig. 3. Transient depth profiles of NH,‘, sorbed and dissolved in the port water, over the
sampling period. Concentrations were corrected for sediment porosity and are expressed per volume of bulk sediment (note the logarithmic scale). Open symbols refer to dissolved NH,‘, while closed symbols refer to sorbed NH, t.
Table 1. Ammonium inventory within the sediment column throughout the sampling period. Data compare integrated size of the sorbed and dissolved fractions for different sediment layers.
Hour of day (c.e.t.)
State of flat
Ammonium inventory (pmol dnl-2 bulk sediment)
Dissolved Sorbed Total Column
O-l cm l-6 cm O-l cm l-6 cm - O-l cm l-6 cm O-6 cm
915 Flooded 23.0 62.0 112.3 71.6 135.2 133.6 268.8 1015 Ebb 18.0 116.7 46.8 108.2 64.9 224.9 289.8 1045 Exposed 90.6 92.8 99.1 28.2 189.7 120.9 310.6 1130 Exposed 119.7 145.3 124.3 56.4 244.0 201.6 445.6 1230 Exposed 89.1 117.7 134.1 183.0 223.2 300.7 523.9 1330 Exposed 40.1 83.2 260.7 151.7 300.8 234.9 535.7 1530 Exposed 52.4 140.7 183.1 216.2 235.6 356.9 592.5 1600 Flood 9.4 72.4 223.2 283.5 232.6 355.9 588.5 1645 Flooded 6.2 78.9 47.7 34.2 53.8 113.1 167.0 1745 Flooded 12.3 84.1 36.1 22.1 48.3 106.2 154.5 1830 Flooded 11.8 65.1 33.4 40.6 45.2 105.7 151.0
particles (Fig. 2) varied between a high of 19.3 at the surface and a low of 12.4 at 2.5-cm depth, this suggests higher turn- over rates of organic matter in the surface layer.
Transient changes in the NH,+ benthic pool-Exposure of the sediment clearly enhances regeneration of NH,’ (Fig. 3). The total depth-integrated (6 cm) pool size increases gradually until the end of exposure, when an abrupt reduc-
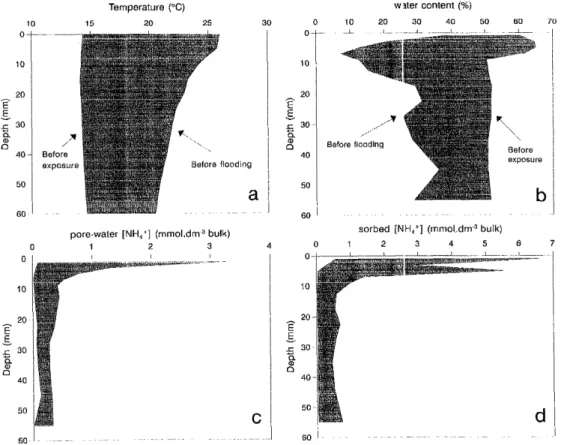
tion takes place. This dramatic change in NH,+ concentra- tions^affects the whole sediment column and influences both sorbed and dissolved fractions; however, changes during this cycle are more clearly evident in the surface sediment (Table 1, Fig. 3). The more permeable surface layer of the sediment is subject to greater variation of temperature (Fig. 4a), which is the probable reason for more pronounced dewatering (Ta- ble 2). By the end of the exposure cycle this layer is both
IO
Temperature (“C) w 3ter content (%)
15 20 25 30 0 IO 20 30 40 50 60 70 O- IO 20 F 2. c 30 ‘L 0” 40 50 60 60 Before flooding
a
pore-water [NH, ‘1 (mmol.dm 3 bulk) sorbed [NH,+1 (mmol dm-3 bulk)
1 2 3 4 0 1 2 3 4 5 6 7 O- IO 20 F i?. c 30 E x 40 50 60 Before flooding C 60 ’
Fig. 4. Depth distribution of full range of variability of the measured parameters during the sampling period. a-Temperature; b-water content as percent weight of bulk sediment; c-dis- solved NH, + in sediment pore water; d-sorbed NH,‘. Indication is gfiren as to when extremes of
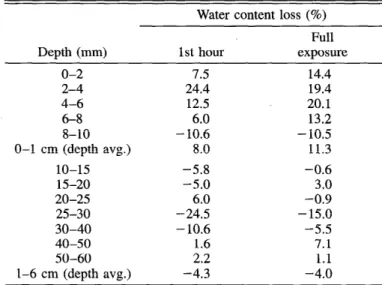
Table 2. Water loss per sediment layer during the exposure pe- riod. Data compare losses during the first hour and after full ex- posure time.
700
Water content loss (%)
Depth (mm) 1st hour o-2 7.5 2-4 24.4 4-6 12.5 6-8 6.0 8-10 - 10.6
O-l cm (depth avg.) 8.0
10-15 -5.8 15-20 -5.0 20-25 6.0 25-30 -24.5 30-40 - 10.6 40-50 1.6 50-60 2.2 1-6 cm (depth avg.) -4.3 Full exposure 14.4 19.4 20.1 13.2 - 10.5 11.3 -0.6 3.0 -0.9 - 15.0 -5.5 7.1 1.1 -4.0 p 600 5 L1 k 500 l 400 5 x 300 I z 200 a, ??a p 100 z 0 -_
Time of day (c.e.t.)
Fig. 5. Change observed in the integrated NH,+ pool with time, from pre-emersion to postimersion. Difference between the surface
l-cm-deep layer and deeper sediment is emphasized. warmer (Fig. 4a) and drier (Fig. 4b) than deeper sediment.
The magnitude of the variation of the NH,+ concentrations in both sorbed and solute fractions is very large, specially in the surface layer (Fig. 4c,d). The NH, + depth profiles (Fig. 3) show surface peaks of concentration for both the dis- solved and exchangeable fractions. In spite of great changes in concentration, the behavior of NH, + in the sediment is very systematic. During exposure, NH, + gradually builds up in the sediment, from 290 to 592 pmol drnh2 bulk (Table 1, Fig. 5). While a larger fraction of the pool is dissolved in the pore water at the beginning of exposure (Fig. 3), the sorbed pool clearly exceeds the solute fraction just before flooding. This change toward dominance by the sorbed NH,+ fraction is reflected in the transient in situ profiles of Ku,iS (in situ dimensionless partition coefficient calculated from the ratio between sorbed and dissolved NH, + pools) (Fig. 6). Again, the effect of flooding is dramatic: in a sudden event, Kn,i, increases to well over 150 at this time (16 h 00 min).
Laboratory sorption experiments-Laboratory sorption
experiments at 25°C allowed comparison of transient hetero- geneous behavior in the field with steady-state adsorption. Within the concentration range encountered in the field, am- monium follows linear adsorption isotherms (Fig. 7). At equilibrium, K* (NH,+ sorption coefficient given by the slope of the sorption isotherm) is higher in deeper than in surficial sediments (Table 3). In comparison with pertinent literature data, Comporta sediments show stronger NH,+ ad- ,sorption than subtidal sediments of the same average poros- ity. As water is lost from the sediment by evapotranspiration (Anderson 1983) and drainage (Gardner 1975), the surface- to-volume ratio between particles and pore water rises. Con- sequently, the sorbed fraction of NH,+ becomes greater than the solute fraction during exposure (Fig. 3), causing a rise in transient depth-averaged Kn,is values (Fig. 8). As NH,+ is
EMERSION EXPOSURE IMMERSION INUNDATED FLAT
0 I- 5 10 15 E 20 E 25 2 E 30 l!i 35 40 45 50 55 60
0
’ Solute O-l cm FLOOD _K
D,in-situ IFig. 6. Change observed in depth profiles of the in situ dimensionless partition coefficient KL),is during the sampling period in the flat (note the logarithmic scale).
5 o-i cm K’=2.21 cm3 g 1 ’ *I-2cm K’=2.67 cm3 g 1 I 4 i 0 I 0 l 012 0.4 0.6 l I 0.8 1 1.2 1.4
Fig. 7. Ammonium sorption isotherms for two sediment layers, at 25°C as obtained from laboratory incubations.
produced, the fraction that is adsorbed grows steadily with time, until the sediment is flooded by the rising tide.
Transport processes induced by flooding-Flooding in- duces an abrupt loss of 441.5 ,zmol dm--2 of NH,+ (-75% of the existing pool at the time), mostly within the first 45 min (Fig. 5, Table 1). After following NH, + concentrations in the near-bottom water column flooding over intertidal sed- iment of the Ria Formosa (South Portugal) for 20 min and comparing with the possible diffusional transport calculated from benthic profiles, Falcao and Vale (1995) concluded that flooding of those sediments resulted in an export of NH,’ that was two orders of magnitude greater than would result from molecular diffusion. They did not, however, follow the behavior of ammonium in the sediment during the previous exposure period, nor did they provide a mechanistic expla-
nation for the observed event. Previous work in the water
column flooding Sado estuary tidal flats (Rocha et al. 1995a) also showed an abrupt rise of NH, E concentrations in the water column during the first hour of flood, but no significant change during ebb.
The main difference between ebb and flood in intertidal sites during daytime is that the sediment has lost water and warmed up with exposure to the atmosphere prior to im-
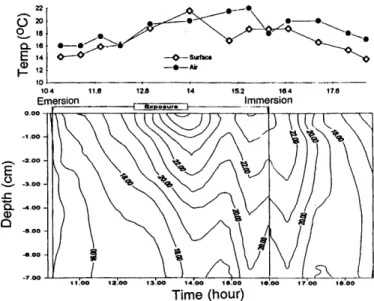
mersion. The temperature gradients inside the sediment dur- ing the exposure cycle (Fig. 9) strongly suggest that free convection takes place after submersion of the site. The ther- mal Rayleigh number was calculated for the situation im- mediately after flooding, following Musgrave and Reeburgh (1982). The depth-averaged permeability for the sediment was 6 X lop5 ccn2, hydraulic conductivity 5.6 cm s-l (using the viscosity of .I 30%0 NaCl solution), and the temperature difference induced by cool in-flowing water was 8.27 K. With this information, the thermal Rayleigh number, which is a measure of the relative importance of convection to dif- fusion in salt transport (Webster et al. 1996), may be cal- culated. This parameter determines the possibility of main- taining free convrection of fluids in the sediment due to the temperature diff12rence. This occurs (Musgrave and Ree- burgh 1982; Howle et al. 1993) when the thermal Rayleigh number (R,)
RI = (c~ATK(pc)~H)lh, (1)
exceeds 40. Here, K is the hydraulic conductivity, cy is the thermal expansicn coefficient, h, is the bulk thermal con- ductivity coefficient of the saturated porous media, (pc), is the heat capacity of pore water, H is the scale depth, and AT is the measured temperature difference. The inverse of the thermal diffusivity of water was taken as a reasonable ap- proximation of A J(pc), (Musgrave and Reeburgh 1982).
The Rayleigh number under the observed conditions is 116, far exceeding the critical value of 40 that allows the maintenance of free convection. This implies that Porewater solutes are being transported into the water column by freely convecting interstitial water, when the sediment is cooled by flooding. Solutes are exchanged first (Fig. 3) into the incom- ing water, lowering the dissolved pool at that time (Fig. 5) and giving high fi-,),,s (Fig. 6) at the exact time of immersion. Because NH,+ sorption is rapidly reversible (Rosenfeld 1978; Ma&in ancl Aller 1984), desorption is quick, lowering Ku,is (Fig. 8) and further increasing the amount of ammonium that is exported. I>uring ebb, however, conditions for buoy-
ancy-driven convection do not exist, for at this time, the heat
flow is directed into the sediment (Fig. 9).
Solute exchange by convection in sediments of lakes (Lappalainen 198’2, Musgrave and Reeburgh 1982) and es- tuaries (Webster et al. 1996) has been proposed as a more effective process for material exchange than diffusion. How- ever, no data are available for intertidal sediments, especially
Table 3. Ammonium dimensionless sorption coefficient K, and sorption coefficient K*, measured in Comporta intertidal sediments, as compared to similar data from pertinent literature, with sediments of comparable porosity.
Location Porosity K* (dm3 kg-‘) KU Source
Cook’s Creek East China Sea Long Island Sound
FOAM Site Comporta Intertidal O-l cm l-2 cm 0.62lr110.012 0.693 -t-O.028 0.53410.018 0.634 0.600~0.006 0.637?0.005 1.04_+0.06 1.7 1.13kO.09 1.3 0.75 +0.05 1.7 1.07 1.6 2.21 3.9 2.67 4.0
Mackin and Aller 1984 Ma&in and Aller 1984
Rosenfeld 1979 This study
100 i cJ O-1 cm I I
Exposure
P
I\
l 1-2 cm I I+ -- - ,i; !; 0.1 I L-i----, -~-. -.~---. j - .,. .-- 9 11 13 15 17 19Time (h)
Fig. 8. Time series of the in situ partition coefficient, Ku,is. Change in the heterogeneous fractionation of the NH,’ pool are shown for the semitidal cycle. Values for K,,is are depth averaged, and two sediment layers are compared.
in warm climates, during the day. The results presented in this paper strongly suggest that the heat balance in temperate and hot regions could control NH,+ exchange between in- tertidal sediments and the oscillating tide during the day. Convection can considerably accelerate mixing of solutes in sediment pore waters and also enhance exchange with the incoming tide.
In tidal flats of the Sado estuary, the water is warmer than the surface sediment during ebb tide, which, along with the fact that the sediment is saturated, allows NH,+ to be ex- changed only by diffusion, probably enhanced by bioturba- tion and resuspension. However, when water invades the sediment at high tide, the heat gradient is reversed. Cooler water creates density gradients within the interstitial solution that maintain free convection. Warmer pore water migrates to the surface, dragging “new” mineralized solutes in the process, and a major Porewater exchange event takes place. In this case, convection is not maintained; in a sudden event, there is an overturn of pore water and the temperature gra- dient is gone. If sediments were not warmer, the incoming water would only resaturate the drier sediment, diluting in- terstitial solutes. In this case, exchange would once again only take place by diffusion (enhanced or not), increasing the residence time of benthic organic matter within the flat. This is arguably the case of night exposure and of colder climates, where the temperature gradient could be insuffi- cient to cause free convection at the time of flooding. These results add to the work by Falcao and Vale (1995) and Rocha et al. (1995a) inasmuch as they provide a supporting mech- anism to explain the abrupt rises in NH, I concentration ob- served both in the Ria Formosa and the Sado tidal systems during flood.
Ammoni@ation and mineralization rates-The observed
build-up of total regenerated ammonium in the top 6 cm of
Time (hour)
Fig. 9. Sediment surface temperature variation with respect to air temperature over the sampling site for the semitidal cycle. Iso- therms show temporal change in the temperature field within the sediment column for the same period.
the sediment (28.2 mmol mm2) will give an average ammon- ification rate during daytime exposure of 4.9 mmol m-2 h-l. This gives a residence time for the organic N pool (5,110 mmol N rnm2) of 43.4 d. In a similar way, the estimated ammonification rate can be used for a rough estimate of the carbon regeneration rate during daytime exposure and, thus, the residence time of the organic carbon pool in the sedi- ment. As the depth average of the molar C : N ratio in this sediment layer is 17.4, and assuming that organic matter is remineralized stoichiometrically ( 1 -G model) at this same ratio, the exposed sediment supports an organic C degrada- tion rate of 85.2 mmol C me2 h--l, which gives an estimate of the residence time of the organic carbon pool (76,600 mmol C mm2) for the top 6 cm of 37.5 d. These estimates are made assuming steady state on an annual basis, and so the residence time could be obtained by dividing the organic carbon and nitrogen inventory in the first 6 cm by the re- generation rate (Middelburg et al. 1996). The estimates for the Sado estuary may, however, deviate from true mineral- ization rates on account of (1) denitrification as well as the possible presence of benthic primary producers that take up part of the regenerated ammonia, masking even higher am- monification rates or (2) steady state does not apply, which is certainly the case for intertidal sediments, and so the stoi- chiometric relations will not be directly applicable. On the other hand, NH,+ production in the sediment is not caused by manganese dioxide reduction, so the carbon mineraliza- tion rate is certainly an underestimate of the true values.
Previous work (Rocha et al. 199%) in these sediments show
very low nitrification (< 1 pmol dmP3 h-l) at temperatures higher (10°C) than the storage temperature (4”C), for the same time period, so nitrification and denitrification will not change the ammonification rates measured in situ in a sig- nificant way.
The residence time of the benthic organic C pool is quite low compared with surficial sediments of the Westerschelde
estuary (146 d to 18.6 yr; Middelburg et al. 1996), Chesa- peake Bay (75 d to 15 yr; Burdige 1991), and Cape Lookout Bight (98 d to 4.3 yr; Martens and Klump 1984). However, higher average annual temperatures (Cabecadas and Bro- gueira 1991; Rocha et al. 1995a), more permeable sedi- ments, and a high adaptability of local sediment microor- ganisms to changing temperatures (Rocha et al. 1995b) all contribute to lowering the turnover rates of solutes in the sediment, which might explain the lower residence times for organic carbon found in intertidal sediments of the Sado es- tuary, as compared with other systems. On the other hand, convective turnover of Porewater solutes with the incoming tidal water will provide a rapid mechanism for the export of NH, t produced during exposure.
BURDIGE, D. J. 1991. The kinetics of organic matter mineralization in anoxic marine sediments. J. Mar. Res. 49: 727-761.
CABECADAS, G., AND M. J. BROGUEIRA. 1991. The Sado estuary, Portugal: Eutrophication conditions in areas of aquacultural ac- tivities. Envil-on. Pollut. 1: 810-820.
DE JONGE, V. N., AND J. E. E. VAN BEUSEKOM. 1995. Wind and tide-induced resuspension of sediment and microphytobenthos from tidal fiz.ts of the Ems estuary. Limnol. Oceanogr. 40(4): 766-778.
EMERSON, S., R. JAHNKE, AND D. HEGGIE. 1984. Sediment-water exchange in shallow water estuarine sediments. J. Mar. Res. 42: 709-730
FALCAO, M., AND C. VALE. 1995. Tidal flushing of ammonium from intertidal sediments of Ria Formosa, Portugal. Neth. J. Aquat. Ecol. 29(3-4 1: 239-244.
Conclusions
GARDNER, L. B. 1975. Runoff from an intertidal marsh during tidal
exposure-recession curves and chemical characteristics. Lim-
nol. Oceanogr. 20(l): 81-89. The results of this study provide new insights in three
areas of warm intertidal-sediment geochemistry. Firstly, con- vective turnover of the sediment pore water can happen abruptly when the flat is inundated after exposure. Convec- tion after flooding is supported by the water loss and tem- perature rise during exposure and by the sandy nature of the sediment. For the Sado estuary, this process is responsible for rapid export of 75% of the total NH, I pool (44.2 mmol m-2) in the first 6 cm of the sediment column into flood water, mostly in the 45-min period after inundation.
Secondly, high ammonification rates (4.9 mmol NH,’ mm2 h-l in the Sado) can be tentatively ascribed to a high annual average temperature, permeable sediments that increase mix- ing and dispersion of Porewater solutes, decreasing their res- idence time, and high adaptability of benthic microorgan- isms to abrupt changes in temperature.
Finally, the ammonification rate can be used in conjunc- tion with the depth-averaged molar C : N ratio in order to estimate roughly the organic carbon mineralization rate dur- ing exposure, as well as the residence time of organic C and N benthic pools. In the present case a high mineralization rate of 85.2 mmol C m-2 h-l was calculated, which indicates a very low residence time of 37.5 d for organic carbon. This estimate, however simple, provides an indication of the ra- pidity of organic matter turnover in intertidal sediments of the Sado estuary and ultimately of their importance in the overall carbon budget of the estuary.
HIROTA, J., AND J. F? SZYPER. 1975. Separation of total particulate carbon into inorganic and organic components. Limnol. Ocean- ogr. 6(20): 896-900.
H~WES, B. L., AI\;D D. D. GOEMRINGER. 1994. Porewater drainage and dissolved organic carbon and nutrient losses through the intertidal creekbanks of a New England Salt marsh. Mar. Ecol.
Prog. Ser. 114: 289-301.
HOWLE, L., R. P BEHRINGER, AND J. GEORGIADIS. 1993. Visualiza- tion of convective fluid flow in a porous medium. Nature 362: 230-232.
HUETTEL, M., AND G. GUST. 1992~. Bioroughness in the millimeter scale enhances inter-facial solute fluxes in permeable sediments.
ASLO-Aquatic Sciences Meeting Abstracts, Santa Fe, New
Mexico, 9-14 Feb. Am. Sot. Limnol. Oceanogr.
-, AND --. 19926. Solute release mechanisms from con- fined sediment cores in stirred benthic chambers and flume flows. Mar. Ecol. Prog. Ser. 82: 187-197.
JORGENSEN, B. B. 1983. Processes at the sediment-water interface, p. 477-515. In B. Bolin and R. B. Cook [eds.], The major biogeochemical cycles and their interactions. SCOPE.
LAPPALAINEN, K. .M. 1982. Convection in bottom sediments and its role in material exchange between water and sediments. Hy- drobiologia 816: 105-108.
References
ANDERSON, E E. 1983. The northern muddy intertidal: seasonal fac-
tors controlling erosion and deposition--a review. Can. J. Fish. Aquat. Sci. 4O(suppl. 1): 143-159.
AND B. A. HOWELL. 1984. Dewatering of an unvegetated middy tidal flat during exposureAessication or drainage? Es- tuaries 6(3): 225-232.
MACKIN, J. E., AND R. C. ALLER. 1984. Ammonium adsorption in marine sediments. Limnol. Oceanogr. 29: 250-257.
MARTENS, C. S., ,\ND J. V. KLUMP. 1984. Biochemical cycling in an organic-rich coastal sediment basin 4. An organic carbon budget for sediments dominated by sulfate reduction and meth- anogenesis. G eochim. Cosmochim. Acta 52: 153 1-1543.
MIDDELBURG, J. J., G. KLAVER, J. NIEUWENHUIZE, A. WIELEMAKER,
W. DE HAAS, T. VLUG, AND J. E W. A. VAN DER NAT. 1996. Organic matter mineralization in intertidal sediments along an estuarine graciient. Mar. Ecol. Prog. Ser. 132: 157-168.
MUSGRAVE, D. L., AND W. S. REEBURGH. 1982. Density driven interstitial water motion in sediments. Nature 299: 331-334.
NIEI,SEN, L. I?, I? B. CHRISTENSEN, N. F? REVSBECH, AND J. SOR- ENSEN. 1990. Denitrification and oxygen respiration in biofilms studied with a microsensor for nitrous oxide and oxygen. Mi-
crab. Ecol. 19: 63-72.
BERNER, R. A. 1980. Early diagenesis-a theoretical approach. Princeton Univ.
BI,ACKBIJRN, T. H., AND K. HENRIKSEN. 1983. Nitrogen cycling in different types of sediments from Danish waters. Limnol. Oceanogr. 28: 477-493.
NIXON, S. W. 198 1. Remineralization and nutrient cycling in coastal marinc ecosystems, p. 111-138. In B. Neilson and L. Cronin [eds.], Estuaries and nutrients. Humana.
OREMLAND, R. S., AND D. S. CAPONE. 1988. Use of “specific” inhibitors in biogeochemistry and microbial ecology. Adv. Mi-
crab. Ecolog. 10: 286-383.
BOATMAN, C. D., AND J. W. MURRAY. 1982. Modelling exchange- RIEDL, R. J., AND R. MACHAN. 1972. Hydrodynamic patterns in able NH,+ adsorption in marine sediments: Process and con- lotic intertida.. sands and their bioclimatological implications.
RISGAARD-PETERSEN, N., S. RYSGAARD, L. F? NIELSEN, AND N. l? REVSBECH. 1994. Diurnal variation of denitrification and nitri- fication in sediments colonized by benthic microphytes. Lim- nol. Oceanogr. 39(3): 573-579.
ROCHA, C., G. CABECADAS, AND M. J. BROGUEIRA. 199%. On the importance of sediment-water exchange processes of ammonia to primary production in shallow areas of the Sado estuary (Portugal). Neth. J. Aquat. Ecol. 29(3-4): 265-273.
-, M. J. MADUREIKA, AND M. CAETANO. 1995b. Role of mi-
croorganisms in mineralization processes in intertidal sedi-
ments subject to high temperatures: An incubation experiment.
Neth. J. Aquat. Ecol. 29(H): 257-263.
ROSENPELD, J. K. 1979. Ammonium adsorption in nearshore anoxic sediments. Limnol. Oceanogr. 24: 356-364.
SEITZINGER, S. P 1988. Denitrification in freshwater and coastal
marine ecosystems: Ecological and geological significance.
Limnol. Oceanogr. 33: 702-724.
TODD, D. K. 1964. Groundwater, p. 13.1-13.55. In V. T. Chow fed.1,
Handbook of applied hydrology-a compendium of water re-
sources technology. McGraw-Hill.
VAN DER LOEFF, R. 198 1. Wave effects on sediment water exchange
in a submerged sand bed. Neth. J. Sea Res. 15(l): 100-112.
VAN RAAPHORST, W., AND J. E I? MALSCHAERT. 1995. Ammonium adsorption in superficial North Sea sediments. Cont. Shelf Res. In press.
WALSII, J. J. 1991. Inportance of continental margins in the marine biogeochemical cycling of carbon and nitrogen. Nature 350(7): 53-55.
WEBB, J. E., AND J. L. THEODOR. 1968. Irrigation of submerged marine sands through wave action. Nature 220: 682-683.
-, AND - 1972. Wave-induced circulation in submerged sands. J. Mar. B’iol. Assoc. U.K. 52: 903-914.
WEBSTER, I. T., S. J. NORQUAY, E C. Ross, AND R. A. WOODING.
1996. Solute exchange by convection within estuarine sedi- ments. Estuarine Coastal Shelf Sci. 42: 171-183.
Received: 12 December 1995 Accepted: 26 March 1997 Amended: 18 May 1998