Cardoso, A. J. M. and Oliveira, L. M. R.: "Condition monitoring and diagnostics of power transformers", Proceedings of the 11th International Congress and Exhibition on Condition Monitoring and Diagnostic Engineering Management (COMADEM'98), vol. 2, pp. 591-599, Launceston, Tasmania, Australia, December 8-11, 1998.
Seleccionado para publicação em revista internacional:
Cardoso, A. J. M. and Oliveira, L. M. R.: "Condition monitoring and diagnostics of power transformers",
Condition Monitoring and Diagnostics of Power Transformers
A. J. Marques Cardoso (1, 2) Luís M. R. Oliveira (1, 3)(1)
Instituto de Telecomunicações – Pólo de Coimbra, Linha de Sistemas de Energia Pólo II - Pinhal de Marrocos, P-3030 Coimbra, Portugal
(2)
Universidade de Coimbra, Departamento de Engenharia Electrotécnica Pólo II - Pinhal de Marrocos, P-3030 Coimbra, Portugal
e-mail: acardoso@dee.uc.pt (3)
Escola Superior de Tecnologia da Universidade do Algarve Campus da Penha, P-8000 Faro, Portugal
e-mail: lolivei@ualg.pt
Abstract: This paper addresses the subject of condition monitoring and diagnostics of power transformers. The main results of two reliability surveys, carried out under the auspices of CIGRE and IEEE in order to assemble objective data on the performance of transformers in service, are presented, providing useful information on the main causes of transformer failures, the most likely affected components and the related outages times. A survey of the most important methods, actually in use, for condition monitoring and diagnostics of power transformers is also given, which stresses the need for the development of new diagnostic methods, that can be applied without taking the transformers out of service, and that can also provide a fault severity criteria, in particular for determining transformers windings integrity. Preliminary results, concerning the on-going research activity on the development of a new approach for inter-turn winding fault diagnosis in three-phase transformers, are also reported in the paper.
Keywords: transformers, failures, diagnostics, condition monitoring.
1. Introduction
The electricity market has been, in general, dominated by national or regional monopolies. During the last years, this picture has changed drastically, particularly in Europe and in the USA. The trend towards free competition and privatisation with the related demands on return on investments, results in a cost consciousness among utilities. In this context, monitoring and on-site diagnostics are seen as a possible way of optimising existing assets. The main driving forces are to reduce maintenance costs, to prevent forced outages with the related consequential costs, and to work existing equipment harder and longer [1]. Transformers constitute the largest single component of the transmission and distribution equipment market. In 1995, the estimated value of the world market for power transformers was US$11.85 billion [2]. Therefore it is quite obvious the need for the development of on-line diagnostic techniques, that would aid in transformers maintenance. This, in turn, implies an exhaustive knowledge about the most likely failures that can occur, and also about its main underlying causes.
Two major transformer reliability surveys, carried out under the auspices of CIGRE [3] and IEEE [4] in order to assemble objective data on the performance of transformers in service, provide useful information.
2. International Survey on Failures in Large Power Transformers in Service [3]
The main objectives of this international survey, conducted in 1978 by the Working Group 05 (Transformer Reliability) of Study Committee 12 (Transformers) of CIGRE (International Conference on Large High Voltage Electric Systems), were to pinpoint the main causes of transformer failures and to evaluate transformer outage times.
The survey involved transformer units designed for networks with a highest system voltage of not less than 72 kV, without any limitations on rated power, not older than 20 years, and installed on generation, transmission and distribution systems (including HVDC systems).
The analysis took in more than 1000 failures (1), relating to a total population of more than 47000 unit-years, which corresponds to a general failure rate figure, irrespective of the voltage classes and function of the
(1)
units, of the order of 2%. Nevertheless, if voltage classes are taken into account, it seems that the failure rate increases with voltage.
The data available were also analysed as a function of the failure first component involved and of the presumed cause. The statistically more substantial results are those concerning substation transformers with on-load-tap-changers (OLTC) (1).
Regarding the first component involved (Fig. 1) it may be noted that about 33% of failures are due to the windings. The failures were also subdivided as a function of downtime (Fig. 2) into three classes (not more than one day; from 1 to 30 days; and more than 30 days) in order, however roughly, to be able to correlate downtime with the components involved in the failures. From Fig. 2, it can be seen that the longer downtimes are associated with winding faults.
.
Fig. 1: Typical failure distribution for substation transformers (1).
Fig. 2: Typical downtime as a function of failure distribution for substation transformers (1).
Regarding the presumed causes of failures, and despite uncertainty about the reliability of the collected data, it would seem to be possible to state that failures due to design, manufacture, and materials, which often involve long outage times, represent a high percentage of failures, as shown in Fig. 3.
(1)
In order to be able to compare these results with the ones obtained in the IEEE Transformer Reliability Survey (IEEE Standard 493-1990, 1990), the faults associated with the OLTC are not considered in this paper.
Accessories 20% Windings 33% Magnetic Circuit 4% Terminals 21% Tank/Fluid 22% 0 5 10 15 20 25 30 35 Windings M agnetic Circuit Terminals Tank/Fluid Accessories Downtime < 1day
1day < Downtime < 30 days Downtime > 30 days
%
Downtime < 1day 1day < Downtime < 30 days Downtime > 30 days Windings Magnetic Circuit Terminals Tank/Fluid Accessories
Fig. 3: Presumed causes of failures for substation transformers.
3. Transformer Reliability Survey
⎯ Industrial Plants and Commercial Buildings [4]
The Power Systems Reliability Subcommittee of the IEEE Industry Applications Society has been conducting surveys of the reliability of electrical equipment, transformers included, in industrial and commercial power systems. The 1979 survey results, which are presented in the IEEE Standard 493-1990, reveal a failure rate of 0.62% for the liquid-filled power transformers and a failure rate of 1.9% for rectifier transformers (1).
The 1979 survey limited the choices of failure type to "windings" and "others" as shown in Table I for power and rectifier transformers. Clearly, the most significant failure type occurred in power transformer windings.
Table I
TYPE OF FAILURE FOR POWER AND RECTIFIER TRANSFORMERS
(1979 Survey)
All Power Transformers All Rectifier Transformers
Type of Failure Number of Failures Percentage Number of Failures Percentage Windings 59 53 8 50 Others 53 47 8 50
Although it is not possible to correlate downtime with the failure type, it is however possible to correlate downtime for all electrical equipment surveyed. From that analysis it can be concluded that transformers downtime per failure is, in general, the highest one.
Fig. 4 summarises the suspected failure responsibility for power transformer failures. The results show that manufacturer defects and inadequate maintenance are responsible for the majority of power transformer failures (i.e. 60 %).
(1)
Relay or tap changer faults were not considered in calculation of failure rates.
Unknown/ Others 29% Transport/ Storage 1% Design 16% Manufacture 16% Materials 13% Outside Agents 13% Incorrect Maintenance 8% Incorrect Erection on Site 4%
Fig. 4: Suspected failure responsibility for power transformers (1979 survey).
4. Corollary of Transformer Reliability Surveys
As a corollary, and similarly to what happens with other electrical equipment, namely with three-phase induction motors [5], it could be also stated here that, beyond the correct installation and utilisation of transformers, areas where standardisation could perform a very important role, a substantial reliability improvement still implies the development of reliable diagnostic techniques that would contribute not only for a more effective quality control and therefore reducing manufacturing defects, but also for the implementation of adequate maintenance strategies.
5. Transformer Diagnostic Techniques
Several approaches have been developed with the purpose of providing an accurate and complete diagnosis of power transformers.
5.1 Dissolved Gas Analysis
A transformer is subject to electrical and thermal stresses. These two stresses could break down the insulating materials and release gaseous decomposition products. Overheating, corona and arcing are three primary causes of fault related gases. Different patterns of gases are generated due to different intensities of energy dissipated by various faults. The analysis of dissolved gases is a powerful tool to diagnose developing faults in oil-filled power transformers. By sampling and examining the insulation oil of transformers, ratios of specific dissolved gas concentrations, their generation rates, and total combustible gases are often used as the attributes of classification by diverse dissolved gas analysis approaches, such as the key gas analysis, the Doernenburg and the Rogers gas ratio methods described in the ANSI/IEEE Standard C57.104-1991. These methods would find the relationship between the gases and the fault conditions, some of which are obvious and some of which may not be apparent − hidden relationships − [6-8].
Expert systems, fuzzy logic and artificial neural network approaches have been proposed to reveal some of the hidden relationships in transformer fault diagnosis [7-10].
5.2 Partial Discharges
It is commonly known that partial discharges in a transformer deteriorate the insulation to the point of destruction [11].
Partial discharges pulses generate at their point of origin electromagnetic waves, acoustic waves, local heating and chemical reactions. Theoretically, these phenomena, if detectable, would constitute possible indicators of a partial discharge defect. The established, but not always successfully applied, methods for partial discharge defect location are based on acoustical techniques, electrical techniques, or a combination of both [1], [12]. Manufacturer defective component or improper assembly 34% Improper application 3% Inadequate installation and testing prior start-up
6% Inadequate maintenance 26% Inadequate operating procedures 4% Outside Agents 9% Others 17% Transport to site or improper handling 1%
5.3 Temperature [13]
Several approaches have been adopted to develop hot spot sensors suitable for insertion into transformer windings. Measurement systems exist which show promise of practical application in commercial transformers. The most promising results of development seem to be devices making use of an optical fibre transmitter connected to a crystal sensor, which convert the incoming light beam into an optical signal characteristic of the sensor temperature. These devices have demonstrated their properties in factory tests and to some extent, in service.
Nevertheless, some problems concerning the widespread use of this diagnostic technique remain to be solved, namely: temperature sensors can only be installed in the windings when the transformer is manufactured or repaired; the optimum location of the sensor is difficult to predict; since the temperature sensors are inserted into the insulation structure under high voltage conditions, special precaution must be applied in order to preserve the electrical and mechanical strength of the insulation system.
Alternatively, infrared camera measurement is worthy of mention, which is already in use for indirect indication of transformer hot spots.
5.4 Vibrations
Vibration signals analysis is being pursued as a likely means of achieving a dependable transformer winding mechanical integrity diagnostic tool. The vibration sensors are magnetically mounted piezo-electric accelerometers attached to the sides and top of the transformer tanks. The signals are optically isolated for transmission to a data recorder. The occurrence of winding looseness have been investigated [14]. A similar approach has been also applied as a method for diagnostics of on-load-tap-changers [1].
Vibration measurement and analysis may, however, prove to be complicated due to the various sources which cause vibration of a transformer (i.e., primary excitation, leakage flux, mechanical interaction, and on/off load switching) and the various locations where vibration signals may be taken [14, 15].
5.5 Leakage Flux
This is a traditional method for detecting changes in the winding geometry [1].
The windings mechanical displacement results, mainly, in modifications of the leakage flux radial component. By using search coils, conveniently installed in the transformer, it is possible to measure such modifications [16].
However, some of the problems previously mentioned regarding temperature sensors installation, still apply here.
5.6 Frequency Response Analysis
By measuring the transfer function of the transformer, deformations of the windings can sometimes be detected, provided that a reference fingerprint of the unit is available. Deformation or changes in geometrical distances of the windings leads to changes in internal capacitances, and thereby a change in the transfer function of the transformer. In practice, an impulse is injected on one side, and the fourier spectrum is measured of both the impulse and of the response on the other side. The transfer function is calculated by dividing the two spectra [1, 17].
As an alternative to the formerly used time domain testing (Low Voltage Impulse Method) [18], the Frequency Response Analysis is one of the more frequently used techniques for diagnosing deformations of the transformers windings. However, this technique presents as major disadvantages the need to set the transformer out of service and it involves great uncertainties due to the fact that the result is affected by a large number of factors [1, 19].
5.7 Excitation Current
The single-phase excitation-current test can be used to detect undesirable conditions in single-phase or three-phase transformers. Normally the test results are analysed by comparing currents between all three three-phases in a given transformer and between the similar single-phase units. Certain problems, however, can be detected
on the basis of current change when the measurements are performed on different load tap-changer positions. Accordingly, understanding how the load tap-changer affects the current magnitude of individual phases is essential for developing proper analysis [20, 21]. Moreover, this method also requires the transformer to be disconnected.
6. Corollary of Transformer Diagnostic Techniques
As a corollary, it could be stated here that it is of prime importance the development of diagnostic techniques, which can be applied without taking the transformer out of service and which can also provide a fault severity criteria, in particular for determining winding defects, since this is the most significant failure type occurred in power transformers and this is also the one with an associated longer downtime.
7. Park's Vector Approach
As a function of mains phase variables (i ,R i ,S i ) the transformer current Park's Vector components T
(i ,D i ) are: Q
(
) ( ) ( )
R S T D i i i i = 2 3 − 1 6 − 1 6 (1)( ) ( )
S T Q i i i = 1 2 − 1 2 (2)Under ideal conditions, the three-phase currents lead to a Park's Vector with the following components:
( )
i( )
t iD = 6 2 M sin ω (3)( )
6 2 sin(
ω −π 2)
= i t iQ M (4) where Mi maximum value of the supply current (A); ω angular supply frequency (rad s);
t time variable (s).
The corresponding representation is a circular locus centered at the origin of the coordinates.
Under abnormal conditions (3) and (4) are no longer valid and consequently the observed picture differs from the reference pattern.
The operating philosophy of the Park's Vector Approach is thus based on identifying unique signature patterns in the figures obtained, corresponding to the transformer current Park's Vector representation.
Previous research, concerning the use of Park's Vector Approach, has demonstrated the effectiveness of this noninvasive technique for diagnosing malfunctions in operating three-phase induction motors, power electronics and adjustable speed drives [22].
This paper presents experimental results concerning the monitoring of primary and secondary current Park's Vector representations, for diagnosing inter-turn winding faults in operating three-phase transformers.
7.1 Laboratory Tests [23]
For the experimental investigation a three-phase, three-leg transformer, of 6 kVA, 220/127 V, was used (Fig. 5). The transformer has two windings per phase on the primary and on the secondary side, having, one of each, been modified by addition of a number of tappings connected to the coils, for each of the three phases, allowing for the introduction of different percentages of shorted turns at several locations in the winding, as shown in Fig. 6 for transformer phase R.
The transformer was initially tested, in the absence of faults, under several load conditions, and for different winding connections, in order to verify the primary and secondary current Park's Vector reference patterns.
Fig. 5: Photograph of the test transformer.
Subsequently, different percentages of shorted turns were introduced in the windings and primary and secondary current Park's Vector were examined as a function of the degree of severity of the fault and its location. A shorting resistor was used, whose value was chosen so as to create an effect strong enough to be easily visualised, but simultaneously big enough to limit the short circuit current and thus protecting the transformer from complete failure when the short is introduced.
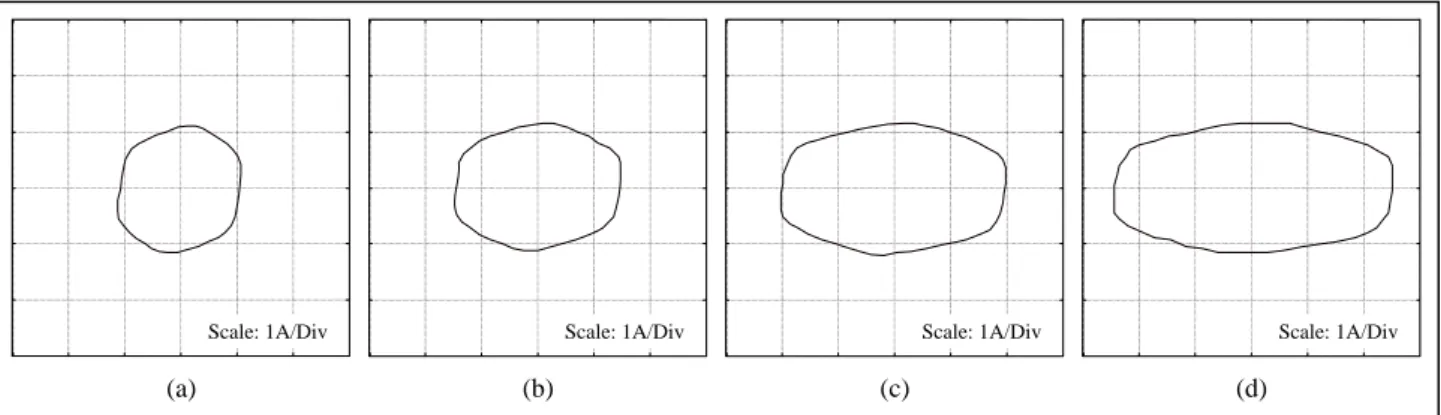
Fig. 7(a) shows the supply current Park's Vector pattern of the test transformer, corresponding to a healthy behaviour with a balanced resistive load and for the case of Yy6 connection of its windings. This pattern differs slightly from the circular locus expected for ideal conditions due to, among others, the lower amplitude of the primary current in phase S, with respect to phases R and T, as a result of a higher inductance of the central leg winding of the transformer.
For the same load conditions and transformer winding connections mentioned above, the occurrence of primary inter-turn short circuits manifests itself in the deformation of the supply current Park's Vector pattern corresponding to a healthy condition, leading to an elliptic representation whose ellipticity increases with the severity of the fault (Fig. 7(b) − Fig. 7(d)) and whose major axis orientation is associated to the faulty phase (Fig. 8). Similar conclusions, concerning the transformer supply current Park's Vector patterns, can be drawn for the occurrence of secondary inter-turn short circuits, under the same load conditions and winding connections.
Fig. 6: Location of the tappings for transformer phase R.
U1 5% UA UB UC 10% 20% UD 5% UE X1 UF UG 20% 10% 5% 25% U2 X2 u1 5% ua ub uc 10% 20% ud 5% ue x1 uf ug 20% 10% 5% 25% u2 x2
Fig. 7: Experimental primary current Park's Vector patterns, corresponding to the following cases: (a) healthy transformer; (b) 5% of shorted turns in phase R (UA-UB); (c) 10% of shorted turns in phase R (U1-UA);
(d) 15% of shorted turns in phase R (U1-UB).
Other experimental tests carried out for different types of the transformer primary winding connections lead to similar conclusions to the ones presented before, although, for example, for the cases of star connection (Yy6) and delta connection (Dy5) of the transformer primary windings, the supply current Park's Vector patterns, corresponding to the occurrence of inter-turn short circuits, present a global rotation of approximately 30º between each other.
Fig.8: Comparative representation of the transformer primary current Park's Vector patterns, for the same degree of severity of the fault (10% of shorted turns), but localised in distinctive phases.
The transformer secondary current Park's Vector pattern doesn't provide any indication about inter-turn short circuits that may occur, either in the primary or in the secondary side of the transformer. However, it plays a very important role for discriminating the presence of unbalanced loads.
Conclusions
Two reliability surveys, carried out under the auspices of CIGRE and IEEE in order to assemble objective data on the performance of transformers in service, are presented in the paper. The results show that manufacturer defects and inadequate maintenance are responsible for the majority of power transformer failures. Regarding the first component involved, it can be concluded that the most significant percentage of failures are due to the windings. Moreover, the longer downtimes are also associated with winding faults. A survey of the most important methods, actually in use, for condition monitoring and diagnostics of power transformers is also given in the paper. The need for the development of new diagnostic techniques, which can be applied without taking the transformer out of service and which can also provide a fault severity criteria, is easily recognised, in particular for determining transformer winding faults.
Preliminary results, concerning the use of Park's Vector Approach, has demonstrated the effectiveness of this Scale: 1A/Div (a) Scale: 1A/Div (b) Scale: 1A/Div (c) Scale: 1A/Div (d) Phase R Phase S Phase T Scale: 1A/Div
noninvasive technique for diagnosing the occurrence of inter-turn short circuit in the windings of operating three-phase transformers. The on-line diagnosis is based on identifying the appearance of an elliptic pattern, corresponding to the transformer supply current Park's Vector representation, whose ellipticity increases with the severity of the fault and whose major axis orientation is associated to the faulty phase.
Further work is currently in progress, concerning the modelling and simulation of the behaviour of three-phase transformers, under the influence of winding inter-turn short circuits. Additionally, some refinements of the proposed method are being introduced, with the aim of dealing with the simultaneous occurrence of winding faults, unbalanced supply voltages, unbalanced loads, or even the surrounding presence of power electronics equipment.
Finally, as system aspects are becoming more important, transformers will not be looked upon as a separate apparatus, but rather as a part in a system. This will put demands both on the monitoring systems as well as on the relative importance of different diagnostic methods [1], areas where international standards should be emphasised or even developed.
References
[1] Bengtsson, C.: "Status and trends in transformer monitoring"; IEEE Transactions on Power Delivery, Vol. 11, No. 3, pp. 1379-1384, 1996.
[2] Aubertin, S.: "Opportunity knocks"; International Power Generation, vol. 20, No. 2, pp. 47-48, 1997. [3] CIGRE/SC 12/WG 05: "An international survey on failures in large power transformers in service";
Electra, No. 88, pp. 21-48, 1983.
[4] IEEE Standard 493-1990: "IEEE recommended practice for the design of reliable industrial and
commercial power systems"; Chapter 3, 1990.
[5] Cardoso, A. J. M.: "Fault diagnosis in three-phase induction motors" (in Portuguese); Coimbra Editora (ISBN 972-32-0452-5), 1991.
[6] Inoue, Y.; Suganuma, K.; Kamba, M. and Kikkawa, M.: "Development of oil-dissolved gas detector for
diagnosis of transformers"; IEEE Transactions on Power Delivery, Vol. 5, No. 1, pp. 226-232, 1990. [7] Zhang, Y.; Ding, X.; Liu, Y. and Griffin, P. J.: "An artificial neural network approach to transformer
fault diagnosis"; IEEE Transactions on Power Delivery, Vol. 11, No. 4, pp. 1836-1841, 1996.
[8] Huang, Y. C.; Yang, H. T. and Huang, C. L.: "Developing a new transformer fault diagnosis system
through evolutionary fuzzy logic"; IEEE Transactions on Power Delivery, Vol. 12, No. 2, pp. 761-767, 1997.
[9] Lin, C. E.; Ling, J. M. and Huang, C. L.: "An expert system for transformer fault diagnosis using
dissolved gas analysis"; IEEE Transactions on Power Delivery, Vol. 8, No. 1, pp. 231-238, 1993.
[10] Tomsovic, K.; Tapper, M. and Ingvarsson, T.: "A fuzzy information approach to integrating different
transformer diagnostic methods"; IEEE Transactions on Power Delivery, Vol. 8, No. 3, pp. 1638-1646, 1993.
[11] Kawaguchi, Y. and Yanabu, S.: "Partial-discharge measurement on high-voltage power transformers"; IEEE Transactions on Power Apparatus and Systems, Vol. PAS-88, No. 8, pp. 1187-1194, 1969.
[12] Fuhr, J.; Haessig, M.; Boss, P.; Tschudi, D. and King, R. A.: "Detection and location of internal defects
in the insulation of power transformers"; IEEE Transactions on Electrical Insulation, Vol. 28, No. 6, pp. 1057-1067, 1993.
[13] CIGRE/SC 12/WG 09: "Direct measurements of the hot-spot temperature of transformers"; Electra, No. 129, pp. 47-51; 1990.
[14] Mechefske, C. K.: "Correlating power transformer tank vibration characteristics to winding looseness"; Insight, Vol. 37, No. 8, pp. 599-604, 1985.
[15] Sanz-Bobi, M. A.; García-Cerrada, A.; Palacios, R.; Villar, J.; Rolán, J. and Moran, B.: "Experiences
learned from the on-line internal monitoring of the behaviour of a transformer"; IEEE International Electric Machines and Drives Conference, Milwaukee, USA, 1997.
[16] Kulikowski, J.; Lech, W.; Rachwalski, J. and Tyminski, L.: "Expérience acquise dans les essais de
court-circuit des transformateur"; CIGRE rapport 12-13, 1968.
[17] Dick, E. P. and Erven, C. C.: "Transformer diagnostic by frequency response analysis"; IEEE Transactions on Power Apparatus and Systems, Vol. PAS-97, No. 6, pp. 2144-2153, 1978.
[18] Rogers, E. J.; Gillies, D. A. and Humbard, L. E.: "Instrumentation techniques for low voltage impulse
testing of power transformers"; IEEE Transactions on Power Apparatus and Systems, Vol. PAS-101, pp.1281-1293, 1972.
[19] Bak-Jensen, J.; Bak-Jensen, B. and Mikkelsen, S. D.: "Detection of faults and ageing phenomena in
transformers by transfer functions"; IEEE Transactions on Power Delivery, Vol. 10, No. 1, pp. 308-314, 1995.
[20] Lachman, M. F.: "Field measurements of transformer single-phase exciting current as diagnostic tool,
and influence of load tap changers"; IEEE Transactions on Power Delivery, Vol. 9, No. 3, pp. 1466-1475, 1994.
[21] Rickley, A. L.; Clark, R. E. and Povey, E. H.: "Field measurements of transformer excitation current as
diagnostic tool"; IEEE Transactions on Power Apparatus and Systems, Vol. PAS-100, No. 4, pp. 1985-1988, 1981.
[22] Cardoso, A. J. M.: "The Park's Vector Approach: a general tool for diagnostics of electrical machines,
power electronics and adjustable speed drives"; Record of the 1997 IEEE International Symposium on Diagnostics for Electrical Machines, Power Electronics and Drives, Carry-le-Rouet, France, pp. 261-269, 1997.
[23] Cardoso, A. J. M.; Oliveira, L. M. R.; Gameiro, N. S. and Veloso, P. M. M. G.: "Fault diagnosis in
three-phase transformers" (in Portuguese); Anais da Engenharia e Tecnologia Electrotécnica, No. 6, pp. 9-12, 1998.