0022-538X/11/$12.00
doi:10.1128/JVI.01921-10
Copyright © 2011, American Society for Microbiology. All Rights Reserved.
Cell-Associated Viral Burden Provides Evidence of Ongoing Viral
Replication in Aviremic HIV-2-Infected Patients
䌤
Rui S. Soares,
1† Rita Tendeiro,
1Russell B. Foxall,
1Anto
´nio P. Baptista,
1† Rita Cavaleiro,
1Perpe
´tua Gomes,
2,3,4Ricardo Camacho,
2,4Emília Valadas,
5Manuela Doroana,
5Margarida Lucas,
6Francisco Antunes,
5Rui M. M. Victorino,
1,6and Ana E. Sousa
1*
Instituto de Medicina Molecular, Faculdade de Medicina, Universidade de Lisboa, Av. Prof. Egas Moniz, 1649-028 Lisboa,
Portugal
1; Laborato
´rio de Biologia Molecular, Servic
¸o de Medicina Transfusional, Hospital Egas Moniz, Rua da
Junqueira, 126, 1349-019 Lisboa, Portugal
2; Instituto Superior de Sau
´de Egas Moniz, Quinta da Granja,
Monte de Caparica, 2829-511 Caparica, Portugal
3; CMDT, Instituto Superior de Higiene e Medicina
Tropical, Rua da Junqueira, 96, 1349-008 Lisboa, Portugal
4; Clínica Universita
´ria de Doenc
¸as
Infecciosas e Parasita
´rias, Hospital de Santa Maria, Centro Hospitalar Lisboa Norte,
Av. Prof. Egas Moniz, 1649-028 Lisboa, Portugal
5; and Clínica Universita
´ria de
Medicina 2, Hospital de Santa Maria, Centro Hospitalar Lisboa Norte,
Av. Prof. Egas Moniz, 1649-028 Lisboa, Portugal
6Received 10 September 2010/Accepted 2 December 2010
Viremia is significantly lower in HIV-2 than in HIV-1 infection, irrespective of disease stage.
Never-theless, the comparable proviral DNA burdens observed for these two infections indicate similar numbers
of infected cells. Here we investigated this apparent paradox by assessing cell-associated viral replication.
We found that untreated HIV-1-positive (HIV-1
ⴙ) and HIV-2
ⴙindividuals, matched for CD4 T cell
depletion, exhibited similar gag mRNA levels, indicating that significant viral transcription is occurring
in untreated HIV-2
ⴙpatients, despite the reduced viremia (undetectable to 2.6
ⴛ 10
4RNA copies/ml).
However, tat mRNA transcripts were observed at significantly lower levels in HIV-2
ⴙpatients, suggesting
that the rate of de novo infection is decreased in these patients. Our data also reveal a direct relationship
of gag and tat transcripts with CD4 and CD8 T cell activation, respectively. Antiretroviral therapy
(ART)-treated HIV-2
ⴙpatients showed persistent viral replication, irrespective of plasma viremia,
pos-sibly contributing to the emergence of drug resistance mutations, persistent hyperimmune activation, and
poor CD4 T cell recovery that we observed with these individuals. In conclusion, we provide here evidence
of significant ongoing viral replication in HIV-2
ⴙpatients, further emphasizing the dichotomy between
amount of plasma virus and cell-associated viral burden and stressing the need for antiretroviral trials
and the definition of therapeutic guidelines for HIV-2 infection.
HIV-2 infection is characterized by a low or undetectable
plasma viral load (3, 5, 46, 50, 54), in agreement with its
reduced transmission rate (2, 26, 30), providing a natural
model to investigate the relative contribution of HIV
replica-tion to AIDS progression.
Notwithstanding the two-log difference in viremia levels that
characterize HIV-2 and HIV-1 infection, similar levels of
cell-associated viral DNA have been reported, suggesting a
com-parable number of infected cells (6, 24, 45, 52). This apparent
paradox highlights the potential contribution of quiescent
la-tent virus to proviral load and the relevance of quantifying the
ongoing viral replication. The only study, to our knowledge,
addressing transcriptional activity in HIV-2-positive (HIV-2
⫹)
patients demonstrated lower gag mRNA expression levels in
HIV-2
⫹than in HIV-1
⫹individuals (34). However, the fact
that these cohorts were not paired for disease stage is a
pos-sible confounding factor, as it is known that gag mRNA levels
are increased in HIV-1
⫹individuals with low CD4 T cell
counts (22, 39).
In spite of the much lower rate of CD4 T cell decline in
HIV-2 than in HIV-1 infection (19, 35), a progressive CD4 T
cell depletion, ultimately leading to AIDS, is observed with
HIV-2
⫹individuals (12, 36). Importantly, despite the lack of
clinical trials of antiretroviral therapy (ART) in HIV-2
infec-tion, the majority of reports showed poor immunological
re-covery in ART-treated HIV-2
⫹patients, even in the context of
suppression of viremia (1, 19, 29, 40, 51, 56). A rapid
emer-gence of drug-associated mutations in HIV-2
⫹patients under
ART has also been reported (7, 13–15, 25, 29, 41, 47, 48),
suggesting that there is some ongoing viral replication. There
are no data regarding the impact of ART on HIV-2 proviral
DNA levels and/or HIV-2 transcriptional activity.
We have previously shown that CD4 T cell depletion is
directly related to immune activation but only indirectly to
plasma viral load in both HIV-2 and HIV-1 infections (28, 55).
Here we investigate the relationship of CD4 T cell levels and T
cell activation with cell-associated viral burden, measured in
terms of gag and tat mRNA and proviral DNA levels, in
par-* Corresponding author. Mailing address: Unidade de Imunologia
Clínica, Instituto de Medicina Molecular, Faculdade de Medicina de
Lisboa, Av. Prof. Egas Moniz, 1649-028 Lisboa, Portugal. Phone: 351
21 7999525. Fax: 351 21 7999527. E-mail: [email protected].
† Present address: Department of Molecular Cell Biology and
Im-munology, Vrije University Medical Center, P.O. Box 7057, 1007 MB
Amsterdam, Netherlands.
䌤
Published ahead of print on 15 December 2010.
allel with plasma viremia in cohorts of untreated HIV-2
⫹and
HIV-1
⫹individuals together with a cohort of ART-treated
HIV-2
⫹individuals.
MATERIALS AND METHODS
Studied cohorts.We assessed 45 HIV-2⫹(16 of which were receiving ART) and 27 untreated HIV-1⫹ patients followed at Hospital de Santa Maria in Lisbon, Portugal, as well as 16 HIV-seronegative age-matched controls. None of the patients had ongoing opportunistic infections or tumors. Tables 1 and 2 describe untreated and treated cohorts, respectively. Although HIV-2-infected cohorts included an increased number of women, non-Caucasian, and elderly individuals, in the current study these factors were not found to significantly impact the parameters under analysis (data not shown). All subjects gave in-formed consent for blood sampling and processing. The study was approved by the Ethical Board of the Faculty of Medicine, University of Lisbon.
Cell isolation and flow cytometry. Peripheral blood mononuclear cells (PBMC) were isolated immediately after blood collection and characterized by flow cytometry as previously described (9).
DNA and mRNA extraction.DNA was extracted from 5⫻ 106
PBMC using the QIAamp DNA minikit. For mRNA extraction, 5⫻ 106PBMC were lysed (RLT), homogenized (QIAshredder columns), extracted (Oligotex mRNA direct minikit) (all from Qiagen, Valencia, CA), treated with DNase (DNA-free kit; Ambion, Austin, TX), and immediately converted to cDNA. Samples were quan-tified using a NanoDrop ND-1000 spectrophotometer (NanoDrop technologies, Wilmington, DE).
Viremia and proviral DNA.HIV-1 viremia was quantified by a reverse trans-criptase PCR (RT-PCR) assay with a detection threshold of 40 RNA copies/ml (Roche, Basel, Switzerland). HIV-2 viremia was quantified using a previously described in-house-developed assay with a detection threshold of 200 RNA copies/ml (54). Quantification of viremia in ART-treated individuals with levels below 200 RNA copies/ml was repeated using a more sensitive real-time RT-PCR assay with a detection threshold of 40 RNA copies/ml as described previ-ously (20). HIV-1 and HIV-2 total viral DNA (integrated and nonintegrated viral DNA species) was quantified using real-time PCR assays that amplify highly conserved regions in HIV-1 and HIV-2 gag with a detection range of 7 orders of magnitude and a sensitivity of 5 copies as we have previously described (52). Test cutoff values were used to calculate the median and the correlations with other parameters when levels were below the cutoff.
gag and tat mRNA.Eighty ng of mRNA was reverse transcribed using the Superscript II reverse transcriptase kit (Invitrogen, Carlsbad, CA), and 250 nM random hexamers was quantified in duplicate using cDNA (1g) in a PCR mixture (50l) containing 25 l Platinum quantitative PCR SuperMix-UDG, 1 l ROX reference dye (50⫻), 5 mM MgCl2(all from Invitrogen), and variable concentrations of the following primers and probes: HIV-1 gag F2 (10 pmol/l), GGGAGAATTAGATCGATGGGAAA-3⬘; HIV-1 gag R1 (10 pmol/l), 5⬘-GCTCCCTGCTTGCCCATA-3⬘; HIV-1 gag probe, 5⬘-6-carboxyfluorescein (FAM)-CCCTGGCCTTAACCGAATT-minor groove binder (MGB)-3⬘; HIV-2 gag F2 (10 pmol/l), 5⬘-CGCGAGAAACTCCGTCTTG-3⬘; HIV-2 gag R2 (10 pmol/l), 5⬘-CACACAATATGTTTTAGCCTGTACTTTTT; and probe HIV-2-gag, 5⬘-FAM-CCGGGCCGTAACCT-MGB-3⬘. tat multiply spliced (MS) mRNA expression was quantified using the following primers and probes: HIV-1
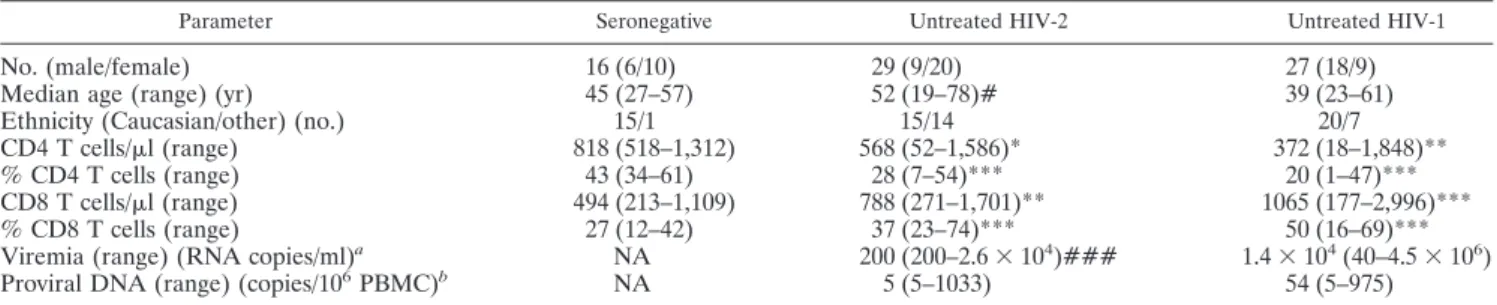
TABLE 1. Characterization of untreated HIV-2
⫹, untreated HIV-1
⫹, and seronegative cohorts
cParameter Seronegative Untreated HIV-2 Untreated HIV-1
No. (male/female)
16 (6/10)
29 (9/20)
27 (18/9)
Median age (range) (yr)
45 (27–57)
52 (19–78)#
39 (23–61)
Ethnicity (Caucasian/other) (no.)
15/1
15/14
20/7
CD4 T cells/
l (range)
818 (518–1,312)
568 (52–1,586)*
372 (18–1,848)**
% CD4 T cells (range)
43 (34–61)
28 (7–54)***
20 (1–47)***
CD8 T cells/
l (range)
494 (213–1,109)
788 (271–1,701)**
1065 (177–2,996)***
% CD8 T cells (range)
27 (12–42)
37 (23–74)***
50 (16–69)***
Viremia (range) (RNA copies/ml)
aNA
200 (200–2.6
⫻ 10
4)###
1.4
⫻ 10
4(40–4.5
⫻ 10
6)
Proviral DNA (range) (copies/10
6PBMC)
bNA
5 (5–1033)
54 (5–975)
a
HIV-2 viremia was below 200 RNA copies/ml (cutoff) in 22 out of 29 patients studied; HIV-1 viremia was below 40 RNA copies/ml (cutoff) in 3 out of 24 patients. b
Proviral DNA was below 5 copies/106
PBMC (cutoff) in 15 out of the 29 HIV-2-infected patients and in 9 out of 24 HIV-1-infected patients investigated. c
NA, not applicable. Values are medians, with limits in brackets. Test cutoff value was used to calculate the median if levels were below cutoff. Significance in comparison to seronegative:ⴱ, P ⬍ 0.05; ⴱⴱ, P ⬍ 0.01; ⴱⴱⴱ, P ⬍ 0.0001. Significance in comparison to HIV-1: #, P ⬍ 0.05; ###, P ⬍ 0.0001.
TABLE 2. Characterization of ART-treated HIV-2
⫹cohorts
aParameter ART HIV-2 aviremic ART HIV-2 viremic ART HIV-2 (all)
No. (male/female)
11 (5/6)
5 (3/2)
16 (8/8)
Median age (range) (yr)
54 (34–62)
53 (31–62)
54 (31–62)
Current ART regimen (no. of patients)
2 NRTI
3
3
2 NRTI
⫹ 1 PI
6
4
10
3 NRTI
2
1
3
Length of follow-up (range) (mo)
Under ART
28 (1–109)
66 (6–120)
58 (1–120)
After HIV diagnosis
65 (8–242)
177 (29–220)
97 (8–242)
CD4 T cells/
l (range)
340 (70–554)
163 (84–719)
302 (70–719)
% CD4 T cells (range)
22 (5–36)
10 (4–23)
20 (4–36)
CD8 T cells/
l (range)
825 (244–1,419)
912 (447–1,532)
887 (244–1,532)
% CD8 T cells (range)
50 (26–64)
53 (49–65)
51 (26–65)
Viremia (RNA copies/ml) (range)
200
4172 (499–34,314)
200 (200–34,314)
Proviral DNA (copies/10
6PBMC) (range)
b108 (5–346)
5 (5–726)
57 (5–726.0)
a
Values are medians, with limits in brackets. Test cutoff value was used to calculate the median if levels were below cutoff. NRTI, nucleoside RT inhibitor; PI, protease inhibitor.
b
Proviral DNA was below 5 copies/106
tat F2.3 (6 pmol/l), 5⬘-GACGAAGAGCTCCTCAAGACA-3⬘; HIV-1 tat R2.4 (6 pmol/l), GAGACAGAGACAGATCCGGTC-3⬘; HIV-1 tat probe, 5⬘-FAM-TCTCTATCAAAGCAACCCGC-MGB-3⬘; HIV-2 tat F3.5 (10 pmol/l), 5⬘-AGGGGCTCGGGATATGTT-3⬘; HIV-2 tat R3.1 (10 pmol/l), 5⬘-TCTGT ATCCACCGTCGTTTC-3⬘; and HIV-2 tat probe, 5⬘-FAM-TGCATCAGACA AATC-MGB-3⬘, in an ABI Prism 7000 SDS (Applied Biosystems, Foster City, CA). Glyceraldehyde-3-phosphate dehydrogenase (GAPDH) was used as an internal control (FAM/MGB probe, nonprimer limited; Applied Biosystems; standard curve with cDNA generated from pooled PBMC from 3 seronegatives). Standard curves for tat were generated using amplifications of synthetic oligo-nucleotides (GenScript Corporation, Piscataway, NJ) corresponding to 200-bp fragments of HIV-1 and HIV-2 tat transcripts, and those for gag were as de-scribed previously (52). The median values and the correlations with other parameters were calculated using the tat- and gag-relative quantification values of patients presenting detectable levels of the transcripts.
HIV-2 sequencing.The in-house methodology was used to sequence a 1,280-bp HIV-2 pol gene fragment, including the entire protease and part of the reverse transcriptase from plasma samples. Viral RNA was retrotranscribed and ampli-fied using the Access RT-PCR core reagents kit (Promega, Madison, WI) and outer primers JA218 ([⫹1859] 5⬘-GAA AGA AGC CCC GCA ACT TCC-3⬘) and JA221 ([⫺3258] 5⬘-GCT CTG CTT CTG CTA ATT CTG TCC A-3⬘) as described previously (54). A nested PCR was performed; a second amplification was carried out using AmpliTaq Gold PCR master mix and the inner primers JA219 [(⫹1898) 5⬘-AGG GGC T(A/G)A CAC CAA CAG CAC-3⬘] and JA220MOD[(⫺3178) 5⬘-GTC TTT ATI CCT GGG TAG AI(T/G) TGT G-3⬘]. Cycle sequencing was accomplished with the BigDye Terminator version 3.1 (v3.1) cycle sequencing kit according to the manufacturer’s recommendations and using four sequencing primers: JA219, JA220 [(⫺3178) 5⬘-GTC TTT AT(T/C) CCT GGG TAG ATT TGT G-3⬘], JA222 ([⫹2525]) 5⬘-ACC TCC AAC TAA TCC TTA TAA TAC C-3⬘), and JA223 ([⫺2625] 5⬘-ACT GAA TTT CTG TGA AAT CTT GAG T-3⬘). Purified products were run on an ABI Prism 3100 genetic analyzer according to the same protocol but were adjusted to HIV-2-specific settings; nucleotide sequences were analyzed with SeqScape soft-ware version 2.5 (all from Applied Biosystems) by alignment with the ROD HIV-2 reference strain (GenBank accession number M15390).
Statistical analysis.Statistical analysis was performed using GraphPad Prism version 5.00 (GraphPad Software, Inc., SD) using the Mann-Whitney test, Spear-man’s coefficient, and Fisher’s exact test. P values of⬍0.05 were considered significant. The test cutoff value was used to calculate the median if levels were below the cutoff.
RESULTS
Ongoing viral replication in untreated HIV-2 infection.
In
order to investigate the degree of ongoing viral replication
during the natural history of HIV-2 and HIV-1 infections, we
compared untreated HIV-2 and HIV-1 cohorts matched for
the degree of CD4 T cell depletion (Table 1), although length
of infection was likely greater in HIV-2
⫹than in HIV-1
⫹individuals. As expected, viremia was significantly lower in
HIV-2 than in HIV-1 infection (3, 5, 46, 50, 54). Twenty-two
out of 29 HIV-2
⫹patients had levels below the test cutoff
(aviremic), and the highest viremia was 2.6
⫻ 10
4RNA
cop-ies/ml (Table 1). Conversely, the proviral DNA loads, as
pre-viously reported, were similar (6, 24, 45, 52), suggesting
com-parable numbers of infected cells in these two groups despite
their distinct viremias (Table 1). Of note, although no
signifi-cant correlation was found between proviral DNA and viremia
in HIV-2 infection, significantly higher proviral levels were
found in viremic than in “aviremic” individuals (P
⫽ 0.0396).
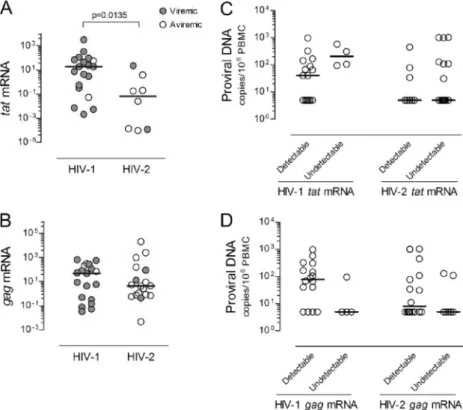
tat mRNA, a multiply spliced (MS) HIV transcript, is thought
to be expressed mainly in recently infected cells and/or cells
ac-tively producing virus (31, 32, 38, 53). We found a significantly
higher number of individuals with undetectable tat mRNA in the
HIV-2 than in the HIV-1 cohort (P
⫽ 0.0014; Fisher’s exact test).
Moreover, HIV-2
⫹patients with detectable tat mRNA featured
significantly lower levels than their HIV-1
⫹ counterparts (Fig.
1A), and a significant correlation with viremia was observed only
with the HIV-1 cohort (r
⫽ 0.4791, P ⫽ 0.0443, n ⫽ 19 for the
HIV-1 cohort; r
⫽ 0.0312, P ⫽ 0.9349, n ⫽ 8 for the HIV-2
cohort). Although no correlation with CD4 T cell levels were
observed (Table 3), individuals with low CD4 T cell counts tended
to have higher levels of tat mRNA (see Fig. 1 posted at http://www
.imm.fm.ul.pt/dl/SoaresEtAlSupplementalFigure1AndLegend
.pdf).
Conversely, gag mRNA, an unspliced (US) HIV transcript,
was similarly expressed in the HIV-1 and HIV-2 cohorts (Fig.
1B), which included an equal number of individuals with
un-detectable expression levels. Of note, no correlation with
vire-mia was found for either infection.
Furthermore, on comparing viremic and aviremic HIV-2
⫹individuals, we observed no significant differences between the
number of patients with detectable tat and gag mRNA
tran-scripts, and we found similar levels of expression of tat and gag
mRNA (Fig. 1A and B), although these results should be
interpreted cautiously, given the small number of individuals
assessed.
A low ratio of gag to tat mRNA levels has been suggested as
a marker of active viral transcription and of HIV-1 disease
progression (22, 37, 49). We found a significantly higher
gag-to-tat ratio in HIV-2
⫹than in HIV-1
⫹patients (P
⫽ 0.0118),
although no association with viremia was found in either
co-hort.
Of note, neither tat nor gag mRNA expression levels nor the
gag-to-tat ratio significantly correlated with the proviral DNA
load in either HIV cohort. Moreover, when we subdivided the
HIV-1 and HIV-2 cohorts on the basis of detectable and
un-detectable viral mRNA, no differences in proviral DNA levels
were observed (Fig. 1C and D). Thus, no direct relationship
appears to exist between the number of infected cells, as
esti-mated by proviral DNA, and the levels of tat and gag
transcrip-tion in PBMC during untreated HIV-2 and HIV-1 infectranscrip-tions,
suggesting a significant contribution of archived viral DNA.
Overall, HIV-2
⫹individuals exhibited reduced levels of tat
and similar levels of gag transcripts compared to their HIV-1
⫹counterparts, translating into a higher gag-to-tat mRNA ratio
in the former.
Relationship of plasma and cell-associated viral load with
CD4 T cell depletion and T cell activation in HIV-2 infection.
We have previously shown that T cell activation markers were
similarly upregulated in HIV-1 and HIV-2 infections when
patients were matched for CD4 T cell levels, suggesting that
CD4 T cell depletion is more directly linked to immune
acti-vation than to viral load (28, 55). Here, we assessed the
rela-tionship between cell-associated viral mRNA and DNA and
the hyperimmune activation observed for HIV-2 and HIV-1
infections.
With respect to gag mRNA expression, we found a direct
correlation with the levels of HLA-DR expression (Table 3)
and HLA-DR and CD38 coexpression (r
⫽ 0.5150; P ⫽ 0.0287)
within CD4 T cells in HIV-2
⫹individuals; this correlation did
not reach statistical significance in HIV-1
⫹individuals. No
correlations were found with CD8 T cell activation levels
(Ta-ble 3).
Conversely, we observed that the levels of tat mRNA in
HIV-1
⫹individuals directly correlated with CD8 T cell
activa-tion levels, measured either as the proporactiva-tion of HLA-DR
⫹CD38
⫹(Table 3) or CD38
⫹cells (r
⫽ 0.6196; P ⫽ 0.0047), as
well as CD38 mean fluorescence intensity (MFI; r
⫽ 0.7386;
P
⫽ 0.0003). Clear trends for an association between tat
mRNA levels and CD8 T cell activation were also observed
with the HIV-2 cohort, but no significant correlations were
found with CD4 T cell activation in either infection (Table 3).
Of note, proviral DNA levels did not directly correlate with
either CD4 or CD8 T cell activation in HIV-1
⫹and HIV-2
⫹individuals (Table 3), further suggesting that a significant
com-ponent comprises archived quiescent virus.
In spite of the narrow range of HIV-2 viremia (undetectable
to 26,263 copies/ml), significant positive correlations were
found between viremia and several T cell activation markers
(Table 3) (percentage of HLA-DR
⫹CD38
⫹within CD4 T
cells: r
⫽ 0.5685, P ⫽ 0.0013; percentage and MFI of CD38
within CD8 T cells: r
⫽ 0.6196, P ⫽ 0.0047, and r ⫽ 0.5330, P ⫽
FIG. 1. tat and gag mRNA expression and proviral DNA levels in untreated HIV-2 and HIV-1 infections. Graphs show the expression of tat
(A) and gag (B) (as arbitrary units) relative to GAPDH in those individuals with detectable levels of these transcripts, from a total of 25 HIV-2
⫹and 23 HIV-1
⫹individuals evaluated. Open symbols refer to patients with viremia below the cutoff of the test, and closed symbols to patients with
detectable viremia. Proviral DNA levels were compared for untreated HIV-2
⫹(25 of 25) and HIV-1
⫹(20 of 23) individuals with detectable and
undetectable tat (C) and gag (D) mRNA transcripts. Bars represent medians.
TABLE 3. Correlations between virological parameters and levels of CD4 T cells and immune activation in
untreated HIV-2 and HIV-1 infections
Viremia, DNA,
or transcript Virus type
r; Pa
% CD4 T cells CD4 T cells/l % HLA-DR⫹in
CD4 T cells
% HLA-DR⫹38⫹in CD8 T cells
Viremia
HIV-2
⫺0.3097; 0.1021
ⴚ0.3943; 0.0343
0.5186
; 0.0039
0.5288
; 0.0032
HIV-1
ⴚ0.6120; 0.0009
ⴚ0.5810; 0.0019
0.4731
; 0.0146
0.7140
; <0.0001
Proviral DNA
HIV-2
0.0313; 0.8719
0.1555; 0.4207
0.2281; 0.2339
0.1029; 0.5952
HIV-1
0.0652; 0.7621
⫺0.1019; 0.6358
0.0005; 0.9983
0.1590; 0.4580
tat mRNA
HIV-2
⫺0.5952; 0.1323
⫺0.5238; 0.1966
0.6190; 0.1017
0.6667; 0.0831
HIV-1
⫺0.3737; 0.1150
⫺0.3193; 0.1827
0.2825; 0.2413
0.5404
; 0.0169
gag mRNA
HIV-2
ⴚ0.5728; 0.0130
⫺0.3870; 0.1126
0.4985
; 0.0353
0.3189; 0.1971
HIV-1
0.2281; 0.3477
0.1869; 0.4435
⫺0.4018; 0.0882
⫺0.4193; 0.0739
a
Test cutoff values were used to calculate the correlations with viremia or proviral DNA, if levels were below the cutoff. Correlations with viral mRNA were calculated using the tat and gag relative quantification values of patients presenting detectable levels of the transcripts (8 and 18 in HIV-2, respectively, and 19 for both tat and gag in HIV-1). Statistically significant correlations are represented in bold.
0.0029, respectively). In order to further assess the relative
contribution of viremia, we compared viremic and aviremic
HIV-2
⫹individuals (Table 1). Although the former showed
significantly higher CD4 and CD8 T cell activation than the
latter (Fig. 2A and B), both viremic and aviremic HIV-2
⫹individuals had significantly higher levels of T cell activation
than seronegatives did (Fig. 2A and B) and exhibited strong
negative correlations between CD4 T cell numbers and CD4
and CD8 T cell activation levels (Fig. 2C and D).
Overall, our data not only demonstrated that T cell
activa-tion was strongly associated with CD4 T cell depleactiva-tion, both in
viremic and aviremic HIV-2
⫹individuals, but also supported a
contribution, even at low levels, of circulating virus to both
CD4 and CD8 T cell activation. Moreover, we showed that gag
mRNA was directly related to CD4 T cell activation and tat
mRNA to CD8 T cell activation, suggesting an overall impact
of viral transcripts upon T cell activation.
Cell-associated viral mRNA and DNA in HIV-2
ⴙpatients
under ART.
In order to further dissect the impact of
cell-associated viral DNA and RNA upon HIV-2
immunopatho-genesis, we assessed these parameters in patients receiving
ART (Table 2). This cohort exhibited significantly lower CD4
T cell counts than untreated HIV-2
⫹individuals did (P
⫽
0.0046), in agreement with previous reports showing a limited
CD4 T cell recovery in ART-treated HIV-2 infection (1, 19, 29,
40, 51, 56). Viremia levels were similar in the treated and
untreated HIV-2 cohorts, due to the low-level viremia detected
in some of the ART-treated HIV-2
⫹patients (Table 2).
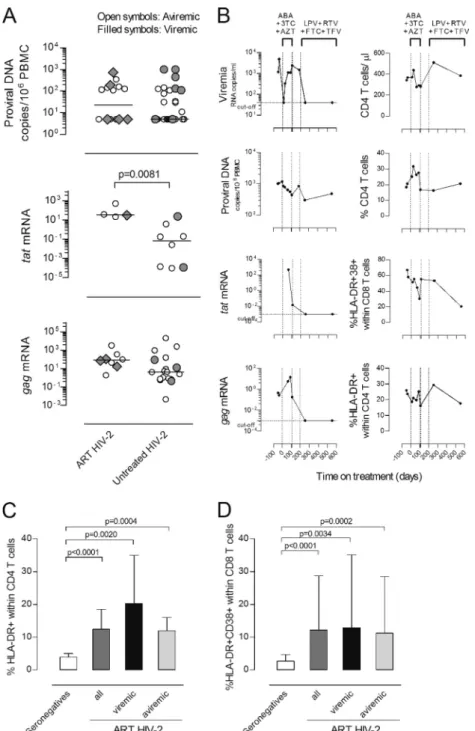
Of note, in contrast with the progressive decline in proviral
DNA levels usually observed with ART-treated HIV-1
⫹pa-tients (23, 58), proviral DNA did not significantly differ
be-tween untreated and treated HIV-2
⫹patients (Fig. 3A),
de-spite the prolonged treatment. Moreover, treated and
untreated HIV-2 patients featured similar levels of gag mRNA
expression, whereas tat expression was significantly higher in
the treated cohort, although the reduced number of individuals
with detectable tat transcripts preclude a definitive
interpreta-tion (Fig. 3A). No significant differences were found between
the number of patients with detectable tat and gag mRNA
transcripts within treated and untreated groups. These results
FIG. 2. Relationship between viremia, absolute CD4 T cell numbers, and T cell activation in untreated HIV-2 infection. Proportion of CD4 T
cells expressing HLA-DR (A) and CD8 T cells coexpressing HLA-DR and CD38 (B) in seronegative individuals (white bars) and untreated HIV-2
patients (dark gray bars). HIV-2 patients were further stratified into viremic (black bars) and aviremic groups (light gray bars). Bars represent
median
⫾ interquartile range. Correlations between CD4 T cell depletion and proportion of cells expressing HLA-DR within the CD4 T cell subset
(C) and proportion of CD8 T cells coexpressing HLA-DR and CD38 (D).
FIG. 3. Impact of ART on HIV-2 plasma and cell-associated viral load, CD4 T cell frequency, and T cell activation. (A) Levels of proviral DNA
and tat and gag mRNA (expressed as arbitrary units) were compared in untreated and ART-treated HIV-2
⫹individuals. Open symbols represent
patients with viremia below the cutoff of the test, and closed symbols patients with detectable viremia. Bars represent medians. (B) Longitudinal
study of a representative ART-treated HIV-2
⫹patient. Day 0 was defined as the therapy initiation date. The vertical dashed lines indicate the
periods under specific ART regimens (ABC, abacavir; 3TC, lamivudine; AZT, zidovudine; LPV, lopinavir; RTV, ritonavir; FTC, emtricitabine;
TDF, tenofovir). Mutations in protease (PR) and reverse transcriptase (RT) were analyzed before therapy (day
⫺37) and after the first ART
regimen (day 108). Mutations [amino acid changes] found before therapy (day
⫺37) were, in PR, Y14H, N40S, N41D, N68G, K69[K, R], and K70R
and, in RT, D17[E, D], W24[G, W], K28R, C38[W, C], K43[K, R], K64R, L74V, K82R, D123G, P126Q, H162Y, V167I, K176S, H228D, W235[G,
C, W], and Q245E. Mutations found after first therapy (day 108) were, in PR, Y14H, N40S, N41D, N68G, K69R, and K70R and, in RT, K28R,
K43[K, R], K64R, W71R, L74I, K82R, T88[T, P], H96[H, P], G99[A, G], D123G, P126[Q, P], I159[I, L], H162Y, V167I, K176S, M184V, I187[I,
L], and L209[P, L]. Proportion of CD4 T cells expressing HLA-DR (C) and CD8 T cells coexpressing HLA-DR and CD38 (D) in seronegative
individuals (white bars) and ART-treated HIV-2
⫹individuals (dark gray bars). HIV-2
⫹patients were further stratified into viremic (black bars)
and aviremic groups (light gray bars). Bars represent median
⫾ interquartile range.
showed significant amounts of ongoing viral replication in
ART-treated HIV-2 infection, suggesting a limited
effective-ness of the ART regimens in HIV-2 infection, which justifies
further exploration in large cohorts treated with optimized
ART regimens.
Additionally, neither the amount of gag and tat transcripts
nor proviral DNA significantly differed between treated HIV-2
patients with detectable and undetectable viremia (Fig. 3A),
emphasizing that the absence of detectable viremia is not a
good surrogate marker for cell-associated viral mRNA and/or
DNA during HIV-2 infection.
A rapid emergence of mutations potentially associated with
drug resistance has been reported for HIV-2
⫹patients under
ART (25, 29, 41). We confirmed the presence of mutations in
the reverse transcriptase and protease in our ART-treated
HIV-2 cohort (Table 4). These data further support the
pres-ence of significant amounts of ongoing replication in these
ART-treated HIV-2
⫹patients, leading us to speculate about
the potential contribution of ART-induced selective pressure
upon the virus to the increased tat transcript levels (Fig. 3).
The selection of adequate ART regimens to treat HIV-2
infection is difficult given the lack of clinical trials. There are
currently some phenotypic studies that allow the selection of
better first-line therapies than those used a few years ago (16,
61), but the knowledge of HIV-2 resistance pathways is still
incomplete. Longitudinal data of an individual HIV-2
⫹pa-tient, in whom the initial ART regimen was associated with the
rapid emergence of mutations and virological failure,
illus-trated that switching to another ART combination was
associ-ated with viremia suppression and a decline of cell-associassoci-ated
viral burden (Fig. 3B). This was supported by both a loss of
measurable tat and gag transcripts and a decrease in the levels
of proviral DNA, both of which are indicative of a successful
virological response. Nevertheless, this patient’s
immunologi-cal response was limited, with only marginal CD4 T cell
recov-ery and a partial decrease in both CD4 and CD8 T cell immune
activation (Fig. 3B), suggesting that factors other than viral
replication are contributing to the poor immunological
recon-stitution. Our findings support a role for persistent immune
activation, given that, as shown in Fig. 3C and D, ART-treated
HIV-2
⫹individuals exhibited significantly higher levels of T
cell activation than seronegatives did, similar levels of CD4 and
CD8 T cell activation in comparison with the untreated HIV-2
cohort, and significant negative correlations between absolute
CD4 T cell numbers and the percentages of HLA-DR
⫹within
CD4 T cells (r
⫽ ⫺0.5147; P ⫽ 0.0413) and HLA-DR
⫹CD38
⫹within CD8 T cells (r
⫽ ⫺0.5294; P ⫽ 0.0350).
Overall, significant amounts of ongoing viral replication
were observed with HIV-2-infected patients under ART,
high-lighting the importance of additional studies of antiretroviral
TABLE 4. Virological parameters and CD4 T cell levels of HIV-2
⫹patients under ART
dCase
no. Current ART regimen
Follow-up after HIV diagnosis/ under ART (mo)a CD4 T pre-ART; post-ART (cells/l)a
Mutations Viremia (RNA copies/ml) Proviral DNA (copies/106 PBMC) tat mRNA (arbitrary units) gag mRNA (arbitrary units)
1
d4T
⫹ 3TC ⫹ SQV/r
b177/108
300; 719
NA
4,172
5
Undet
1.07
⫻ 10
22
AZT/3TC/ABC
63/63
138; 554
NA
⬍40
5
Undet
9.82
⫻ 10
13
AZT/3TC
26/26
457; 535
PR
⫹ RT
c⬍40
5
2.13
⫻ 10
1Undet
4
AZT/3TC
b206/64
500; 520
NA
44
158
Undet
Undet
5
AZT/3TC
⫹ LPV/r
126/26
125; 457
NA
⬍40
114
Undet
3.56
⫻ 10
26
AZT/3TC
⫹ LPV/r
38/28
164; 406
NA
⬍40
108
Undet
4.46
⫻ 10
17
AZT/3TC/ABC
242/61
287; 340
PR
⫹ RT
c191
5
ND
ND
8
AZT/3TC
⫹ SQV/r
8/5
222; 326
NA
⬍40
145
Undet
Undet
9
AZT/3TC
⫹ NFV
b29/4
143; 277
PR
⫹ RT
c499
5
3.14
⫻ 10
11.72
⫻ 10
110
AZT/3TC
15/1
297; 273
NA
⬍40
126
Undet
Undet
11
AZT/3TC
⫹ IDV/r
65/51
112; 251
NA
⬍40
346
5.19
⫻ 10
21.91
12
AZT/3TC/ABC
220/56
176; 163
PR
⫹ RT
c742
187
Undet
7.25
⫻ 10
113
AZT/3TC
⫹ IDV
b218/6
121; 102
PR
⫹ RT
c⬍40
5
3.73
⫻ 10
13.30
⫻ 10
314
d4T
⫹ 3TC ⫹ SQV/r
b177/120
82; 87
NA
34,314
726
ND
ND
15
AZT/3TC
⫹ LPV/r
b67/12
120; 84
PR
⫹ RT
c10,474
5
Undet
Undet
16
ABC/FTC
⫹ LPV/r
b216/7
128; 70
NA
⬍40
5
Undet
Undet
a
ART refers to the current therapy. b
Previous ART regimens included the following: case 1, AZT, ddI, ddC; case 4, ddC, d4T; case 9, ddI, EFV; case 13, d4T; case 14, AZT, ddI; case 15, ddI, d4T, NFV; case 16, AZT.
c
The following mutations (amino acid change) were found (those mutations previously associated with drug resistance are in bold). Case 3: for PR, P19S, N61D, E65K, L99F; for RT, V5L, K9R, I10V, M11T, E44关K, R, E, G兴, K68G, R72关K, R兴, K82R, D86E, Q91关Q, P兴, P126Q, H162Y, V167I, K173R, K176Q, I179T, E197G, R200K, Y227F, H228Q. Case 7: for PR, Y14关H, Y兴, N40S, N61D, E65关K, R兴, K70R; for RT, M11T, E44关E, D兴, K82R, P126Q, H162Y, V167I, K176Q, M184V, D218关E, D兴, E219D, D224关N, D兴, P226关P, S兴, H228Q, W239关G, W兴, Q245H, L246W, Q248L, E250D, I251T, K259N, N265I, W266G. Case 9: for PR, E21D, N40S, T56关T, A兴,
V62关A, V兴, K70R, V71I, L99F; for RT, V5I, M11T, D17关E, D兴, P51S, D76V, F77L, R78G, E79K, P126Q, S134A, V167I, K176P, I180L, M184V, H228Q, E250G, I251V,
K259N, N265I. Case 12: for PR, Y14H, N40S, N41关N, D兴, I46关I, V兴, N61关N, D兴, E65R, D79E; for RT, K9R, I10V, M11T, R22K, K35R, K40R, P51S, K70Q, D86E, R104关K, R兴, V111I, P126Q, S134A, V167I, K176P, I180关I, L兴, M184V, S215Y, F221L, D224N, H228Q. Case 13: PR, Y14H, N40S, E65R, K70R, F85L, I89V, L90 M; for RT, A3V, V5M, I10V, M11R, K43R, T53S, T58S, T60关T, P兴, T88关T, P兴, P126Q, A138T, V167I, A174T, K176P, I180L, M184V, H228Q, K243关K, R兴. Case 15: for PR, K7R, V10I, V22I, V33I, E37D, N40S, I54 M, T56V, N68G, K70R, V71I, M76L, I82F, I89关I, V兴, T91A, G94关S, G兴; for RT, P1关P, L兴, V5关I, V兴, I10关I, V兴, D17关N, D兴, E48关E, G兴, A62关A, V兴, K64关K, R兴, K65关K, R兴, A101P, P126Q, P126Q, V135A, Q151M, H162Y, V167I, K176P, I180L, M184V, I189L, V201A, F214L, D218关K, N,
E, D兴, E219关E, D兴, H228K, V254F. d
ND, not done; Undet, undetectable mRNA expression; NA, no amplification; ART, antiretroviral therapy; reverse transcriptase (RT) inhibitors: AZT, zidovudine; 3TC, lamivudine; ABC, abacavir; d4T, stavudine; ddC, zalcitabine; ddI, didanosine; EFV, efavirenz; FTC, emtricitabine; r, ritonavir. Protease (PR) inhibitors: LPV, lopinavir; IDV, indinavir; NFV, nelfinavir; SQV, saquinavir.
drug efficacy in HIV-2 infection. Furthermore, ART
appar-ently failed to have a significant impact on T cell activation,
even in patients with undetectable viremia, possibly
contribut-ing to their low CD4 T cell recovery.
DISCUSSION
Here we demonstrated that untreated HIV-1
⫹and HIV-2
⫹individuals with similar degrees of CD4 T cell depletion
fea-tured similar levels of gag mRNA transcripts, suggesting that
significant viral transcription occurs in HIV-2 patients, despite
the lower viremia. Conversely, we found decreased levels of tat
mRNA in untreated HIV-2
⫹individuals. Given the previous
reports demonstrating that HIV-1 tat mRNA transcripts
accu-mulate and outnumber gag mRNA transcripts in recently
in-fected cells (31, 32, 38, 53), our results provide evidence for a
decreased rate of de novo cell infection in HIV-2 disease.
Proviral DNA levels have been used to estimate the extent
of viral reservoirs (8, 10, 11, 18). We and others have shown
that the levels of total proviral DNA are similar in the two HIV
infections despite the reduced viremia observed with HIV-2
⫹individuals (6, 45, 52). This may result from a preferential
contribution of latently infected, quiescent T cells to total
HIV-2 proviral DNA. Alternatively, a significant amount of
ongoing viral replication occurs, but it does not translate into
plasma viral load. In this study, we showed that the levels of
proviral DNA were not associated with viral transcription
lev-els in HIV-1
⫹or in HIV-2
⫹individuals, bringing into question
the reliability of proviral DNA levels as a marker of replicative
activity in both infections.
Additionally, the impact of plasma and cell-associated viral
load upon HIV-2-associated hyperimmune activation was
in-vestigated. Of note, significantly higher levels of CD4 and CD8
T cell activation were found in viremic individuals than in
aviremic individuals, despite the small amount of circulating
virus observed with viremic HIV-2
⫹patients. In agreement
with a recent report on an African cohort (33), our data
sup-port a contribution of plasma viral load, even at low levels, to
immune activation, which may be related to transmission of
cell free viruses and/or immunological effects of viral proteins.
The direct association between gag mRNA and CD4 T cell
activation that we observed with HIV-infected patients raises
the possibility that ongoing viral replication significantly
con-tributes to the maintenance of heightened T cell activation in
HIV-2
⫹individuals in spite of the reduced viremia. In
addi-tion, the direct association found between tat mRNA levels
and CD8 T cell activation, particularly in HIV-1
⫹individuals,
suggests a specific role of this transactivator molecule and/or
newly infected cells in driving CD8 T cell activation.
With respect to HIV-1 infection, those rare (
⬍0.1%)
indi-viduals who are able to control viral replication in the absence
of ART (27, 42, 44, 60) provide another valuable resource for
the investigation of factors associated with viremia control.
Various criteria have been used to define this population,
including viremia ranging from undetectable (elite controllers)
up to 2,000 RNA copies/ml (viremic controllers) (42, 60).
No-tably, the small cohort of HIV-1 controllers within our
un-treated HIV-1 cohort resembles the unun-treated HIV-2 cohort in
terms of viremia, gag and tat mRNA expression, gag-to-tat
ratio, and proviral DNA levels. The seven individuals with
viremia of
⬍2,000 RNA copies/ml tended to have lower levels
of tat mRNA (14.59
⫾ 14.47 arbitrary units) than the other
HIV-1
⫹patients did (262.0
⫾ 210.4 arbitrary units), though
the levels did not reach statistical significance. The numbers of
patients with detectable tat mRNA, gag mRNA, and proviral
DNA were similar within these subgroups of the HIV-1 cohort,
and no differences in gag mRNA levels or proviral DNA were
observed, but the gag-to-tat ratio was higher in controllers (P
⫽
0.0434). These data further support that viremia control is
associated with reduced levels of tat transcripts.
Finally, we provide evidence of persistent HIV-2 replication
during ART, based on proviral DNA and gag and tat mRNA
levels, irrespective of detectable plasma viremia. We also
dem-onstrated drug-related genetic evolution of HIV-2 reverse
transcriptase and protease gene sequences. The high levels of
tat mRNA observed with the ART-treated HIV-2 cohort
sug-gested that the therapeutic regimens used were unable to
re-duce the rate of de novo cell infection. These data contrast with
those for ART-treated HIV-1
⫹patients, in which virological
response is usually associated with a sharp decline in MS
mRNA (4, 21, 62) and in the proportion of MS mRNA relative
to US mRNA in PBMC (57), as well as with a progressive
decrease in proviral DNA (23, 58, 59) despite the low-level
viremia that can frequently be detected using ultrasensitive
assays (17, 43).
In agreement with previous reports (1, 19, 29, 40, 51), we
documented poor CD4 T cell recovery in ART-treated HIV-2
⫹individuals, even in those with evidence of viral suppression. Our
findings suggest that persistent hyperimmune activation may be a
main determinant of this impaired immune reconstitution. The
study of lymphoid tissue from HIV-2-infected patients will be
instrumental in evaluating the degree of irreversible damage
as-sociated with long-term infection that may limit the potential for
immune recovery and providing support for an early start of ART
in this otherwise relatively benign disease.
In conclusion, we provide here evidence of ongoing viral
replication in HIV-2 infection despite the low or undetectable
viremia and of its association with CD4 and CD8 T cell activation,
with the latter being more closely related to the levels of tat
mRNA. Of particular note was the persistent viral replication in
ART-treated HIV-2
⫹individuals. In light of these findings,
par-ticularly the apparent ease with which the virus mutated in treated
HIV-2
⫹individuals to escape drug activity, there is an obvious
need for large-scale drug trials for HIV-2 infection to determine
the most appropriate drug regimen and also the benefit of an
early initiation of therapy for this infection.
ACKNOWLEDGMENTS
We thank Sara Sousa and Luis Franc
¸a from the Clínica Universita
´ria
de Doenc
¸as Infecciosas da Faculdade de Medicina da Universidade de
Lisboa, as well as Luis Pinheiro from the Clínica Universita
´ria de
Medicina 2 from the Hospital Universita
´rio de Santa Maria for
col-laboration in the collection of clinical data or patient follow-up and
Nuno Taveira for helpful discussions.
This study was funded by grants from Fundac
¸a
˜o para a Cie
ˆncia e a
Tecnologia (FCT) and Programa Operacional Cie
ˆncia e Inovac
¸a
˜o 2010
(POCI2010), as well as from Fundac
¸a
˜o Calouste Gulbenkian, to A.E.S.
A.P.B. received a scholarship from GlaxoSmithKline, and R.S.S., R.T.,
R.B.F., and R.C. a scholarship from FCT.
REFERENCES
1. Adje-Toure, C. A., et al. 2003. Antiretroviral therapy in HIV-2-infected patients: changes in plasma viral load, CD4⫹ cell counts, and drug resistance profiles of patients treated in Abidjan, Cote d’Ivoire. AIDS 17(Suppl. 3): S49–S54.
2. Adjorlolo-Johnson, G., et al. 1994. Prospective comparison of mother-to-child transmission of HIV-1 and HIV-2 in Abidjan, Ivory Coast. JAMA
272:462–466.
3. Andersson, S., et al. 2000. Plasma viral load in HIV-1 and HIV-2 singly and dually infected individuals in Guinea-Bissau, West Africa: significantly lower plasma virus set point in HIV-2 infection than in HIV-1 infection. Arch. Intern. Med. 160:3286–3293.
4. Bagnarelli, P., et al. 1996. Dynamics and modulation of human immunode-ficiency virus type 1 transcripts in vitro and in vivo. J. Virol. 70:7603–7613. 5. Berry, N., et al. 1998. Low peripheral blood viral HIV-2 RNA in individuals with high CD4 percentage differentiates HIV-2 from HIV-1 infection. J. Hum. Virol. 1:457–468.
6. Berry, N., et al. 1994. HIV type 2 proviral load measured by quantitative polymerase chain reaction correlates with CD4⫹ lymphopenia in HIV type 2-infected individuals. AIDS Res. Hum. Retroviruses 10:1031–1037. 7. Brandin, E., et al. 2003. pol gene sequence variation in Swedish HIV-2 patients
failing antiretroviral therapy. AIDS Res. Hum. Retroviruses 19:543–550. 8. Brenchley, J. M., et al. 2004. T-cell subsets that harbor human
immunode-ficiency virus (HIV) in vivo: implications for HIV pathogenesis. J. Virol.
78:1160–1168.
9. Cavaleiro, R., et al. 2009. Major depletion of plasmacytoid dendritic cells in HIV-2 infection, an attenuated form of HIV disease. PLoS Pathog.
5:e1000667.
10. Chun, T. W., et al. 1997. Quantification of latent tissue reservoirs and total body viral load in HIV-1 infection. Nature 387:183–188.
11. Chun, T. W., et al. 1997. Presence of an inducible HIV-1 latent reservoir during highly active antiretroviral therapy. Proc. Natl. Acad. Sci. U. S. A.
94:13193–13197.
12. Clavel, F., et al. 1987. Human immunodeficiency virus type 2 infection associated with AIDS in West Africa. N. Engl. J. Med. 316:1180–1185. 13. Colson, P., et al. 2005. Polymorphism and drug-selected mutations in the
reverse transcriptase gene of HIV-2 from patients living in southeastern France. J. Med. Virol. 75:381–390.
14. Colson, P., et al. 2004. Polymorphism and drug-selected mutations in the protease gene of human immunodeficiency virus type 2 from patients living in Southern France. J. Clin. Microbiol. 42:570–577.
15. Damond, F., et al. 2005. Polymorphism of the human immunodeficiency virus type 2 (HIV-2) protease gene and selection of drug resistance muta-tions in HIV-2-infected patients treated with protease inhibitors. J. Clin. Microbiol. 43:484–487.
16. Desbois, D., et al. 2008. In vitro phenotypic susceptibility of human immu-nodeficiency virus type 2 clinical isolates to protease inhibitors. Antimicrob. Agents Chemother. 52:1545–1548.
17. Dinoso, J. B., et al. 2009. Treatment intensification does not reduce residual HIV-1 viremia in patients on highly active antiretroviral therapy. Proc. Natl. Acad. Sci. U. S. A. 106:9403–9408.
18. Douek, D. C., et al. 2002. HIV preferentially infects HIV-specific CD4⫹ T cells. Nature 417:95–98.
19. Drylewicz, J., et al. 2008. Comparison of viro-immunological marker changes between HIV-1 and HIV-2-infected patients in France. AIDS 22:457–468. 20. Ferns, R. B., and J. A. Garson. 2006. Development and evaluation of a
real-time RT-PCR assay for quantification of cell-free human immunodefi-ciency virus type 2 using a Brome Mosaic Virus internal control. J. Virol. Methods 135:102–108.
21. Fischer, M., et al. 2008. Biphasic decay kinetics suggest progressive slowing in turnover of latently HIV-1 infected cells during antiretroviral therapy. Retrovirology 5:107.
22. Furtado, M. R., L. A. Kingsley, and S. M. Wolinsky. 1995. Changes in the viral mRNA expression pattern correlate with a rapid rate of CD4⫹ T-cell number decline in human immunodeficiency virus type 1-infected individu-als. J. Virol. 69:2092–2100.
23. Garrigue, I., et al. 2000. Cell-associated HIV-1-DNA quantitation after highly active antiretroviral therapy-treated primary infection in patients with persistently undetectable plasma HIV-1 RNA. AIDS 14:2851–2855. 24. Gomes, P., et al. 1999. Quantitation of human immunodeficiency virus type
2 DNA in peripheral blood mononuclear cells by using a quantitative-com-petitive PCR assay. J. Clin. Microbiol. 37:453–456.
25. Gottlieb, G. S., et al. 2009. Emergence of multiclass drug-resistance in HIV-2 in antiretroviral-treated individuals in Senegal: implications for HIV-2 treat-ment in resouce-limited West Africa. Clin. Infect. Dis. 48:476–483. 26. Gottlieb, G. S., et al. 2006. Lower levels of HIV RNA in semen in HIV-2
compared with HIV-1 infection: implications for differences in transmission. AIDS 20:895–900.
27. Grabar, S., et al. 2009. Prevalence and comparative characteristics of long-term nonprogressors and HIV controller patients in the French Hospital Database on HIV. AIDS 23:1163–1169.
28. Grossman, Z., M. Meier-Schellersheim, A. E. Sousa, R. M. Victorino, and
W. E. Paul.2002. CD4⫹ T-cell depletion in HIV infection: are we closer to
understanding the cause? Nat. Med. 8:319–323.
29. Jallow, S., et al. 2009. Virological response to highly active antiretroviral therapy (HAART) in HIV-2 and HIV-1/HIV-2 dually infected patients in the Gambia and the emergence of drug-resistant variants. J. Clin. Microbiol.
47:2200–2208.
30. Kanki, P. J., et al. 1994. Slower heterosexual spread of HIV-2 than HIV-1. Lancet 343:943–946.
31. Kim, S. Y., R. Byrn, J. Groopman, and D. Baltimore. 1989. Temporal aspects of DNA and RNA synthesis during human immunodeficiency virus infection: evidence for differential gene expression. J. Virol. 63:3708–3713. 32. Klotman, M. E., et al. 1991. Kinetics of expression of multiply spliced RNA
in early human immunodeficiency virus type 1 infection of lymphocytes and monocytes. Proc. Natl. Acad. Sci. U. S. A. 88:5011–5015.
33. Leligdowicz, A., et al. 2010. Direct relationship between virus load and systemic immune activation in HIV-2 infection. J. Infect. Dis. 201:114–122. 34. MacNeil, A., et al. 2007. Direct evidence of lower viral replication rates in vivo in human immunodeficiency virus type 2 (HIV-2) infection than in HIV-1 infection. J. Virol. 81:5325–5330.
35. Marlink, R., et al. 1994. Reduced rate of disease development after HIV-2 infection as compared to HIV-1. Science 265:1587–1590.
36. Matheron, S., et al. 2003. Factors associated with clinical progression in HIV-2 infected-patients: the French ANRS cohort. AIDS 17:2593–2601. 37. Michael, N. L., et al. 1995. Human immunodeficiency virus type 1 cellular
RNA load and splicing patterns predict disease progression in a longitudi-nally studied cohort. J. Virol. 69:1868–1877.
38. Michael, N. L., et al. 1991. Induction of human immunodeficiency virus type 1 expression in chronically infected cells is associated primarily with a shift in RNA splicing patterns. J. Virol. 65:1291–1303.
39. Michael, N. L., M. Vahey, D. S. Burke, and R. R. Redfield. 1992. Viral DNA and mRNA expression correlate with the stage of human immunodeficiency virus (HIV) type 1 infection in humans: evidence for viral replication in all stages of HIV disease. J. Virol. 66:310–316.
40. Mullins, C., et al. 2004. Highly active antiretroviral therapy and viral re-sponse in HIV type 2 infection. Clin. Infect. Dis. 38:1771–1779.
41. Ntemgwa, M. L., T. d’Aquin Toni, B. G. Brenner, R. J. Camacho, and M. A.
Wainberg.2009. Antiretroviral drug resistance in human immunodeficiency virus type 2. Antimicrob. Agents Chemother. 53:3611–3619.
42. Okulicz, J. F., et al. 2009. Clinical outcomes of elite controllers, viremic controllers, and long-term nonprogressors in the US Department of Defense HIV natural history study. J. Infect. Dis. 200:1714–1723.
43. Palmer, S., et al. 2008. Low-level viremia persists for at least 7 years in patients on suppressive antiretroviral therapy. Proc. Natl. Acad. Sci. U. S. A.
105:3879–3884.
44. Pereyra, F., et al. 2009. Persistent low-level viremia in HIV-1 elite controllers and relationship to immunologic parameters. J. Infect. Dis. 200:984–990. 45. Popper, S. J., et al. 2000. Low plasma human immunodeficiency virus type 2
viral load is independent of proviral load: low virus production in vivo. J. Virol. 74:1554–1557.
46. Popper, S. J., et al. 1999. Lower human immunodeficiency virus (HIV) type 2 viral load reflects the difference in pathogenicity of HIV-1 and HIV-2. J. Infect. Dis. 180:1116–1121.
47. Rode´s, B., et al.2000. Emergence of drug resistance mutations in human immunodeficiency virus type 2-infected subjects undergoing antiretroviral therapy. J. Clin. Microbiol. 38:1370–1374.
48. Ruelle, J., et al. 2008. Transmitted drug resistance, selection of resistance mutations and moderate antiretroviral efficacy in HIV-2: analysis of the HIV-2 Belgium and Luxembourg database. BMC Infect. Dis. 8:21. 49. Seshamma, T., O. Bagasra, D. Trono, D. Baltimore, and R. J. Pomerantz.
1992. Blocked early-stage latency in the peripheral blood cells of certain individuals infected with human immunodeficiency virus type 1. Proc. Natl. Acad. Sci. U. S. A. 89:10663–10667.
50. Simon, F., et al. 1993. Cellular and plasma viral load in patients infected with HIV-2. AIDS 7:1411–1417.
51. Smith, N. A., et al. 2001. Antiretroviral therapy for HIV-2 infected patients. J. Infect. 42:126–133.
52. Soares, R., et al. 2006. Increased frequency of circulating CCR5⫹ CD4⫹ T cells in human immunodeficiency virus type 2 infection. J. Virol. 80:12425– 12429.
53. Sonza, S., et al. 2002. Selectively reduced tat mRNA heralds the decline in productive human immunodeficiency virus type 1 infection in monocyte-derived macrophages. J. Virol. 76:12611–12621.
54. Soriano, V., et al. 2000. Human immunodeficiency virus type 2 (HIV-2) in Portugal: clinical spectrum, circulating subtypes, virus isolation, and plasma viral load. J. Med. Virol. 61:111–116.
55. Sousa, A. E., J. Carneiro, M. Meier-Schellersheim, Z. Grossman, and R. M.
Victorino.2002. CD4 T cell depletion is linked directly to immune activation in the pathogenesis of HIV-1 and HIV-2 but only indirectly to the viral load. J. Immunol. 169:3400–3406.
response to different antiretroviral regimens in a cohort of HIV-2-infected patients. AIDS 17(Suppl. 3):S55–S61.
57. Vesanen, M., M. Markowitz, Y. Cao, D. D. Ho, and K. Saksela. 1997. Human immunodeficiency virus type-1 mRNA splicing pattern in infected persons is determined by the proportion of newly infected cells. Virology
236:104–109.
58. Viard, J. P., et al. 2004. Impact of 5 years of maximally successful highly active antiretroviral therapy on CD4 cell count and HIV-1 DNA level. AIDS
18:45–49.
59. Vitone, F., D. Gibellini, P. Schiavone, and M. C. Re. 2005. Quantitative DNA
proviral detection in HIV-1 patients treated with antiretroviral therapy. J. Clin. Virol. 33:194–200.
60. Walker, B. D. 2007. Elite control of HIV infection: implications for vaccines and treatment. Top. HIV Med. 15:134–136.
61. Witvrouw, M., et al. 2004. Susceptibility of HIV-2, SIV and SHIV to various anti-HIV-1 compounds: implications for treatment and postexposure pro-phylaxis. Antivir. Ther. 9:57–65.
62. Zanchetta, M., et al. 2006. Long-term decay of the HIV-1 reservoir in HIV-1-infected children treated with highly active antiretroviral therapy. J. Infect. Dis. 193:1718–1727.