1. Coimbra Nursing School, Coimbra, Portugal
2. Rheumatology Department, Coimbra University Hospital, Coimbra, Portugal
3. Academic and Clinical Unit for Musculoskeletal Nursing, Leeds Institute of Rheumatic and Musculoskeletal Medicine, University of Leeds, Leeds, United Kingdom
Cross-cultural validation of the portuguese version of
the Educational Needs Assessment Tool (PORTENAT)
ACTA REUMATOL PORT. 2015;40:242-253
AbstrAct
Objectives: To undertake a cross-cultural adaptation
and validation of the educational needs assessment tool (ENAT) into Portuguese.
Methods: The first phase of this research
(cross-cultu-ral adaptation) utilised a well-established translation method comprising five sequential steps: forward--translation, synthesis of translations, backforward--translation, expert committee and field-testing of the adapted ver-sion. The second phase involved collecting data from 123 patients and subjecting them to Rasch analysis for validity testing including cross-cultural invariance.
Results: The translation and field-testing phase went
smoothly giving rise to minor adjustments in the phra-sing of some items. The preliminary analysis of the 39 items, revealed some deviations from the model with the overall item-person interaction fit statistics 2(df) = 56.025 (39), p = 0.038. Significant item-item correla-tions caused artificial inflation of the internal consis-tency, therefore violating the model assumption of lo-cal independence of items. To correct this, all lolo-cally dependent items were then grouped into their respec-tive domains, creating a 7 testlet-scale which demons-trated a good fit to the Rasch model, 2(df) = 2.625 (7), p = 0.917 and internal consistency PSI = 0.975. Ana-lysis of the pooled (Portuguese and the English) data re-vealed cross-cultural DIF, requiring adjustments in two testlets: ‘treatments’ and ‘support’ which ensured cross--cultural equivalence.
Conclusions: This study confirms the Portuguese
ENAT is a robust unidimensional tool with which to
Cruz A1, Machado P2, Hill J3, Campos M2, Apóstolo J1, Marques A2,
Malcata A2, Ndosi M3
assess the educational needs of Portuguese people with RA. Cross-cultural adjustments are required only if the data from Portugal and the UK are pooled or compa-red. The tool is now available for use in clinical practi-ce and research.
Keywords: Patient Education; Self-management;
Rheumatoid Arthritis; Cross-cultural adaptation; Tool validation.
IntroductIon
People with arthritis want to know more about their arthritis and the best way to manage it in their daily li-ves1,2. In the face of well-entrenched arthritis myths and
insufficient social marketing or public awareness cam-paigns, patient education (PE) and self-management programs are important, particularly given the subs-tantial and increasing burden of arthritis on health-care resources and society3.
PE plays a particularly important role in the mana-gement of the patients with Rheumatoid Arthritis (RA)4
and usually begins when a person is first diagnosed. It can be both an illuminating and frustrating process, not only for the patients but also for their family, friends, co-workers and employers, and Health Professionals.
A Cochrane review in 2003 cast some doubts on the effectiveness of PE on health status in RA5. However,
most studies in the review did not take into account the appropriateness of interventions at different stages of the patient’s adjustment to their RA, which is unsur-prising as a literature search found no tool that could be used for this purpose.
PE is a multi-dimensional process encompassing pa-tients’ beliefs, provider factors, and content and deli-very methods, all of which complicate the choice of outcome measures and the assessment of effects. Over
the past 10 years PE has advanced and newer studies suggest that PE is based on patients’ needs and indivi-dual learning capabilities6,7. This view has been
reflec-ted in recent RCTs which have been more specific in their methods and some long-term effects have been found8.
The Educational Needs Assessment Tool (ENAT)9
was developed as a quick and simple method of col-lecting data that ensures that patient education is rele-vant, appropriate and timely for the individual. The tool is a self-completed questionnaire comprising 39 items in 7 domains:
1. Managing pain – individual medications, using heat/cold, distraction, relaxation, exercise, acu-puncture, hydrotherapy.
2..Movement – practical devices, lifting, energy con-servation, rest/sleep, joint protection.
3. Feelings – dealing with stress, moods/depression, fa-tigue.
4. Arthritis process – cause, type of arthritis, heredity, treatments, disability, future.
5. Treatments - need for medication, how to take it, side effects, reason for blood tests, X-rays, surgery, ap-pliances.
6. Self-help measures – alternative therapy, vitamins, what to avoid doing, home exercises, how much exercise, when to contact a doctor or a nurse. 7. Support systems - helpful organisations, financial
help, coping groups, getting the most out of con-sultations.
Patients score the items by ticking 5-point Likert scales ranging from ’not at all important‘ to ’extreme-ly important‘. There is also a front sheet for collecting demographic data and a space for patients to add any topics/questions that are not included in the ques-tionnaire. It takes the patient only a few minutes to complete and provides data that enables the health professional to provide timely and meaningful educa-tion and informaeduca-tion that is pertinent to each indivi-dual patient.
The ENAT was developed in the United Kingdom and was shown to be reliable (test/retest: ICC=0.823; p<0.01), valid and acceptable to patients who also commented on its ease of completion9,10. Rasch
analy-sis of the English version demonstrated its unidimen-sionality, reliability and robustness – working in the same way across different patient groups10,11. The
ENAT’s measurement properties suggest that it can also be used as a research tool to accurately assess educa-tional interventions12-14. The aim of this study was to
translate the ENAT into Portuguese (PortENAT) and to assess its cross-cultural validity in RA by using Rasch analysis.
Methods
PArtIcIPAnts
Participants were patients with RA attending the Rheu-matology Department Outpatients Clinic at Coimbra University Hospital, in Coimbra, Portugal. The inclu-sion criteria were age >18 years, diagnosis of RA and ability to complete the questionnaire unaided. Exclu-sion criteria were (i) having any other rheumatic di-sease such as systemic lupus erythematosus, systemic sclerosis, psoriatic arthritis, ankylosing spondylitis and osteoarthritis, (ii) inability to read or write and (iii) tho-se unwilling to participate. Participation was volunta-ry and ethical approval was obtained from Coimbra University Hospital Ethics Committee.
Procedure
The study design was cross-sectional and followed standardised guidelines for cross-cultural adaptation and validation of patient-reported outcome measu-res15,16. It was undertaken in two phases: (i)
cross-cul-tural adaptation into Portuguese and (ii) validation of the adapted ENAT (PortENAT) using Rasch analysis.
PhAse 1: cross-culturAl AdAPtAtIon Into Portuguese:
The ENAT was translated into Portuguese using an es-tablished process for cross-cultural adaptation of pa-tient reported outcome measures15. It comprises five
stages: initial translation, synthesis of these translations, back translation, expert committee assessment and field-testing.
I
NITIAL TRANSLATIONThe first stage in adaptation was a ‘forward translation’ from English (source language) into Portuguese (the tar-get language), carried out by two independent transla-tors whose mother tongue was Portuguese. The first translator was a professional bilingual translator (FA) and the second was a bilingual lay person (CA). The two translations were then compared, and discrepancies such as ambiguous wording in the original language, or discrepancies in how a word is translated were identi-fied. Poor wording choices were discussed and resol-ved. The two translators each produced a written report
(T1 and T2)15of their translation. Comments were
in-cluded to highlight challenging phrases or uncertain-ties along with the rationale for final choices.
S
YNTHESIS OF THESE TRANSLATIONSTo produce a synthesis of the two translations, a third, unbiased person was added to the team (MP). The role of this person was to serve as a mediator in the dis-cussion of translation differences, and to produce a written documentation of the process. Working from the original questionnaire, as well as from the first (T1) and the second translator’s (T2) version, a synthesis of these translations was produced, resulting in one com-mon translation (T-12). A written report documenting the process, the issues addressed and how they were resolved was completed.
B
ACK-
TRANSLATIONWorking from the T-12 version of the ENAT, and to-tally blind to the original version, the questionnaire was then translated back into English by two bilingual back-translators (FA and CA), with English as their mother tongue, producing translations BT1 and BT2. This is a process of validity checking to make sure the translated version accurately reflects the item content of the original version.
E
XPERT COMMITTEEThe composition of the expert committee included a methodologist (HJ), health professionals (MA), all the translators (both forward and backward) and the trans-lation synthesis recorder. The original developer of the questionnaire was also included. The expert commit-tee consolidated all the versions and components of the questionnaire and all translated versions (T1, T2, T12, BT1, BT2), and a final version of the ENAT was produced for field testing.
T
EST OF THE ADAPTED VERSIONThe field test of the adapted ENAT comprised 30 RA patients who completed the questionnaire unaided. They were then interviewed to probe what they thought was meant by each questionnaire item and their response. Both the meaning of the items and res-ponses were explored. This ensured that the adapted version retained its equivalence. The distribution of responses was examined to look for a high proportion of missing items or single responses. Once completed, the questionnaires were summarised and analysed des-criptively using the IBM SPSS software version 1917.
PhAse 2: VAlIdAtIon of the AdAPted enAt by rAsch AnAlysIs
The final translated version of the ENAT, the Por tENAT was then completed by a consecutive sample of 123 patients with RA fulfilling the inclusion criteria. They were asked to return it at the end of the clinic consul-tation. The resultant questionnaires were entered into a database and prepared for analysis.
dAtA AnAlysIs
The measurement properties of the PortENAT were tested by Rasch analysis using the Masters Partial Cre-dit Model parameterisation18in RUMM202019
softwa-re. Rasch analysis is a mathematical modelling techni-que used to assess properties of outcome measures against a measurement model developed by the Da-nish mathematician Georg Rasch20. The observed data
from the adapted PortENAT were measured against the model to assess their goodness of fit, with ‘good fit’ in-dicating a criterion-related construct validity, reliabi-lity and statistical sufficiency21-23. For the model fit, the
observed value for the residuals of each item is expec-ted to lie within lie within ±2.5, and to have a mean of zero and standard deviation of one. The overall fit sta-tistics are given in terms of a c2 (item-person) interac-tion and its associated probability, which is expected to be non-significant (i.e. not deviating from the Rasch model). A more detailed description of the Rasch ana-lysis approach, its use in rheumatology and the inter-pretation of fit statistics is given elsewhere24.
For this analysis, the data from PortENAT were as-sessed for threshold ordering, individual item-fit and the assumption of local dependence of items. In addi-tion, we tested the overall (item-person interaction) fit, internal consistency and the strict assessment of unidimensionality. Lastly, invariance to age, gender, di-sease duration and education background were asses-sed. Local dependency was defined as item-item cor-relation of greater than ±0.325. The locally dependent
items were subsequently combined into subscales and each subscale treated as a ’testlet‘, which is defined as a subset of items that is treated as a measurement unit in test construction, administration and/or scoring26.
Strict unidimensionality of the PortENAT was asses-sed by using the independent t-test method suggested by Smith27. The internal reliability was reported using
Person Separation Index (PSI), which provides the es-timate of the internal consistency of the scale.24In
or-der to avoid type I errors resulting from to multiple testing28all p-values for fit statistics were
Bonferroni-C
ROSS-
CULTURAL VALIDATION PHASEAssessment of the response structure in the 39 items, revealed ordered thresholds in most items, indicating that the 5-point category response structure (not at all important, a little important, fairly important, very im-portant and extremely imim-portant) was working as ex-pected. This structure did not work well in few (6/39) items where patients failed to distinguish between ‘a little important’ and ‘fairly important’.
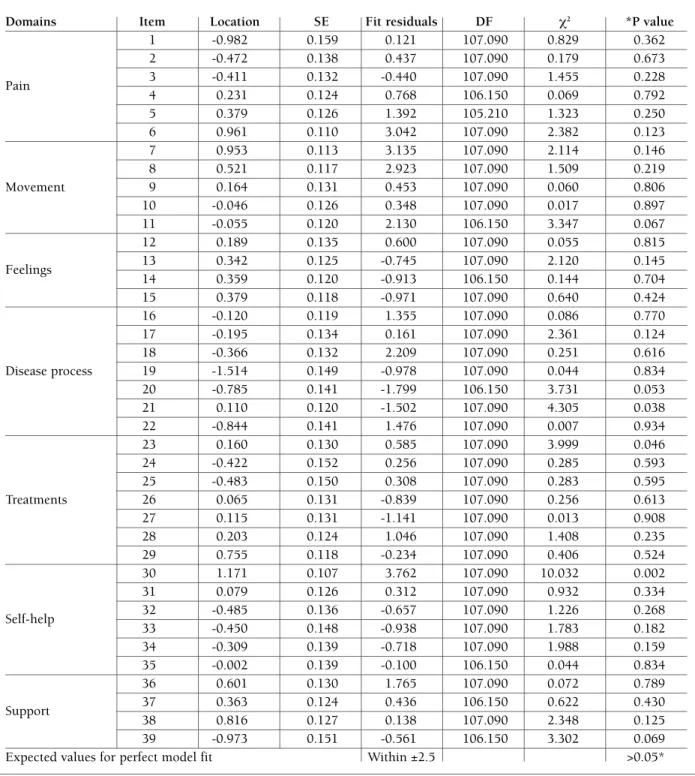
The overall scale (39 items) had an excellent inter-nal consistency (Cronbach’s Alpha = 0.973). The test of fit revealed that 35/39 items residuals were within the expected (2.5) range. All items had a non-signifi-cant Bonferroni-adjusted Chi-square probability, indi-cating fit to the model (Table II).
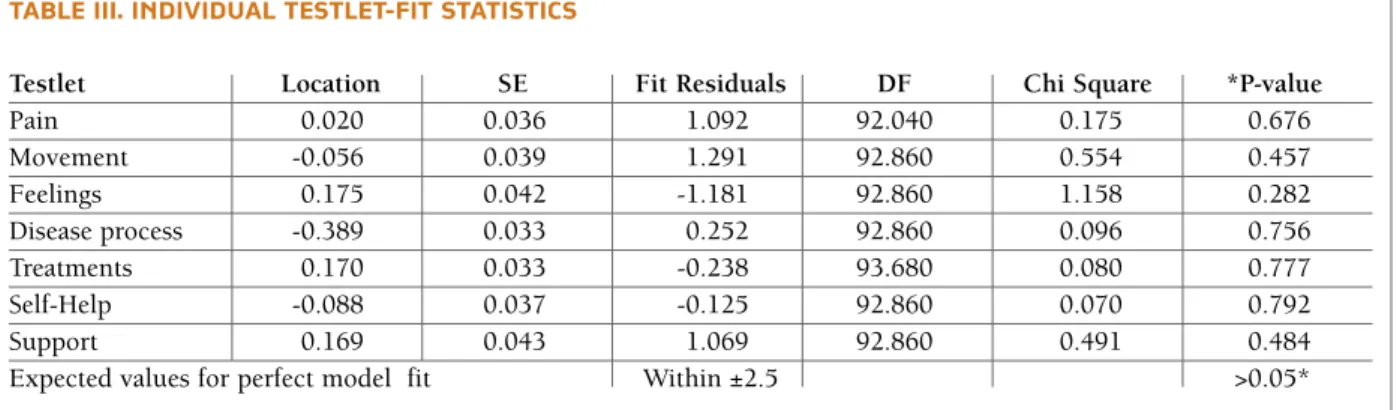
While item-trait Chi-square statistics in table II sug-gested most of the 39 items fit the Rasch model; an as-sessment of the residual correlation matrix revealed significant item-item correlations (>0.3) indicating lo-cal dependency, which is a violation of the Rasch mo-del. These locally dependent items were combined into 7 corresponding domains and the ENAT was re-ana-lysed as a 7-testlet scale, resulting in acceptable fit to Rasch model expectations (Table III).
Table IV presents the results of a further test of fit, taking account of person ability (item-person interac-tion) suggesting initial (39 items) scale deviation from the Rasch model c2(df) = 56.025 (39), p = 0.038; PSI = 0.985 (Table IV, analysis 1) and subsequent fit to the Rasch model following correction for the local depen-dence (Table IV analysis 2). Analysis 1 is the prelimi-nary analysis of the 39 items and analysis 2 is the ana-lysis of the 7-testlet ENAT (having combined indivi--adjusted to the alpha level (i.e. p = 0.05/number of
tests carried out). The expected values for perfect mo-del fit are presented at the bottom of tables of results. A questionnaire item is required to measure the trait of interest across different groups of people without bias. When people from different groups (age, gender, educational background) with the same level of latent trait have a different probability of giving a certain res-ponse on a questionnaire item, the item is said to dis-play a differential item functioning (DIF)29. DIF was
assessed using the inbuilt facility within RUMM2020 software, which uses a 2-way ANOVA of the person--item deviation residuals with person factors (e.g. age group, country of origin) and class intervals (group along the trait) as factors. Cross-cultural invariance is a requirement for questionnaires intended for multi-national use30,31.The original UK dataset for RA was
pooled with the Portuguese data to assess if PortENAT had retained its construct validity following its trans-lation from the original (English) ENAT. The pooled dataset was also assessed for fit, local dependence and DIF by culture (cross-cultural DIF).
results
PAtIent chArActerIstIcs
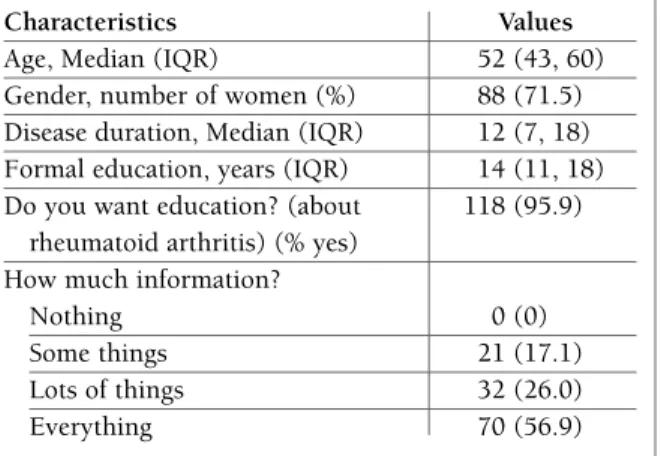
A total of 153 Portuguese patients were recruited in to this study, 30 for the cross-cultural adaptation phase and 123 for the cross-cultural validation phase. Of the 30 pa-tients in the adaptation phase, 9 (30%) were male and 21 (70%) women. Their mean age was 51.3 years (range 23, 72) and disease duration 13.9 years (range 2, 35). The characteristics of patients in the validation phase are sum-marised in table I. Most of the respondents had a mini-mum of 11 years of formal education. Those with pri-mary school education 53 (43.1%), secondary education 28 (22.8%) and university education were 33 (26.8%).
A
DAPTATION INTOP
ORTUGUESEIn the translation of the ENAT, there were some minor difficulties associated with two items, one in the ‘fee-lings’ domain and the other in the ‘arthritis process’ domain. These were solved in the expert committee meeting carried out by all the translators and health professionals. In the pilot testing, the adapted version was well accepted by patients and minor changes in the treatment domain were needed – ‘appliances’ was changed to ‘devices or appliances’. No additional ques-tions were necessary.
tAble I. chArActerIstIcs of Included PAtIents for VAlIdAtIon PhAse
Characteristics Values
Age, Median (IQR) 52 (43, 60)
Gender, number of women (%) 88 (71.5)
Disease duration, Median (IQR) 12 (7, 18) Formal education, years (IQR) 14 (11, 18) Do you want education? (about 118 (95.9)
rheumatoid arthritis) (% yes) How much information?
Nothing 0 (0)
Some things 21 (17.1)
Lots of things 32 (26.0)
dual items into their respective domains. The ‘testlet’ solution resulted in an improved scale with better fit statistics c2(df) = 2.625 (7), p = 0.917 and internal consistency PSI = 0.975. To allow for cross-cultural
in-variance analysis, the Portugal dataset was pooled to-gether with the original UK dataset and analysed in the same procedure described above (Table IV, analysis 1 and analysis 2).
tAble II. IteM test-of-fIt VAlues
Domains Item Location SE Fit residuals DF χ2 *P value
1 -0.982 0.159 0.121 107.090 0.829 0.362 2 -0.472 0.138 0.437 107.090 0.179 0.673 Pain 3 -0.411 0.132 -0.440 107.090 1.455 0.228 4 0.231 0.124 0.768 106.150 0.069 0.792 5 0.379 0.126 1.392 105.210 1.323 0.250 6 0.961 0.110 3.042 107.090 2.382 0.123 7 0.953 0.113 3.135 107.090 2.114 0.146 8 0.521 0.117 2.923 107.090 1.509 0.219 Movement 9 0.164 0.131 0.453 107.090 0.060 0.806 10 -0.046 0.126 0.348 107.090 0.017 0.897 11 -0.055 0.120 2.130 106.150 3.347 0.067 12 0.189 0.135 0.600 107.090 0.055 0.815 Feelings 13 0.342 0.125 -0.745 107.090 2.120 0.145 14 0.359 0.120 -0.913 106.150 0.144 0.704 15 0.379 0.118 -0.971 107.090 0.640 0.424 16 -0.120 0.119 1.355 107.090 0.086 0.770 17 -0.195 0.134 0.161 107.090 2.361 0.124 18 -0.366 0.132 2.209 107.090 0.251 0.616 Disease process 19 -1.514 0.149 -0.978 107.090 0.044 0.834 20 -0.785 0.141 -1.799 106.150 3.731 0.053 21 0.110 0.120 -1.502 107.090 4.305 0.038 22 -0.844 0.141 1.476 107.090 0.007 0.934 23 0.160 0.130 0.585 107.090 3.999 0.046 24 -0.422 0.152 0.256 107.090 0.285 0.593 25 -0.483 0.150 0.308 107.090 0.283 0.595 Treatments 26 0.065 0.131 -0.839 107.090 0.256 0.613 27 0.115 0.131 -1.141 107.090 0.013 0.908 28 0.203 0.124 1.046 107.090 1.408 0.235 29 0.755 0.118 -0.234 107.090 0.406 0.524 30 1.171 0.107 3.762 107.090 10.032 0.002 31 0.079 0.126 0.312 107.090 0.932 0.334 Self-help 32 -0.485 0.136 -0.657 107.090 1.226 0.268 33 -0.450 0.148 -0.938 107.090 1.783 0.182 34 -0.309 0.139 -0.718 107.090 1.988 0.159 35 -0.002 0.139 -0.100 106.150 0.044 0.834 36 0.601 0.130 1.765 107.090 0.072 0.789 Support 37 0.363 0.124 0.436 106.150 0.622 0.430 38 0.816 0.127 0.138 107.090 2.348 0.125 39 -0.973 0.151 -0.561 106.150 3.302 0.069
Expected values for perfect model fit Within ±2.5 >0.05*
The pooled dataset was invariant (no DIF) to age, gender, disease duration and educational background. Cross-cultural non-invariance (DIF by culture) was pre-sent on two testlets, ‘treatments’ and ‘support’ where the Portugal dataset was consistently under-discrimi-nating and over-discrimiunder-discrimi-nating in the latter (Figure 1). While the PortENAT works with no bias when used in Portugal, adjustment for the cross-cultural bias is required if the data from Portugal are pooled or compared with the UK data. Crosscultural DIF adjust -ments were undertaken resulting in the ‘adjusted con-version chart’ (Table V). The concon-version chart helps to transform the raw data, which are at ordinal level into interval-level data allowing more flexible statistical analyses and also provides equivalence of measure-ments when comparing the data from Portugal and the UK.
dIscussIon
This study used standardised methods for cross-cul-tural adaptation of outcome measures to develop a Por-tuguese version of the ENAT (PortENAT). The adap-tation into Portuguese was seamless, needing no sig-nificant changes. The translated version (PortENAT) was well received by patients. Rasch analysis demons-trated that the construct validity and its measurement properties were maintained after adaptation process. Indeed the tool worked without bias across different groups (gender, age groups, disease duration and edu-cational backgrounds). However there was DIF on some items, which is not uncommon in patient-re-ported outcome measures,11,32,33and adjustment for
this is required (using the provided conversion table) in order to ensure accurate estimates when data is com-tAble III. IndIVIduAl testlet-fIt stAtIstIcs
Testlet Location SE Fit Residuals DF Chi Square *P-value
Pain 0.020 0.036 1.092 92.040 0.175 0.676 Movement -0.056 0.039 1.291 92.860 0.554 0.457 Feelings 0.175 0.042 -1.181 92.860 1.158 0.282 Disease process -0.389 0.033 0.252 92.860 0.096 0.756 Treatments 0.170 0.033 -0.238 93.680 0.080 0.777 Self-Help -0.088 0.037 -0.125 92.860 0.070 0.792 Support 0.169 0.043 1.069 92.860 0.491 0.484
Expected values for perfect model fit Within ±2.5 >0.05*
DF, degrees of freedom; SE, standard error, *Bonferroni adjusted p-value >0.0071 for model fit (i.e. 0.05/7 tests)
tAble IV. results of rAsch AnAlysIs
Item Fit Person Fit Chi-Square Independent
Residual Residual Interaction T-Tests
Country Analysis Mean SD Mean SD Value (DF) p-value* PSI N (95% CI)
Portugal Analysis 1 0.426 1.355 -0.515 2.624 56.025 (39) 0.038 0.985 114 Analysis 2 0.309 0.901 -0.449 1.337 2.625 (7) 0.917 0.975 114 0.105 (0.065, 0.145) UK Analysis 1 0.340 1.686 -0.269 1.008 71.281 (39) 0.001 0.972 119 Analysis 2 0.541 0.699 -0.308 1.168 7.116 (7) 0.417 0.947 119 0.068 (0.028, 0.107) Pooled Analysis 1 0.607 2.188 -0.486 2.472 275.635 (117) <0.001 0.980 233 Analysis 2 0.481 1.137 -0.457 1.352 19.824 (21) 0.532 0.961 233 0.065 (0.037, 0.093) DIF Adjusted analysis 0.468 1.033 -0.450 1.353 15.860 (27) 0.956 0.962 233
Expected values 0 1 0 1 >0.05 >0.85 Lower bound CI
for perfect fit <0.05
SD, standard deviation; DF, degrees of freedom; *p-value >0.5 for model fit; PSI, person separation index; Analysis 1, preliminary analysis with 39 items; Analysis 2, analysis of testlets
Expected value
Person Location (logits)
Item: Treatments [ST05] – 7 Levels for Person Factor: COUNTRY
0.0-25.010.0-101215.020.025.0Max info=0.000.5UKPortugal
Expected value
Person Location (logits)
Item: Support [ST07] – 7 Levels for Person Factor: COUNTRY
-2-1012 16.015.014.013.011.010.09.08.07.06.05.04.03.02.01.0012.0Max info=0.000.5UKPortugal Ex pe ct ed v al ue
Person Location (logits)
Item: Treatments [ST05] – 7 Levels for Person Factor: COUNTRY
0.0 -2 5.0 10.0 -1 0 1 2 15.0 20.0 25.0 Max info=0.00 0.5 UKPortugal Ex pe ct ed v al ue
Person Location (logits)
Item: Support [ST07] – 7 Levels for Person Factor: COUNTRY
-2 -1 0 1 2 16.0 15.0 14.0 13.0 11.0 10.0 9.0 8.0 7.0 6.0 5.0 4.0 3.0 2.0 1.0 0 12.0 Max info=0.00 0.5 UK Portugal
fIgure 1. Item characteristic curve displaying cross-cultural DIF in ‘treatments’ and ‘support’
tAble V. conVersIon chArt Adjusted for cross-culturAl dIf
Rasch transformed scores
Raw Arthritis UK Support Support
scores Pain Movement Feelings Treatments Treatments Portugal Self-Help UK Portugal
0.0 0.0 0.0 0.0 0.0 0.0 0.0 0.0 0.0 0.0 1.0 1.1 2.0 1.3 0.8 2.4 0.9 0.6 1.4 1.7 2.0 1.9 3.4 2.2 1.5 4.1 1.5 1.2 2.4 3.0 3.0 2.5 4.4 2.9 2.0 5.3 2.0 1.7 3.3 3.9 4.0 2.8 5.3 3.5 2.4 6.3 2.3 2.3 3.9 4.5 5.0 3.5 6.0 4.1 2.8 7.0 2.6 2.6 4.6 5.2 6.0 4.1 6.8 4.6 3.2 7.7 3.1 3.0 5.3 5.8 7.0 4.5 7.4 5.2 3.6 8.4 3.4 3.6 6.1 6.4 8.0 5.0 8.2 5.8 4.0 9.1 3.6 4.0 7.1 7.0 9.0 5.5 9.0 6.5 4.4 9.8 4.1 4.5 8.1 7.6 10.0 6.1 9.8 7.3 4.8 10.4 4.4 5.1 9.1 8.3 11.0 6.9 10.6 8.2 5.4 11.1 4.9 5.9 10.0 9.0 12.0 7.9 11.4 9.2 6.0 11.8 5.3 7.4 10.9 9.8 13.0 9.2 12.2 10.2 7.0 12.5 5.7 9.4 11.8 10.8 14.0 10.6 13.0 11.6 8.6 13.3 6.5 11.2 12.8 12.0 15.0 11.9 13.8 13.4 10.4 14.0 7.5 12.9 14.2 13.7 16.0 13.2 14.5 16.0 12.3 14.7 8.7 14.3 16.0 16.0 17.0 14.3 15.4 14.1 15.5 9.9 15.5 18.0 15.3 16.5 15.7 16.2 11.2 16.5 19.0 16.3 17.9 17.0 17.0 12.5 17.4 20.0 17.3 20.0 18.2 17.7 13.8 18.4 21.0 18.4 19.2 18.5 15.0 19.4 22.0 19.7 20.1 19.2 16.3 20.6 23.0 21.6 21.0 20.0 17.5 22.1 24.0 24.0 22.0 20.9 18.9 24.0 25.0 23.0 22.0 20.3 26.0 24.4 23.2 22.0 27.0 26.0 25.1 24.6 28.0 28.0 28.0 28.0
pared or pooled30,34.
This research has validated the PortENAT in RA, and it can now be used with confidence in the clinical practice or in patient education research. In the clini-cal practice, the clinicians can use it as a template to as-sess patients’ perception of their priority educational needs and it does not require any scoring. Patients completing the ENAT have expressed how it enables them to identify needs which they would not have other wise considered10,35. The clinician using the ENAT
can then provide the education taking into account of patient’s perceived needs. This enables the provided education to be relevant and likely to be more mea-ningful to patients. The use of PortENAT for research or audit purposes ensures accurate estimation of the educational needs of patients with RA. The instruc-tions of how the PortENAT is used and scored, is pro-vided in the online supplementary material. The tool can be obtained by writing to the Psychometric Labo-ratory at the University of Leeds: http://www.leeds.ac.uk/ medicine/rehabmed/psychometric/index1.htm
The main limitations to this research is that the data were collected from one rheumatology centre in Por-tugal and further cross-cultural validation may be re-quired if PortENAT is to be used in other Portuguese speaking countries. Secondly, inevitably, the ENAT items do not cover everything that is known about RA and future developments will address this limitation by creating item banking for computerised adaptive as-sessment, which will ensure more and ‘dynamic’ items delivered according to need.
A gold standard translation process has been used to develop a Portuguese version of the Educational Needs Assessment Tool – PortENAT. Rasch analysis has confirmed that PortENAT is a robust, 7-subscale measure of educational needs for people with RA in Portugal. PortENAT can be used with confidence in Portugal and cross-cultural comparisons can be un-dertaken using the calibrated scales.
corresPondence to
Arménio Cruz
Rua Dr Paulo Quintela, 257, 1º P, 3030-393 Coimbra
Portugal
E-mail: [email protected]
references
1. Badley EM, Gignac MA, Moore L, et al. An Education Needs As-sessment: Findings From Surveys Of Patients and Caregivers. Arthritis and Rheumatism 2013;65(10 Suppl):S1219-S19. 2. Meesters J, de Boer I, van den Berg M, et al. Unmet information
needs about the delivery of rheumatology health care services: A survey among patients with rheumatoid arthritis. Patient Education and Counseling 2011;85(2):299-303.
3. Yannis A, Paraskevi VV, Alexandros AD. Incidence and Preva-lence of Rheumatoid Arthritis, Based on the 1987 American College of Rheumatology Criteria: A Systematic Review. Semi-nars in arthritis and rheumatism 2006;36(3):182-188. 4. Combe B, Landewe R, Lukas C, et al. EULAR
recommenda-tions for the management of early arthritis: report of a task for-ce of the European Standing Committee for International Cli-nical Studies Including Therapeutics (ESCISIT). Annals of the rheumatic diseases 2007;66(1):34-45.
5. Riemsma RP, Kirwan JR, Taal E, et al. Patient education for adults with rheumatoid arthritis. Cochrane Database Syst Rev 2003(2):CD003688.
6. Makelainen P, Vehvilainen-Julkunen K, Pietila AM. Rheuma-toid arthritis patients’ education - contents and methods. J Clin Nurs 2007;16(11C):258-267.
7. Ackerman IN, Buchbinder R, Osborne RH. Factors limiting participation in arthritis self-management programmes: an ex-ploration of barriers and patient preferences within a rando-mized controlled trial. Rheumatology 2013;52(3):472-479. 8. Gronning K, Rannestad T, Skomsvoll JF, et al. Long‚ term effects
of a nurse‚ led group and individual patient education pro-gramme for patients with chronic inflammatory polyarthri-tis‚Äìa randomised controlled trial. Journal of Clinical Nursing 2013.
9. Hardware B, Anne Lacey E, Shewan J. Towards the develop-ment of a tool to assess educational needs in patients with arth-ritis. Clinical Effectiveness in Nursing 2004;8(2):111-117. 10. Hill J, Tennant A, Adebajo A. Further development of an
edu-cational needs tool (ENAT) for patients with rheumatoid arth-ritis. Arthritis and Rheumatism 2004;50(9Suppl):616. 11. Ndosi M, Bremander A, Hamnes B, et al. Validation of the
edu-cational needs assessment tool as a generic instrument for matic diseases in seven European countries. Annals of the rheu-matic diseases 2013;Published Online First [6th Aug 2013]:doi:10.1136/annrheumdis-2013-203461.
12. Ndosi M, Tennant A, Bergsten U, et al. Cross-cultural valida-tion of the Educavalida-tional Needs Assessment Tool in RA in 7 Eu-ropean countries. BMC musculoskeletal disorders 2011;12(1): 110.
13. Meesters JJL, Vliet Vlieland TPM, Hill J, et al. Measuring edu-cational needs among patients with rheumatoid arthritis using the Dutch version of the Educational Needs Assessment Tool (DENAT). Clinical Rheumatology 2009;28(9):1073-1077. 14. Gabriel Dr goi R, Ndosi ME, Sadlonova M, et al. Patient
edu-cation, disease activity and physical function. Can we be more targeting? A cross sectional study among people with Rheu-matoid Arthritis, Psoriatic Arthritis and Hand Osteoarthritis. Arthritis Research and Therapy 2013;15(5):doi:10.1186/ /ar4339.
15. Beaton DE, Bombardiere C, Guillemin F, et al. Guidelines for the process of cross-cultural adaptation of self report measures. Spine 2000;25(24):3186-3191.
16. Tennant A, Penta M, Tesio L, et al. Assessing and adjusting for cross-cultural validity of impairment and activity limitation sca-les through differential item functioning within the framework of the Rasch model: the PRO-ESOR project. Medical Care 2004;42(1 Suppl):48.
18. Masters GA. Rasch model for partial credit scoring. Psycho-metrika 1982;47:149-174.
19. Andrich D, Lyne A, Sheridan B, et al. RUMM 2020. Perth: RUMM Laboratory 2003.
20. Rasch G. An informal report on a theory of objectivity in com-parisons. Leyden: University of Leyden, 1967.
21. Anderen E. Sufficient statistics and latent trait models. Psy-chometrika 1977;42:69-81.
22. Bond TG, Fox CM. Applying the Rasch model: Fundamental measurement in the human sciences. London: Lawrence Arl-baum Associates 2001.
23. Rosenbaum PR. Criterion-related construct validity. Psycho-metrika 1989;54(4):625-633.
24. Tennant A, Conaghan P. The Rasch Measurement Model in Rheumatology: What is it and why use it? When should it be applied, and what should one look for in a Rasch paper. Arth-ritis and Rheumatism 2007;57(8):1358-1362.
25. Wright B. Local Dependency, Correlations and Principal Com-ponents. Rasch Measurement Transactions 1996;10(3):509--511.
26. Guemin L, Robert LB, David AF. Incorporating the Testlet Con-cept in Test Score Analyses. Educational Measurement: Issues and Practice 2000;19(4):9-15.
27. Smith Jr E. Detecting and evaluating the impact of multidi-mensionality using item fit statistics and principal component analysis of residuals. Journal of Applied Measurement 2002;3(2):205.
28. Bland JM, Altman DG. Multiple significance tests: the Bonfer-roni method. BMJ 1995;310(6973):170.
29. Lord FM. Applications of item response theory to practical tes-ting problems: Lawrence Erlbaum, 1980.
30. Petersen M, Groenvold M, Bjorner J, et al. Use of differential item functioning analysis to assess the equivalence of transla-tions of a questionnaire. Quality of Life Research 2003;12 (4):373-385.
31. Johnson T. Approaches to equivalence in cross-cultural and cross-national survey research. ZUMA Nachrichten Spezial 1998;3:1-40.
32. Gijon-Nogueron G, Ndosi M, Luque-Suarez A, et al. Cross-cul-tural adaptation and validation of the Manchester Foot Pain and Disability Index into Spanish. Quality of Life Research 2013;Published Online First [23 Aug 2013]:doi:10.1007/ /s11136-013-0507-5.
33. Tennant A, Penta M, Tesio L, et al. Assessing and Adjusting for Cross-Cultural Validity of Impairment and Activity Limitation Scales Through Differential Item Functioning Within the Fra-mework of the Rasch Model: The PRO-ESOR Project. Medical Care 2004;42(1):I-37.
34. Brodersen J, Meads D, Kreiner S, et al. Methodological aspects of differential item functioning in the Rasch model. Journal of Medical Economics 2007;10(3):309-324.
35. Ndosi M, Hill J, Hale C, et al. Educational needs of patients with 6 rheumatic diseases. Rheumatology 2009;84(Suppl I):i160-i161.
coMo utIlIzAr e PontuAr A VersÃo PortuguesA do QuestIonÁrIo de AVAlIAÇÃo dAs necessIdAdes educAcIonAIs (PortenAt)
InforMAÇÃo InIcIAl
O Questionário de Avaliação das Necessidades Educacionais é um questionário auto administrado que contém 39 questões que avaliam as necessidades educacionais dos doentes com artrite reumatóide. As questões estão agrupadas em 7 domínios ou «super itens» que avaliam aspetos específicos das «necessidades educacionais». Os itens são:
1. Gestão da dor 2. Movimento 3. Sentimentos
4. Conhecimentos sobre a artrite 5. Tratamento por profissionais de saúde 6. Medidas de autoajuda
7. Apoio de outros
utIlIzAÇÃo do enAt
O PortENAT pode ser utilizado por profissionais de saúde nas enfermarias ou consultas para avaliar quais as ne-cessidades educacional/informação prioritárias do ponto de vista do doente. Esta informação, em conjunto com a percepção do profissional de saúde acerca da informação que o doente precisa, irá permitir uma oferta educa-cional mais oportuna e significativa, à medida das necessidades individuais de cada doente.
O PortENAT pode também ser utilizado por investigadores para avaliar as necessidades educacionais dos doen-tes ao longo do tempo e após uma intervenção educacional. Por exemplo, alterações nas necessidades educacio-nais podem ser avaliadas comparando os resultados do PortENAT no início e no final de um determinado estudo.
coMo É Que o PortenAt É PreenchIdo
O PortENAT foi desenhado para ser preenchido pelo doente sozinho. Esta metodologia fornece informações objetivas livres de viés. A primeira página fornece informações sobre as características pessoais e uma informação geral das necessidades educacionais do doente. Esta página não é uma parte integrante do ENAT e cabe ao pro-fissional de saúde decidir se esta informação é necessária. Por exemplo, pode ser útil para fins de investigação, mas não para a prática clínica.
Os itens do PortENAT começam na página 2. Cada item é avaliado usando uma escala de Likert de 5 pontos com os seguintes descritivos: «Nada importante», «Pouco importante», «Bastante importante», «Muito impor-tante» e «Extremamente imporimpor-tante».
A partir deste momento, o paciente deve colocar um visto “√” na caixa que corresponde ao nível de importân-cia que atribui em cada pergunta. Apenas uma caixa deve ser assinalada para cada pergunta.
coMo É Que o PortenAt É PontuAdo?
O PortENAT pode ser utilizado na prática clínica como checklist, ou como uma ferramenta de investigação (ou em auditorias).
P
ORTENAT
UTILIZADO NA PRÁTICA CLÍNICA COMO CHECKLISTO profissional de saúde pode querer saber qual é o item mais importante para o doente num determinado mo-mento, permitindo-lhe concentrar-se sobre esse tema durante a sua consulta. Neste caso, as necessidades educa-cionais prioritárias para o doente podem ser determinadas observando o PortENAT sem a necessidade de pon-tuar (Exemplo 1).
Exemplo 1: Este item é relacionado com os seus sentimentos:
P
ORTENAT
UTILIZADO COMO FERRAMENTA DE INVESTIGAÇÃO OU DE AUDITORIAPara utilização no processo investigação ou de auditoria, o PortENAT precisa ser codificado e pontuado seguin-do os seguintes passos:
(i) As escalas de Likert do PortENAT devem ser codificadas e pontuadas da seguinte forma: Nada importante = 0
Pouco importante = 1 Bastante importante = 2 Muito importante = 3 Extremamente importante = 4 Ver o exemplo 2 em baixo:
Exemplo 2: Este item é relacionado com os seus sentimentos:
(i) Após a codificação, as pontuações de cada pergunta são então somadas para fornecer a pontuação do
domí-nio. No exemplo acima, a pontuação do domínio é = 8 (pontuação do domínio sentimentos deve variar
en-tre 0 - 16).
(ii) A pontuação dos domínios obtidos em (i) precisa ser transformada em escala linear, para permitir a sua uti-lização em análises paramétricas. Isto é feito utilizando a tabela de conversão fornecida abaixo. No exemplo 2 relativo aos sentimentos, a pontuação do domínio bruto de 8, corresponde a uma pontuação do domínio
transformado de 7,7 (Veja a tabela de conversão).
(iii) Somando-se todas as pontuações dos domínios transformados numa escala linear obtém-se a pontuação
to-tal do PortENAT que é uma estimativa das necessidades educacionais dos doentes (variação = 0 -156)
Neste momento, qual é a importância Nada Pouco Bastante Muito Extremamente
que dá a saber mais sobre o seguinte: importante importante importante importante importante
Maneiras de lidar com o stress √
Maneiras de lidar com as variações
de humor ou com a depressão √
Porque me sinto cansado(a) √
Porque me sinto em baixo ou deprimido(a) √
Neste momento, qual é a importância Nada Pouco Bastante Muito Extremamente
que dá a saber mais sobre o seguinte: importante importante importante importante importante
(0) (1) (2) (3) (4)
Maneiras de lidar com o stress √
Maneiras de lidar com as variações de
tAbelA I. conVersÃo dA PontuAÇÃo dos doMÍnIos eM VAlores obtIdos Por trAnsforMAÇÃo rAsh
Valores obtidos por transformação Rash Pontuação
do domínio Dor Movimento Sentimentos Artrite Tratamento Autoajuda Apoio
0.0 0.0 0.0 0.0 0.0 0.0 0.0 0.0 1.0 2.7 1.9 1.8 2.1 2.2 1.5 1.8 2.0 4.5 3.1 3.1 3.6 3.6 2.7 3.0 3.0 5.6 4.1 4.0 4.6 4.6 3.6 4.0 4.0 6.6 4.8 4.8 5.4 5.6 4.3 4.8 5.0 7.3 5.6 5.7 6.2 6.3 5.0 5.5 6.0 8.1 6.2 6.3 6.9 7.1 5.5 6.1 7.0 8.7 6.8 7.0 7.5 7.8 6.1 6.8 8.0 9.3 7.4 7.7 8.2 8.4 6.8 7.5 9.0 9.9 8.1 8.3 8.9 9.1 7.5 8.1 10.0 10.5 8.7 9.0 9.5 9.8 8.2 8.9 11.0 11.1 9.3 9.7 10.3 10.4 9.1 9.6 12.0 11.6 10.0 10.5 11.2 11.3 10.2 10.4 13.0 12.2 10.7 11.4 12.0 12.1 11.3 11.3 14.0 12.8 11.5 12.5 13.0 13.1 12.4 12.3 15.0 13.4 12.3 13.9 13.9 14.1 13.5 13.9 16.0 14.1 13.1 16.0 15.1 14.9 14.4 16.0 17.0 14.6 14.3 15.9 15.9 15.3 18.0 15.3 15.5 16.9 16.7 16.2 19.0 16.1 17.4 17.7 17.4 17.1 20.0 17.0 20.0 18.4 18.2 18.0 21.0 17.9 19.2 19.0 18.9 22.0 19.3 20.0 19.7 20.0 23.0 21.1 20.8 20.5 21.7 24.0 24.0 21.6 21.3 24.0 25.0 22.6 22.3 26.0 23.9 23.7 27.0 25.6 25.3 28.0 28.0 28.0