RADIATION SCIENCES
07-02B (2019) 01-09
ISSN: 2319-0612 Aceppted: 2019-02-05
BJRS
Determination of the Scattered Radiation at the Neutron
Calibration Laboratory of IPEN using the Shadow Cone
Method
Tallyson Sarmento Alvarenga¹, Bruno Mendes Freitas², Evaldo S Fonseca³, Walsan
W Pereira³, Linda V.E Caldas¹
¹Instituto De Pesquisas Energéticas E Nucleares- IEPN; ²Universidade Federal do Rio de Janeiro;
³Instituto de Radioproteção e Dosimetria - IRD/CNEN - RJ
ABSTRACT
Because of the increase in the demand for the calibration of neutron detectors, there is a need for new calibration services. In this context, the Calibration Laboratory of Instituto de Pesquisas Energéticas e Nucleares (IPEN), São Pau-lo, which already offers calibration services of radiation detectors with standard X, gamma, beta and alpha beams, has recently projected a new test laboratory for neutron detectors. This work evaluated the contribution of dispersed neutron radiation in this laboratory, using the Cone Shadow Method and a Bonner Sphere Spectrometer to take the
measure-ments at a distance of 100 cm from the neutron source. The dosimetric quantities Ambient Dose Equivalent Rate (Ḣ*(10)) and Ambient Dose Equivalent Conversion Coefficient (h*(10)) were obtained
at the laboratory, allowing the calibration of detectors.
1. INTRODUCTION
In recent years, in Brazil there has been a considerable increase in the number of detectors used in the monitoring of workers exposed to neutron fields. This is due to the increased use of techniques in industry, medical area, oil prospecting and in scientific research using neutron-emitting sources. Due to the large neutron energy range, obtaining a reliable measurement is a very difficult task. To obtain reliable measurements of neutron radiation is a very difficult task, because of the large range of neutron energy, its energy-dependence and complex interaction mechanisms with matter;
therefore, for instruments to have their measurements reliable, they need to be calibrated periodically.
According to CNEN technical regulation 3.02 [1], it is mandatory to calibrate the measuring instrument by authorized entities that comply with the specific standards, so it is possible to ensure that the instrument is working correctly. This laboratory should be very well characterized, and the calibration conditions controlled. In Brazil, there is only one laboratory for calibration of neutron
radiation detectors, located in the National Laboratory of Ionizing Radiation Metrology (LNMRI / IRD-CNEN, Rio de Janeiro), with a very large demand for services with this type of radiation.
Since there are many neutron radiation detectors at IPEN, used by the workers of two nuclear reactors and two cyclotrons, in addition to many radioactive sources, a second calibration laboratory with neutrons in Brazil was required, at IPEN.
This laboratory intends to meet the internal and external calibration requirements of detectors for neutrons. As part of the characterization process of the IPEN Neutron Calibration Laboratory (LCN), the radiation scattered throughout the structural elements of the laboratory contributes significantly to the measurement, influencing the reading of the instrument to be calibrated. The proposed study aims to evaluate the influence of the scattered neutrons from the calibration source of 241AmBe, using the Shade Cone Method suggested by ISO 8529-2 [2].
2. MATERIALS AND METHODS
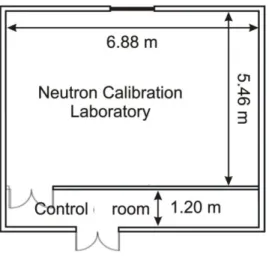
The structural geometry of the neutron calibration laboratory at IPEN is shown in Figure 1. The
installation is in the Bunker, the room measuring 6.88 m x 5.46 m and with concrete walls (thickness of 15 cm), coated with drywall of 2.5 cm thickness.
Figure 1: Simplified floor plan of the Neutron Calibration Laboratory
The LCN radiation system is composed of a 241Am(Be) AMNK128-model AMN200 source with activity of 3.7 × 10¹⁰ Bq (1Ci) and neutron emission rate of 2.46 × 10⁶ n / s [3]. The source was calibrated at the primary standard system at the LNMRI (IRD/CNEN).
The Shadow Cone Method is one of the methods recommended by ISO 8529-2 [2]; its objective is to evaluate experimentally the contribution of scattered neutron radiation. For the application of this method, the ISO 8529-2 [2] recommends the use of a cone made of two types of materials, the front part composed of 20 cm of iron and the back part of 30 cm of polyethylene. In Figure 2 the scheme of the shadow cone method may be seen.
The cone must be positioned between the neutron source and the detector, in order to block the primary neutron source beam. Thus, the response is obtained by the difference of the measurements without the shadow cone [MT (l)], and with the shadow cone [MS (l)] at a given distance (d),
multiplied by the air attenuation correction factor [FA (d)], which can be calculated as described in
Annex C of ISO 8529-2 [2]:
MD(l) = [MT (l) - MS (l)] FA (d) (1)
For the 241AmBe neutron source, FA(l) is the distance of 1 m from the source.
This detection method was first described by Bramblett et al [5]; it is composed of a thermal neutron detector located in the center of the moderating spheres made of polyethylene. The diameters of the spheres can vary from 5,08 cm to 30,48 cm (2 to 12 inches), thus enabling the measurement of neutrons in a wide energy range. One of the most used detectors with the Bonner spheres is the 6Li(Eu) enriched lithium-6 iodide scintillator detector, which has a cross section for thermal neutrons of 940 barns and is detected by means of the reaction 6Li(n,α). This detector was used in conjunction with the Genie 2000 software, which is an acquisition system for counting.
This software was developed and validated by Lemos [6], it is based on an artificial intelligence technique by the use of neural networks to perform the spectrum splitting, where it has a multilayer architecture, based on a network configuration fully interconnected with supervised learning, in an error back-propagation algorithm with a cross-correlation stopping criterion. The results obtained by the software consist of the neutron fluence rate values in 84 energy intervals, where it is possible
to determine the spectra from the set of 7 input vectors representing the 7 normalized
one-unit counting rates and performed with the spheres of different diameters of the spectrometer [6].
3. RESULTS AND DISCUSSION
The measurements were taken at a distance of 1 m from the source, where the detector was positioned at the same height of the cone and the radiation source. The irradiation process took place in two stages: at the first, the measurement was obtained with the cone interposed between the detector and the source, and then the measurement was taken without the cone. The counting rates were obtained using the detector without the moderation sphere. The counting rates were obtained using the detector without moderation (without spheres) and using the 2” (5.08 cm), 3”( 7.62 cm), 5”( 12.70 cm), 8”( 20.32 cm), 10” ( 25.40 cm) and 12”( 30.48 cm) spheres [7].
Each sphere was exposed separately to the radiation during 1 h, thus allowing an uncertainty of less than 2%. In order to calculate the net count rate, the background measurement also was performed during a time interval of 1 h. In order to perform the spectrum splitting, the net counting rates were entered into the NeuraLN Software, which provided the values of spectral fluence, values of
Fluence-Average Energy (EΦ), Ambient Dose Equivalent Rate (Ḣ*(10)) and Ambient Dose
Equivalent Conversion Coefficient (h*(10)) for the beam without and with the cone [8]. Table 1 shows the results obtained by the LN neural network program for the spectrum with and without the cone
Table 1: Values obtained by beam deconvolution with and without the cone.
Distance (cm) Fluence rate (n/cm2.s) h*(10) (pSv/s) Ḣ*(10) (µSv/h) EΦ (MeV) Spectrum without cone
100 46.6 318.4 64.9 3.9
Spectrum with cone
100 29.4 297.4 36.7 3.6
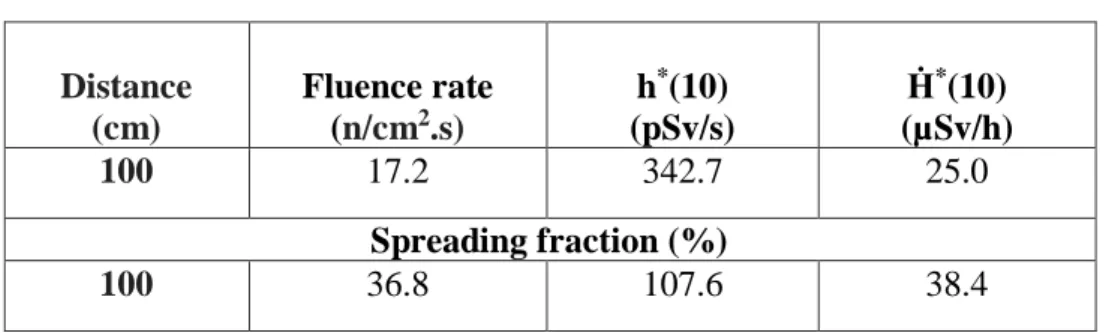
To obtain the direct beam, the equation described in the Shadow Cone Method was applied, obtaining the value for the direct beam. The scattering fraction was obtained by dividing the direct
beam by the value of the scattered beam (with cone). Table 2 presents the values obtained by the neuralLN network program for the direct spectrum.
Table 2: Direct beam values.
Distance (cm) Fluence rate (n/cm2.s) h*(10) (pSv/s) Ḣ*(10) (µSv/h) 100 17.2 342.7 25.0 Spreading fraction (%) 100 36.8 107.6 38.4
To validate the deconvolution, the values obtained experimentally from the direct beam were compared with the values described in ISO 8529-2 [2]. Table 3 presents the comparison between the values of the direct beam and that from the ISO 8529-2 standard [2].
Table 3: Comparison between reference and experimental values.
ISO 8529-1 Experimental Difference (%)
h*(10) (pSv/s) 391 343 12.4 Energy (MeV) 4.19 4.25 1.4
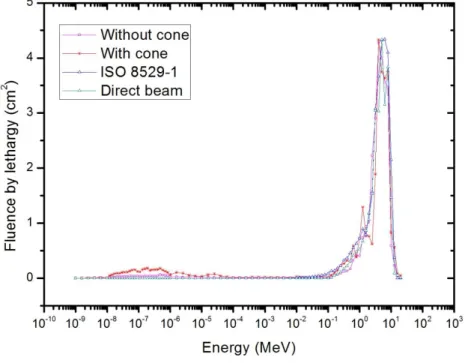
The experimental values obtained for the mean energy and h*(10) present a percentage difference of less than 15%, when compared to the reference values. Figure 3 shows the spectra of the reference beam, total beam, scattered beam, and direct beam, at the distance of 100 cm from the source.
Figure 3: Spectra of reference (ISO 8529-1), total (without cone), scattered (with cone), and
direct beams of the 241AmBe source at the source-detector distance of 100 cm.
The scattering correction factors for fluency rate, Ḣ*(10), and h*(10) were calculated by the ratio between the experimental values measured from the total beam (with scattering) and direct beam values (without scattering). Table 4 presents the correction factors for fluence rate, Ḣ *(10) and h*(10).
Table 4: Comparison between reference and experimental values.
Distance (cm) Fluence rate n/cm2-s h*(10) pSv/s Ḣ*(10) (µSv/h) 100 0.4 1.1 0.4
4. CONCLUSION
The contribution of scattered neutron radiation at the Neutron Calibration Laboratory (LCN) was evaluated in this work. The Shadow Cone Method and a Bonner Sphere Spectrometer were used to perform the measurements at the a distance of 100 cm from the source. Using the Shadow Cone Method, it was possible to estimate the scattering contribution to Ḣ*(10), obtaining a result lower than 40%, thus obeying the maximum scattering allowed in a detector.
5. ACKNOWLEDGMENTS
The authors acknowledge the partial financial support from the Brazilian agencies: FAPES, CNPq, CAPES and MCTI (Project: INCT - Radiation Metrology in Medicine).
REFERENCES
1. CNEN, COMISSÃO NACIONAL DE ENERGIA NUCLEAR, Radioprotection Services,
Standard NE 3.02, Rio de Janeiro, 1988. (In Portuguese).
2. ISO, INTERNATIONAL ORGANIZATION FOR STANDARDIZATION. Reference Neutron
Radiations. Characteristics and Methods of Production, ISO 8529, Part 2, 2000.
3. AMERSHAM. Amersham Products Catalog. UK, 1986.
4. ALVARENGA , T. S., Installation and basic characterization of a laboratory for testing of
portable monitors with neutron radiation. MSc. Dissertation, Instituto de Pesquisas Energéticas
e Nucleares, University of São Paulo (2014). (In Portuguese).
5. BRAMBLETT, R. L., EWING, R. I., BONNER, T. W . A new type of neutron spectrometer.
Nuclear Instruments and Methods, v. 9, pp. 1-12, 1960.
6. LEMOS Jr, R. M., Neutron spectra unfolding using Monte Carlo method and artificial
neural networks. PhD. Thesis. Instituto de Radioproteção e Dosimetria (2009). (In Portuguese).
7. MIRZAJANI, N.; CIOLINI, R.; CURZIO, G. Analysis of the application of the shadow cone technique for the determination of the neutron spectrum with Bonner sphere spectrometer. Nuclear
8.FREITAS, M. F.; MARTINS, M. M.; PATRÃO, C. S. K.; FONSECA, S. E.; PERREIRA, W. W.; MAURICIO, P. L. C. Scattering correction for 241Am-Be calibration of an individual Albedo neutron dosemeter. In: Proceedings of the INAC-International Nuclear Atlantic Conference, Nov 24-29, 2013, Recife-PE, Brasil.