BJRS
RADIATION SCIENCES
07-03A (2019) 01-15ISSN: 2319-0612 Accepted: 2019-05-24
Evaluation of the conventional and synchrotron X-ray
tomography applied to heterogeneous oil reservoir
rocks
Ramos
aG.J., Oliveira
aP.C., Surmas
bR., Ferreira
bL.P., Markötter
cH., Kardjilov
cN.,
Manke
cI., Montoro
dL.A., Isaac
aA.
a Universidade Federal de Minas Gerais, Department of Metallurgical and Materials Engineering,
Belo Horizonte, 31270-901, Brazil. b Petróleo Brasileiro S.A. - PETROBRAS, Research and Development Center,
Cidade Universitária, Rio de Janeiro, 21941-970, Brazil. c Institute of Applied Materials, Helmholtz-Zentrum Berlin,
Hahn-Meitner-Platz 1, 14109 Berlin, Germany. d Universidade Federal de Minas Gerais, Department of Chemistry,
Belo Horizonte, 31270-901, Brazil [email protected]
ABSTRACT
Carbonate and sandstone reservoirs play an important role in oil industry as they host over 50% of the world’s hydrocarbon reserves. For an accurately assessment of porosity and pore size distribution of such complex pore-network, which affect directly the macroscopic characteristics of multiphase fluid flow, X-ray computed microtomography (micro-CT) emerges as a powerful tool. In contrast to lab-based X-ray micro-CT (XCT), synchrotron X-ray micro-CT (SXCT) images are commonly free of artefacts (i.e. beam hardening) and the unique properties of synchrotron sources enable the X-ray imaging of complex and heterogeneous materials in greater detail, with higher quality, and short acquisition time. This work reports results of cone beam computed microtomography (XCT) in comparison with synchrotron computed microtomography (SXCT) applied to very heterogeneous carbonate and sandstone reservoir rocks. We analyze the quality of the image generated in terms of detection of details and artefacts, the advantages and limitation of each technique, as well as features like contrast, sharpness, and signal-to-noise ratio (SNR). Although SXCT offers significant advantages over XCT, the latter gains in cost of operation, accessibility and user-friendliness.
1. INTRODUCTION
Regarding oil and gas reservoir rocks, it is crucial to characterize them from the petrophysical and geological point of view, aiming to optimize investments and increase production to supply the constant growth in global demand [1]. Particularly, carbonate and sandstone reservoirs play an important role in oil industry as they host over 50% of the world’s hydrocarbon reserves [2]. In these sorts of rocks, porosity and permeability are strict associated to one another and both are affected by textural and hydraulic features such as the pore-network structure and pores size distribution. Moreover, these characteristics affect the macroscopic properties of fluid flow [3].
The main challenge is to describe in a reliable way properties of the pore-network without destroying or altering the samples. Porosity can be estimated by indirect methods such as helium porosimetry and mercury injection, but these methods are not able to measure closed porosity, which is the volume of pores or cluster of pores isolated inside the material – and it is also of the interest of the oil sector [4]. Another way of studying porosity is through statistical models from microscopic 2D images. However, the results may lead to misinterpretation of the images. For an accurately assessment of porosity and pore size distribution of such complex pore-networks as geological samples, X-ray computed microtomography (micro-CT) emerges as a powerful tool [5].
The technique is based on the mapping of the linear attenuation coefficient of X-rays passing through the investigated sample. The X-ray beam is attenuated by everything in its path and this attenuation depends on the composition and density of the material. Attenuation coefficient (µ) varies linearly with density [6], making it easy to interpret this information [7]. The dependence on atomic number is power law function (µ ∝ Z3). Materials containing different densities and
chemical composition display different results, where each voxel (3D element) represents the X-ray attenuation at certain point [8] [9]. This way micro-CT allows non-destructive 3D-characterisation and evaluation of materials, providing reliable microscale information of the internal structure of the sample.
In X-ray tube tomography (XCT), the most common lab-based setup, X-rays are emitted from a metallic target and a polychromatic and cone beam-shaped light is selected [10]. The highest possible resolution is mostly limited by the focal spot size of the X-ray source. Low-flux transmission-type ray tubes allow a focal spot size below 1 µm, and high-flux reflection-type
X-ray tubes show larger focal spot size. This way, at lab-based setups, high-resolution XCT (<1 µm) is very difficult and time-consuming [10]. The detector is usually a 2D CCD camera and its size impacts on the time for a scan. In addition, the sample must fit in the field of view of the detector, so a trade-off between the maximum specimen size and the spatial resolution must be made [10]. The higher the spatial resolution, the smaller the field of view and, therefore sample size. The constant progress on detectors and X-ray sources development provides the means to resolve details down to 0.7 µm inside an object [6].
On the other hand, there is synchrotron light, an electromagnetic radiation produced by the acceleration of ultra-relativistic electrons travelling through magnetic fields [11]. Properties of the synchrotron radiation such as high brilliance, possibility of monochromatic light, continuous wavelength spectrum, narrow band pass monochromators, high collimation, low emittance, and the high level of polarization make it possible to resolve and visualize different sample phases even if they carry similar absorption coefficients, achieving high spatial resolution in the sub-micrometer range within short acquisition time. It is possible de achieve spatial resolution as high as 0.2 µm [12]. In contrast to lab-based X-ray computed microtomography, synchrotron X-ray micro-CT (SXCT) images are commonly free of artefacts (i.e. beam hardening) [11]. The unique properties of synchrotron sources enable the X-ray imaging of complex and heterogeneous materials in greater detail, with higher quality, and short acquisition time [13-17].
There have been numerous published articles regarding micro-CT investigations, however none has dealt with qualitative and quantitative comparison for reservoir rocks. Kastner et al (2010) [18], for example, performed a comparative study of high resolution XCT and SXCT applied to iron and aluminum alloys. The article shows that SXCT gives the best results, but in some cases the quality of XCT is comparable to SXCT. Linsmeier et al (2013) [19] compared both techniques in a compacted mixture of Al and W powder, showing optimistic results for XCT. Asghar et al (2015) [20] analyzed heterogeneous cast Al-Si-X alloys and characterized the samples by combining information obtained by the two methods. Therefore, the present work reports results of cone beam computed microtomography (XCT) in comparison with synchrotron computed microtomography (SXCT) applied to very heterogeneous carbonate and sandstone reservoir rocks. We analyze the quality of the image generated in terms of detection of details and artefacts, the advantages and limitation of each technique, as well as features like contrast, sharpness, and signal-to-noise ratio
(SNR). Although SXCT offers significant advantages over XCT, the latter gains in cost of operation, accessibility and user-friendliness, ascending the necessity of being deliberated.
2. MATERIALS AND METHODS
2.1. Rock samples
Physically and/or chemically heterogeneous core samples from producing oil reservoirs were chosen for this study. Two distinct carbonates (identified as WL0115 and F3569H) and a sandstone (IBS0125) were evaluated. Cylindrical samples of about 7 mm diameter were used for the tomographic experiments, satisfying the requirements of minimum beam transmittance and field of view of the detectors used for tomography measurements [21-22]. X-ray diffraction (XRD) was used for the determination of the mineral phases of the rock samples in a computerized Philips X’Pert-APD lab-based diffractometer. Punctual chemical analyses were performed using wavelength-dispersive X-ray spectroscopy (WDS) in a JEOL 8900 electron microprobe.
2.2. Computed tomography
Synchrotron tomography (SXCT) measurements were performed at the imaging setup of BAMline at the German storage ring BESSY II (Berliner Elektronenspeicherring-Gesellschaft für Synchrotronstrahlung m. b. H), operated by Helmholtz-Zentrum Berlin für Materialien und Energie (HZB). Tomographic images of the samples were acquired using an ray energy of 33 keV. X-rays were converted to visible light by using a 250 μm thick CdWO4 scintillator; photons were then recorded by a PCO 4000 CCD camera with 4008 x 2672 pixels (14 bit). An effective pixel size of 2.2 µm was achieved with this configuration. Scan time was approximateldy 20 minutes.
Laboratory-based tomography (XCT) measurements was performed using a cone beam X-ray source (Hamamatsu, L9181-02) equipped with a flat panel (Hamamatsu, C7942SK-05) with 2316 x 2316 pixels. The voltage and current applied during the measurements were 70 kV and 142 µA, respectively. An aluminum filter of 0.5 mm thick was inserted in the X-ray path to reduce beam hardening artefacts. The image pixel size achieved was 8.2 µm. Scan took between 120 to 240 minutes. Table 1 summarizes the experimental conditions used during the tomography measurements.
Table 1: Experimental conditions used during the tomography experiments. Tomography SXCT XCT Instrument BAMline/BESSY-II/HZB MicroCT/HZB Pixel size [µm] 2.2 8.2
Exposure time [s] 1.1 s/projection 60 s/projection
Number of projections 1200 600
Energy/Wavelength 33 KeV 70 kV, 142 µA Filter: Al 0.5 mm
2.3. Image processing and data evaluation
The cone beam computed tomography data and synchrotron micro-CT data were reconstructed. By applying an intensity threshold based on their grey level, images were segmented manually with support of the software ImageJ, and then the three-dimensional images and quantitative analysis performed with Avizo version 9.4. As the images produced demonstrated high quality, no usual pre- or post-segmentation process to filter background noise was required.
The pore connectivity was also evaluated. In analysis like that, each voxel of a particular colour is compared to all the other voxels in its vicinity (voxels that share a face, an edge, or a corner). If they are of the same colour, they are then considered to belong to the same object [8].
Contrast, sharpness and signal-to-noise ratio (SNR) values were calculated according the subsequent steps. The line profiles necessary for these investigations were taken by means of ImageJ.
Polynomial interpolation of parts of the line profiles was performed to obtain grey-values of different mineral phases. Contrast-values were then determined at certain grains based on the following formula [18]:
SNR was calculated by the formula below, where σ is the standard deviation for the grey-values of the grains considered [23].
(2)
Sharpness is arguably the most important factor in image quality because it determines the amount of details can be resolved by an imaging system. The simplest form of estimating the sharpness from a grayscale image is based on edge contrast differences (transition between contrast boundaries).
3. RESULTS AND DISCUSSION
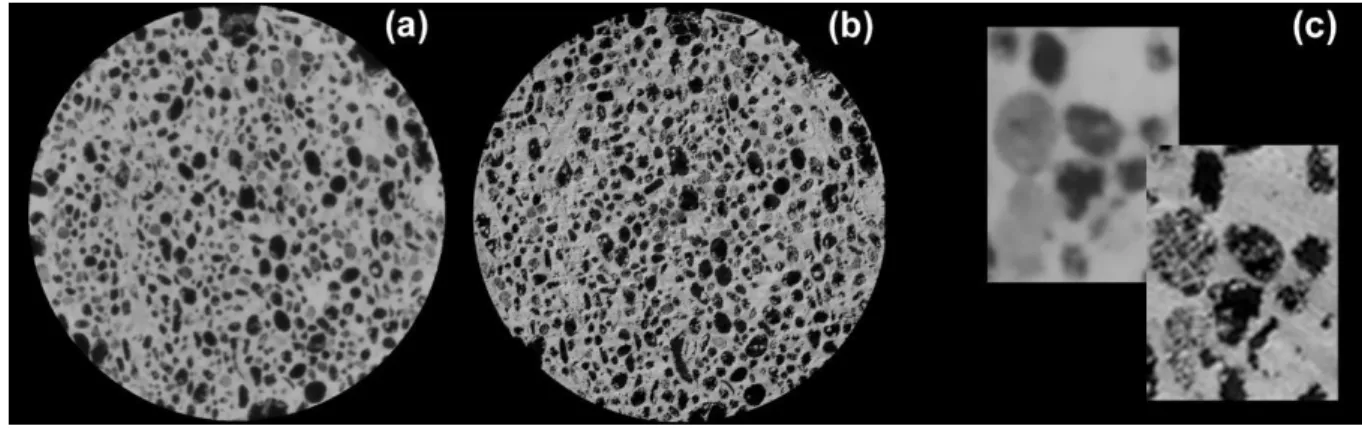
The results of computed tomography of WL0115 sample and some highlighted parts are shown in Figure 1 below.
Figure 1: WL0115 sample slices obtained by (A) XCT and (B) SXCT.
For WL0115 sample, results regarding SXCT have demonstrated to be richer in details. No ring artefacts were detected. As one can notice from the zoomed structures, XCT data-set suggests the presence of a matrix containing three different grey values (i.e. two phases and pores), while SXCT results show that the second phase is in fact pores obstructed by the same mineral phase existing in
the matrix. Indeed, the XRD performed has shown that the sample is composed entirely by calcite. This discrepancy affects both qualitative and quantitative analysis. As SXCT images display one precise shade of grey, segmenting process was fairly easier and straightforward, revealing realistic characteristics of the rock sample, in opposition to XCT dataset.
When it comes to an oil reservoir, one of the most important feature is the pore connectivity, which is correlated to the capacity of the oil the flow through the pores and, hence permeability. The pore-network is presented in Figure 2 for WL0115 sample. A colour was assigned for each isolated pore. It is possible to observe that there are more separated pores in XCT than in SXCT, i. e., the pore connectivity in SXCT is much higher. This huge divergence impacts strongly when modelling a reservoir arrangement, leading to misconception of the real system and even a drop of investments on the oil basin under discussion.
Figure 2: Larger pores isolated for (A) XCT and (B) SXCT. A colour was assigned for each pore.
In Figure 3 tomography results for F3569H rock sample are shown. SXCT was better able to distinguish between the mineral phases, especially the minor grains occupying the voids – what appears as a blur in XCT is actually revealed as a small grains assembly in synchrotron tomography. The grey scale values for SXCT are easier to define due to higher sharpness, resulting in a more precise representation of the rock structure and the pore-network. Four different ranges of grey-values were identified for both cone beam and synchrotron tomography, suggesting the presence of pores and three distinct mineral phases. The XRD assessment detected the existence of calcite, dolomite and quartz. The divergence between the pore systems exhibited by both techniques
are illustrated in Figure 4. XCT shows almost no connectivity, however SXCT results bring a rock sample practically fully connected.
Figure 3: F3569H sample slices obtained by (A) XCT and (B) SXCT.
Figure 4: Larger pores isolated for (A) XCT and (B) SXCT. A colour was assigned for each pore.
Cross-sections for IBS0125 sample obtained by cone beam and synchrotron tomography are displayed in Figure 5. In terms of qualitatively observation, both techniques demonstrate images with great resolution and contrast, bringing information with clear details. No artefacts were exhibited. In comparison to the setup chosen for WL0115 and F3569H samples, XCT scan for IBS0125 took longer time, resulting in cone beam images with merit comparable to those produced by synchrotron radiation. For both cases, three different phases were identified by the tomographic
dataset, proven to be by XRD quartz and orthoclase, and a third mineral phase of high attenuation coefficient present in an amount inferior to the detection limit of the diffractometer. WDS punctual chemical analysis was performed for this unidentified phase and the results indicated a mixture of metallic oxides composed mostly by Ti, Fe, Nb e Mn. These metallic oxides are understood like a unique phase in tomographic volume as it is not possible to distinguish between their grey-values.
Figure 5: IBS0125 sample slices obtained by (A) XCT and (B) SXCT.
With the arrangement set for cone beam tomography, the pore network revealed by XCT and SXCT had a good congruence. Both displayed a high-level connectivity of the voids, as one can see in Figure 6. The greater pores exhibited in A and B correspond to approximately 99% of the total volume of voids present in each sample. This sample is a prove that it is possible to acquire data with genuine information by using cone beam micro-CT, dealing with the trade-off of longer measurement time.
Figure 6: Pore network revealed by (A) XCT and (B) SXCT for IBS0125 sample.
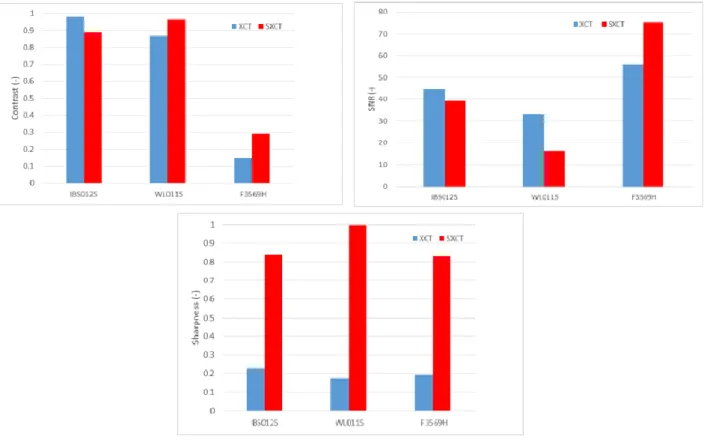
Evaluations of relative contrast, SNR and sharpness are exhibited in Figure 7. For IBS0125 and WL0115, the contrast-values investigated by both XCT and SXCT are elevated and nearly close, being slightly higher in the case of XCT data for IBS0125 sample. As WL0115 sample carries two parts with very distinct grey values – pores and matrix –, and these were the parts chosen for this investigation, it is expected a high contrast value even for XCT. In the case of IBS0125 sample, the high value displayed is due to the higher scan time chosen in this measurement in comparison to the others XCT setups. For F3569H the best contrast is given by SXCT, however the two modalities of tomography displayed low values. This is consequence of the amount of phase contrast present in the SXCT data for this sample.
When it comes to the signal-to-noise ratios (SNR) for the different specimens, the higher the ratio, the less noise is present on the image. SXCT demonstrated lower values for IBS0125 and WL0115 measurements. However, different measurement times were used - for XCT, the time for a complete scan was about 120-240 min and for SXCT 20 min. This way, it is reasonable to point that synchrotron micro-CT exhibits the best results, as the difference in SNR values were slightly small compared to the large variance in scan times.
The other property evaluated for the samples was the sharpness. The values calculated for SXCT were impressive higher compared to XCT. Due to the strong phase contrast carried out by synchrotron tomography, it is expected sharper edges and hence high sharpness values. A visually observation of the preview pictures makes it clear that SXCT produces sharper results.
Although, in general, SXCT displayed images with better standard, the results as well show that it is possible to obtain XCT images with quality comparable to SXCT ones. Sharpness values were much higher in all scans for SXCT, but XCT proved to provide data with contrast as high as SXCT. When choosing between both techniques, one must bear in mind not only the effectiveness of the procedure, but also side factors as cost and accessibility to the facilities. Access to synchrotron beamline facilities is limited and costly, whereas lab-based micro-CT systems are more cost-efficient.
4. CONCLUSION
Cone beam X-ray computed tomography as well as synchrotron computed tomography were studied for very heterogeneous geological sample and the results compared quantitatively and quali-tatively. Characteristics like contrast, signal-to-noise ratio, and sharpness, wealth of details and presence of artefacts were analyzed. Some significant results are listed below.
• When it comes to detection of details, SXCT proved to be more efficient. However, it is possi-ble to obtain XCT images with quality comparapossi-ble to those produced by SXCT with the trade-off of longer scan times.
• Sharpness values were higher for all SXCT measurements, but contrast values were quite close in certain cases for XCT.
• Synchrotron tomography is a powerful characterization tool. However, much lower cost and higher availability make cone beam micro-CT an attractive method for materials science.
ACKNOEDSWLEDGMENT
We thank Petrobras group for providing rock samples and for their support & expertise, Helm-holtz Zentrum Berlin for their impeccable work and UFMG team for the tests performed. We thank Petrobras and CNPq for financial support.
REFERENCES
[1] ZAMBRANO, M.; TONDI, E.; MANCINI, L.; ARZILLI, F.; LANZAFAME, G.; MATERAZZI, M.; TORRIERI, S. 3D Pore-network quantitative analysis in deformed carbonate grainstones. Mar Petroleum Geol, v. 82, p. 251-264, 2017.
[2] PAK, T.; BUTLER, I. B.; GEIGER, S.; VAN DIJKE, M. I. J.; SORBIE, K. S.; Droplet Fragmentation: 3D imaging of previously unidentified pore-scale process during multiphase flow in porous media. Proc Natl Acad Sci U S A, v. 112, p. 1947-1952, 2015.
[3] CARMAN, P. C. Fluid flow through granular beds. Trans Inst Chem Eng London, v. 15, p. 150-166, 1937.
[4] ARZILLI, F.; CILONA, A.; MANCINI, L.; TONDI, E.; Using synchrotron X-ray microtomography to characterize the pore network of reservoir rocks: A case study on carbonates. Adv Water Resources, v. 95, p. 254-263, 2016.
[5] WILDENSCHILD, D.; SHEPPARD, A. P. X-ray imaging and analysis techniques for quantifying pore-scale structure and processes in subsurface porous medium systems. Adv
Water Resources, v. 51, p. 217-246, 2013.
[6] BAKER, D. R.; MANCINI, L.; POLACCI, M.; HIGGINS, M. D.; GUALDA, G. A. R.; HILL, R. J.; RIVERS, M. L. An introduction to the application of X-ray microtomography to the three-dimensional study of igneous rocks. Lithos, v. 148, p. 262-276, 2012.
[7] KETCHAM, R.; CARLSON, W. Acquisition, optimization and interpretation of X-ray computed tomographic imagery: applications to the geosciences. Comput Geosci, v. 27, p. 381-400, 2001.
[8] LANDIS, E. N.; KEANE, D. T. X-ray microtomography. Mater Charact, v. 61, p. 1305-1316, 2010.
[9] CNUDDE, V.; BOONE, M. N. High-resolution X-ray computed tomography in geosciences: A review of the current technology and applications. Earth-Sci Rev, v. 123, p. 1-17, 2013.
[10] SALVO L, CLOETENS, P.; MAIRE, E.; ZABLER, S.; BLANDIN, J. J.; BUFFIÈRE, J. Y.; LUDWIG, W.; BOLLER, E.; BELLET, D.; JOSSERON, C. X-ray microtomography an attractive characterisation technique in materials science. Nucl Instrum Methods Phys Res B, v. 200, p. 273-286, 2003.
[11] HAIBEL, A. µ-Tomography of Engineering Materials. In: REIMERS, W.; PYZALLA, A. R.; SCHREYER, A.; CLEMENS, H. Neutrons and synchrotron radiation in engineering
materials science: from fundamental to material and component characterization, 1st ed., Weinheim: Wiley, 2008. p. 275-286.
[12] WU, S. C.; XIAO, T. Q.; WITHERS, P. J. The imaging of failure in structural materials by synchrotron radiation X-ray microtomography. Eng Fract Mec, v. 182, p. 127-156, 2017. [13] ISAAC, A.; ANTUNES, A. F.; CONTI, R.; MONTORO, L. A.; MALACHIAS, A.;
physicochemical changes of sugarcane bagasse during sequential acid/alkali pretreatments by synchrotron phase-contrast imaging. Ind Crops Prod, v. 114, p. 19-27, 2018.
[14] ISAAC, A.; DE PAULA, J.; VIANA, C. M.; HENRIQUES, A. B.; MALACHIAS, A.; MONTORO, L. A. From nano- to micrometer scale: the role of microwave-assisted acid and alkali pretreatments in the sugarcane biomass structure. Biotechnol Biofuels, v. 11, p. 73-84, 2018.
[15] FERREIRA, E. G. A.; YOKAICHIYA, F.; RODRIGUES, M. S.; BERALDO, A. L.; ISAAC, A.; KARDJILOV, N.; FRANCO, M. K. K. D. Assessment of Greener Cement by employing thermally treated sugarcane straw ashes. Constr Build Mater, v. 141, p. 343-352, 2017.
[16] ISAAC, A.; CONTI, R.; VIANA, C. M.; SKET, F. I.; MONTORO, L. A.; HILGER, A.; MANKE, I. Exploring biomass deconstruction by phase-contrast tomography. Ind Crops Prod, v. 86, p. 289-294, 2016.
[17] ISAAC, A.; BARBOZA, V.; SKET, F. I.; DE ALMEIDA, J. R. M.; MONTORO, L. A.; HILGER, A.; MANKE, I. Towards a deeper understanding of structural biomass recalcitrance using phase-contrast tomography. Biotechnol Biofuels, v. 8, p. 8-40, 2015.
[18] KASTNER, J.; HARRER, B.; REQUENA, G.; BRUNKE, O. A comparative study of high resolution cone beam X-ray tomography and synchrotron tomography applied to Fe- and Al-alloys. NDT&E INT, v. 43, p. 599-605, 2010.
[19] LINSMEIER, C.; FU, C. C.; KAPROLAT, A.; NIELSEN, S. F.; MERGIA, K.; SCHÄUBLIN, R.; LINDAU, R.; BOLT, H.; BUFFIÈRE, J. Y.; CATURLA, M. J.; DÉCHAMPS, B.; FERRERO, C.; GREUNER, H.; HÉBERT, C.; HÖSCHEN, T.; HOFMANN, M.;
HUGENSCHMIDT, C.; JOURDAN, T.; ZIVELONGHI, A. Advanced materials
characterization and modeling using synchrotron, neutron, TEM, and novel micro-mechanical techniques — A European effort to accelerate fusion materials development. J Nucl Mater, v. 442, p. S834 – S845, 2013.
[20] ASGHAR, Z.; REQUENA, G.; SKET, F. Multiscale tomographic analysis of heterogeneous cast Al-Si-X alloys. J Microsc, v. 259, p. 1-9, 2015.
[21] KARDJILOV, N.; HILGER, A.; MANKE, I.; WORACEK, R.; BANHART, J. CONRAD-2: The new neutron imaging instrument at the Helmholtz-Zentrum Berlin. J Appl Crystallogr, v. 49, p. 195–202, 2016.
[22] GÖRNER, W.; HENTSCHEL, M. P.; MÜLLER, B. R.; RIESEMEIER, H.; KRUMREY, M.; ULM, G.; DIETE, W.; KLEIN, U.; FRAHM, R. BAMline: The first hard X-ray beamline at BESSY II. Nucl Instrum Methods Phys Res A, v. 467–468, p. 703–706, 2001.
[23] ANDREW, M. Reservoir-Condition Pore-Scale Imaging of Multiphase Flow. 2014. Thesis (Doctor of Philosophy) - Royal School of Mines, Imperial College London, London.
![Table 1: Experimental conditions used during the tomography experiments. Tomography SXCT XCT Instrument BAMline/BESSY-II/HZB MicroCT/HZB Pixel size [µm] 2.2 8.2](https://thumb-eu.123doks.com/thumbv2/123dok_br/18278505.881374/5.892.132.755.227.482/experimental-conditions-tomography-experiments-tomography-instrument-bamline-microct.webp)