BJRS
Definition of parameters for a test section for the analysis of
natural convection and coolant loss in the AP1000 nuclear reactor
by similarity laws and fractional scaling analysis
L. F. S. Cadiz
a; M. A. B. da Silva
a; F. R. de A. Lima
a; C. A. B. de Oliveira
a aDepartamento de Energia Nuclear - UFPE, 50.740-545, Cidade Universitária, Pernambuco, BrasilABSTRACT
The present work develops and analysis the main parameters of a test section for natural convection in case of failure of the pumping system as much as the loss of coolant in refrigeration accidents. For this realization a combination of laws of basic similarity and an innovative scale methodology, known as Fractional Scaling Analysis (FSA), was de-veloped. The depressurizing is analyzed when a rupture occurs in one of the primary system piping of the AP1000 nuclear reactor. This reactor is developed by Westinghouse Electric Co., which is a PWR (Pressurized Water Reactor) with an electric power equal to 1000MW. Such a reactor is provided with a passive safety system that promotes con-siderable improvements in the safety, reliability, protection and reduction of costs of a nuclear power plant. The FSA is based on two concepts: fractional scale and hierarchy. It is used to provide experimental data that generate quantita-tive evaluation criteria as well as operational parameters in thermal and hydraulic processes of nuclear power plants. The results were analyzed with the use of computational codes.
Keywords: AP1000, LOCA, FSA.
07-02B (2019) 01-12
RADIATION SCIENCES
ISSN: 2319-0612 Accepted: 2019-02-22
1. INTRODUCTION
Loss of Coolant Accident (LOCA) or a cooling pump stop are serious accidents that can occur in a nuclear reactor and, if not controlled safely, the results can result in severe damage, especially in the core. A new methodology was developed by Zuber [1]. To promote scale analyzes in time-dependent processes involving an aggregate of modules and interactive processes (such as nuclear power plants), as well as integrating and organizing information and data of interest to complex structures and secu-rity analysis projects. This methodology is known as Fractional Scaling Analysis (FSA). It is used for the supply of experimental data that generate quantitative criteria and evaluation, as well as opera-tional parameters in thermal and hydraulic processes of nuclear power plants. In engineering projects, carrying out tests with structures presenting true magnitude, that is, prototypes, involves quite high costs, making it difficult or even impossible to carry out such tests. Thus, a test section is designed for the natural convection process and the loss of coolant the AP1000 reactor, using scaling analyzes.
2. MATERIALS AND METHODS
The techniques used to analyze the safety of nuclear reactors, specifically with respect to thermal hydraulic behavior, have as mains objective to analyze the real operational conditions to quantita-tively predict the operational conditions. In the nuclear reactor in full operation, there are numerous factors that can cause it to enter a state of emergency. The temperature, pressure and flow rate of the coolant are fundamental properties to be controlled. They can range from poor performance to a major accident. The AP1000, developed by Westinghouse Electric Co, is a PWR (Pressurized Water reac-tor) type nuclear reactor with an electric power of 1000MW. Such a reactor is endowed with a passive safety system that promotes considerable improvements in the safety, reliability, protection and cost reduction of a nuclear power plant, simplicity being its key concept. Similarity consists of obtaining common dimensionless groups, a projected structure and the model used. Dimensional analysis is used as a tool.
The FSA compares model and prototype, or between two or more test facilities in the study of the same phenomenon. In determine a region of space characterized by a variable V, which undergoes a change caused by an agent Φ, then, according to the FSA:
Φ =dV
dt (1)
The fractional rate of change, ω, of variable V is defined:
ω = 1 V dV dt = Φ V (2)
V where is the variable contained in a space and submitted to the variation agent. Considering a reference value V0, the variation suffered by the variable, δV, is quantified and thus the fractional or metric variation of V effect is defined by:
Ω =δV
V0 (3)
I can also be obtained by means of Eq.(3), as:
Ω = ω. δt = Φ
V0δt (4)
Analyzing the equations, processes are similar where have their state variable altered by the same fractional quantity, that is, they have the same values of the effect metric. In this new methodology, similarity requires only the equality of the values of Ω, without the equalities of the other parameters ω and δt [1]. Thus, the fractional scaling can be applied at any level of interest or complexity.
For application of the fractional scaling analysis the Eq.(5), represents the rate of depressurizing of a fluid in volume V of a system [2].
dp dt = 1 VKs,sys[− ∑ V̇j+ vfg hfg(Q̇2ϕ)liq+ ∑ ( βj ρj.CpjQ̇liq) j=l,v + ( β ρ.Cp) PB+ γ−1 γ Q̇N2 p ] = ∑ Φj j (5)
In this equation the individual rates are defined for contraction or volumetric expansion, V̇j, and the individual pressure variation agents, Φj. The term Ks,sysrepresents the isentropic compressibility of the system, which is given by the sum of the individual isentropic compressibilities weighted by the respective volumetric fractions. Each term of variation of Eq.(5) is normalized, so that its dimension-less variable ae of unity order. If Y0 is the initial reference values for the variation agent Y(t), the normalized term has the form:
Y+(t) =Y(t)
Y0 (6)
The volumetric variation rates, Vj̇ (t), are now dimensioned according to Eq.(7)
Vj+̇ =V̇ (t)j
V̇ (t)j (7)
By combining with Eqs.(5), (6) and (7), Eq.(8) is obtained, the terms of which are defined in Table 1: dp+ dt = ωrΦr ++ ω 2ϕΦ2ϕ+ + ωlΦl++ ωvΦv++ ωPBΦPB + + ω N2ΦN2 + (8)
In addition to having great utility in the synthesis of data for the system, the fractional rates o varia-tion, ω, provide the scale criterion for projects and classify the variation agents, Φ, according to their importance. The coefficients are shown in Eq.(8), multiplied by reference time, tref, to give the frac-tional effect metrics, Ωj = ωj. tref, which must have the same values in all installations where the same phenomenon happens. It is observed that there will only be similarity in the behavior of the
pressures over time, if each normalized agent also has the same values in the model and in the proto-type [2]. Table 1 shows the normalized fractional variation agents and the initial rates of fractional variation.
Table 1: Standardized fractional variation agents and initial rates of fraction variation.
Variation agents Agents in the range of
pressure variation:𝚽𝐣+
Initial Fractional Rates of Change: 𝐰𝐣
Flow through rupture (j=1) Φr+ = − V̇1 + Ks,sys+ ωr = (V̇1) 0 Ks,sys Phase change (j=2) Φ2ϕ + = (vfg⁄hfg) + Ks,sysx Q̇2ϕx ω2ϕ= (vfg⁄hfg) 0 VΔp(Ks,sys) 0 Q̇2ϕ Expansion or single-phase thermal contraction (j=3,4) Φl,v+ = (β (ρc⁄ p)) l,v + Ks,sys+ ωl,v= (β (ρc⁄ p)) l,v VΔp(Ks,sys) 0 Q̇l,v
Expansion due to pump heating (j=5) ΦP+B = (β (ρc⁄ p))l + Ks,sysx PB+ ωPB = (β (ρc⁄ p)) l,0 VΔp(Ks,sys) 0 (PB)
Expansion of inert gas due to heating on the wall
(j=6) ΦN+2 = Q̇N2 p++ (p amb⁄Δp) ωQN2 =γ − 1 γ Q̇N2 V(Δp)2(K s,sys)0
Where, Q̇l,v, Q̇2ϕ, Q̇N2, and PB represent, respectively, heat transfers for one phase, for the two phase, for inert gas (Nitrogen) and pumping power. The superscript terms “+” represent the dimensionless terms. The terms Ksys, vlv, hlv, β, ρ, Cp and γ represent respectively isentropic compressibility, the difference between
specific volumes of vapor and liquid, vaporization enthalpy, isobaric thermal expansion coefficient, density of water, the specific heat at constant pressure and the isentropic exponent. The dimensionless time has the fol-lowing form:
Eq.(8) can be converted to: dp+ dt+ = Φr ++ ∑ ω̂ j 6 j=2 Φj+ (10)
The ratios of the fractional variation rates corresponding to the pi groups of the traditional scale methods [2] are defined at the beginning of the LOCA by:
ω̂j= ωj
|ωr| , j=2...6, |ω̂j| < 1, ω̂1 = ω̂r = 1 (11)
Even so, this procedure does not scale the time correctly for the whole household. For a correct time scale, all the variation agents must be added. Thus, Eq.(10) is divided by the fractional rate of change of the aggregate given by the sum of the individual rates, according to Eq.(12):
ω̅ = ωr+ ∑6 ωj
j=2 (12)
The effective dimensionless time of the whole aggregate is given by the effect metric, defined by:
t+ = |Ω| = |ω̅|t (13)
Since the fractional rates of change present in Eq.(8) represent initial rates under conditions of max-imum power, and considering that the system is in the steady state, when the occurrence of the rup-ture, all the variation agents are balanced, constituting the rupture the only exception, making, in the special case of a loss of coolant, the fractional rate of change of the aggregate coincides with that of the rupture. To normalize Eq.(8), the normalization of each volumetric rate of change should be used, dividing it by that of the aggregate, as explained by Eqs.(14) and (15).
V̇j+ = V̇j(t)
Replacing Eq.(14) in Eq.(8) leads to Eq.(15), in which the term Φj+represents each normalized vari-ant: dp+ dt = |∑ Vj ̇j|t=0∑ V̇j j VΔp(Ks,sys)0Ks,sys+ = |∑ ωj j| Ks,sys+ = |ω̅| ∑ ϕj + j (15)
However, as defined in Eq.(14), the division of Eq.(15) by the absolute value of the fractional rate of change of the aggregate, term before the summation on the right side of this equation, results in the correct dimensionless time for the process. Thus, the non-dimensional pressure variation rate is defied by Eq.(16): dp+ dt+ = ∑ ϕj + 6 j=1 (16)
Following the dimensional analysis, which originated the similarity scale criteria, there are significant the existence of significant dimensionless groups or numbers representing momentum, mass and en-ergy transfer characteristics in the single-phase flow under a natural circulation regime. These criteria are assumed to be of relative importance at the time of the establishment of the small-scale experi-ment. Thus, it can reproduce more similar effects of prototype, in study, of real scale.
The experimente has as representative numbers of the phenomenon that is desired to simulate the following dimensionless numbers:
• Richardson number: R =gβ∆T0l0 u02 (17) • Stanton number: St = ( 4hl0 ρCpu0d) (18)
3. RESULTS AND DISCUSSION
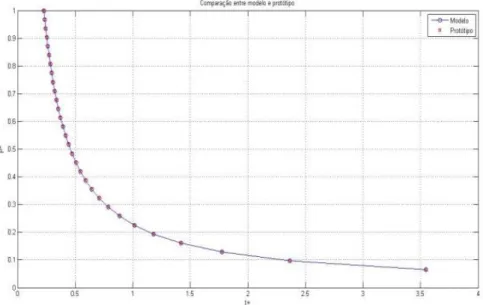
The main parameters of a test section are determined in order to simulate the loss of coolant in the AP1000 reactor core. The numerical simulation of the depressurizing for a pressure vessel containing only water, with the geometric and thermodynamic parameters of such a reactor was performed. For a first study, the area of rupture of 0.005m² is adopted
Figure 1: Comparison between the model and the simulated prototype
The agreement of the curves in Figure 1 shows the effectiveness of the FSA method. The main pa-rameters obtained by this work, which faithfully represent the temporal variation of the pressure in a depressurizing process for a future construction of a test section, show the similarity bet ween the model and the prototype by the FSA. The effect metric (Ω) for both is 0,400. Applying the aforemen-tioned procedures to other conditions, by varying areas of ruptures, obtain the results presented in Table 2.
Table 2: Scale parameters for other models subject to the same initial pressure and tempera-ture conditions, but with variation of the area of ruptempera-ture.
Breaking area (m²) Volume (m³) 𝐕̇𝐫𝐜(𝟎) (m³/s) ∆𝐏𝐱𝐊𝐬𝐲𝐬(𝟎) 𝛚𝟏 (𝐬−𝟏) 𝐒𝐭 Ω Prototype 10x10−3 30,9556 0,1672 0,0119 2,0069 1 0,0238 Model 1 8x10⁻³ 0,1433 0,1338 0,0109 1,6055 0,3862 0,0238 Model 2 6x10⁻³ 0,1433 0,1003 0,0109 1,2042 0,5149 0,0238 Model 3 4x10⁻³ 0,1433 0,0669 0,0109 0,8028 0,7723 0,0238 Model 4 2x10⁻³ 0,1433 0,0334 0,0109 0,4014 1,5446 0,0238
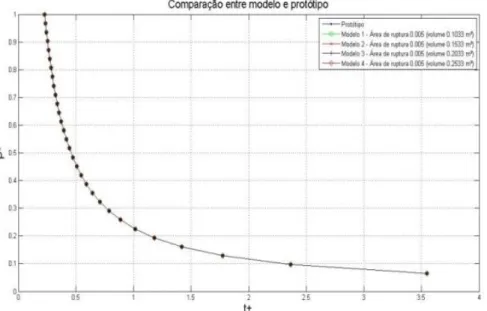
Figure 2: Comparison of the prototype and the different models, according to table 2.
Figure 2 shows the efficiency of the method. The curves overlap during the depressurizing process for models with different areas of ruptures, so by the FSA the similarity does not depend on the area of rupture, considering the limitations of scale. The same procedures were performed; however, the volume of the model was varied. Table 3 details such results. The graph of pressure and time dimen-sioned by the FSA is given in Figure 3.
Table 3: Scaling parameters for other models subject to the same initial pressure and tem-perature conditions, but with volume variation.
Breaking area (m²) Volume (m³) 𝐕̇𝐫𝐜(𝟎) (m³/s) ∆𝐏𝐱𝐊𝐬𝐲𝐬(𝟎) 𝛚𝟏 (𝐬−𝟏) 𝐒𝐭 Ω Proto-type 10x10−3 30,9556 0,1672 0,0119 2,0069 1 0,0238 Model 1 5x10⁻³ 0,1033 2,3x10⁻⁴ 0,0109 0,4650 0,3170 0,0238 Model 2 5x10⁻³ 0,1533 2,3x10⁻⁴ 0,0109 0,3133 0,4704 0,0238 Model 3 5x10⁻³ 0,2033 2,3x10⁻⁴ 0,0109 0,2363 0,6239 0,0238 Model 4 5x10⁻³ 0,2533 2,3x10⁻⁴ 0,0109 0,1896 0,7773 0,0238
Figure 3: Comparison of the prototype and models, with volume variation.
Analyzing the results, it is noticed that even with the variation of the volumes, there is similarity between prototype and model, during the process of depressurizing. This was evidenced by Figure 3. Different volumes of the model and areas of ruptures are simulated and by the synthesis presented by the FSA similarity is obtained. It is proved that by the FSA, the similarity of this process does not depend on the volume of the adopted model, considering the limitations of scale. The effect matric
values are similar, which are similar for the prototype and the model, indicating, therefore, similar depressurizing, regardless of the experiment times and the dimensions being different. Only the con-tribution of the volumetric flow due to rupture is considered, the non-dimensional fractional variation rate is unitary for both the model and the prototype:
ω̂1 = ω1
ω̅ = ω1
ω1 = 1 (19)
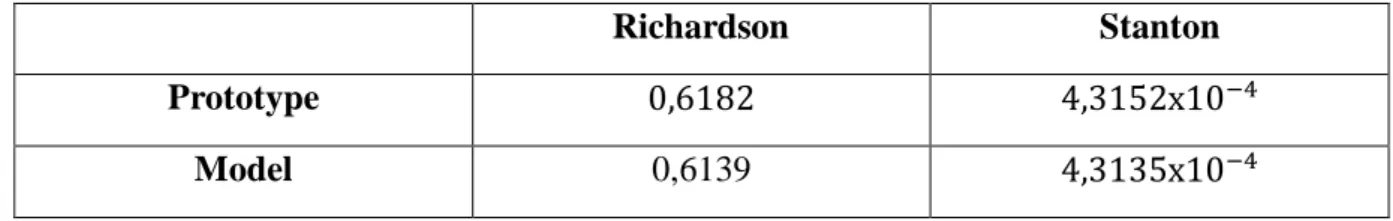
Similarity for natural convection the determination of the best combinations between the design pa-rameters and the operational conditions will constitute a series of objectives to be maximized or mi-nimized. Table 4 shows the result of the dimensionless numbers selected to represent the phenomenon of natural convection, through similarity.
Table 3: Comparison of dimensionless numbers between prototype and model.
Richardson Stanton
Prototype 0,6182 4,3152x10⁻⁴
Model 0,6139 4,3135x10⁻⁴
4. CONCLUSION
The investigations carried out in the present study showed the feasibility of proposed methodology for small scale thermohydraulic experiments for simulating a natural circulating regime or a loss of coolant. This methodology supports the decisions to be taken by the designers during the design phase, and allows to obtain, in this way, more efficient and economical experiments.
5. ACKNOWLEDGMENT
REFERENCES
1. WULFF. W., “Scaling of Thermohydraulic Systems”, Nuclear Engineering and Design, v. 163, n. 3, pp.359-395, 1996.
2. ZUBER, N. WULFF, W., ROHATGI, U. S, et. Al., “Application of Fractional Scaling Anal-ysis (FSA) to Loss of Coolant Accident (LOCA)”. The 11º International Topical Meeting on Nu-clear Reactor Thermal-Hydraulics (NURETH-11), pp.1-25, 2005