*Corresponding author. E-mails: [email protected]; [email protected]
This is an Open Access article distributed under the terms of the Creative Commons Attribution License (http://creativecommons.
org/licenses/by/4.0/), which permits unrestricted use, distribution, and reproduction in any medium, provided the original author
and source are credited.
© 2020 The Author(s). Published by VGTU Press
ISSN: 2029-4913 / eISSN: 2029-4921 2020 Volume 26 Issue 1: 213–239
https://doi.org/10.3846/tede.2020.11883
A CONSTRUCTIVIST MODEL OF BANK BRANCH FRONT-OFFICE
EMPLOYEE EVALUATION: AN FCM-SD-BASED APPROACH
Ana C. C. PAES DE FARIA1, Fernando A. F. FERREIRA2, 3*, Paulo J. V. L. DIAS4, Amali ÇIPI5
1ISCTE Business School, University Institute of Lisbon, Avenida das Forças Armadas,
1649-026 Lisbon, Portugal
2, 4ISCTE Business School, BRU-IUL, University Institute of Lisbon,
Avenida das Forças Armadas, 1649-026 Lisbon, Portugal
3Fogelman College of Business and Economics, University of Memphis, Memphis,
TN 38152-3120, USA
5University of Vlora “Ismail Qemali”, Sheshi Pavarësia, 9401 Vlorë, Albania
Received 7 October 2019; accepted 11 December 2019
Abstract. The banking sector is one of the primary drivers of economic development. This
sec-tor has been affected by various crises throughout its hissec-tory – most recently, the 2008 financial and economic crisis. In response, banking institutions have had to make diverse changes to their procedures and deal with new concerns related to changes within markets. One of the main recent developments in this sector is the new commercial function assigned to bank branch front-office employees, who have become responsible for selling financial products and services, as well as recruiting and retaining clients. As a result, the sector needs new employee performance evaluation methods in line with banks and staff members’ requirements. This study combined fuzzy cognitive mapping techniques and the system dynamics (SD) approach to develop a well-informed perfor-mance analysis system for assessing bank branch front-office employees. The proposed system was validated by the Business Process Management Competence Center director at Millennium BCP – a Portuguese private banking corporation. The main difference between the model constructed in the present research and current evaluation practices is that the criteria were collected directly from multiple specialists working at different commercial banks, who deal daily with this decision problem. The model’s theoretical and practical implications are also discussed.
Keywords: bank branch front-office employee, fuzzy cognitive map (FCM), performance evaluation,
problem structuring methods (PSMs), system dynamics (SD).
Introduction
The banking sector, which is part of the financial sector, is one of the main forces behind economic development (Ferreira et al., 2015). This impact has become more evident since the most recent economic and financial crisis, which significantly increased competition between banks. Between July 2007 and December 2008, the banking sector’s overall performance was the worst since the Great Depression, with many financial institutions losing most of their assets (Beltratti & Stulz, 2012). In response, banks have undertaken a deep restructuring of their modus operandi (García-Alcober et al., 2019), which has resulted in greater resilience and impermeability to market oscillations and made banks even more powerful, innovative economic agents. According to Ferreira et al. (2014, p. 709), “the increased intensity of com-petition has direct implications [… for] the way that banks approach costumers and how they define and apply their business strategy”.
To ensure their survival in the face of new market conditions, banks have focused on attracting and retaining customers. To this end, innovative forms of service have been intro-duced using multichannel distribution as a strategy to reach a larger number of customers through technological channels such as the Internet and smartphones. Nonetheless, the most important form of interaction continues to be through services provided by bank branches, which provide the foundation for unique relationships between clients and banking institu-tions through front-office employees. These branches are the strategic core of the image that banks seek to project, as well as the quality of the services provided. In this context, front-office employees play a fundamental role as they, first, represent the institutions’ values in relation to clients and, second, function as the key element of sales channels through these employees’ new commercial role.
In view of the above changes, bank branches need to have access to an analytical model facilitating performance evaluations of front-office employees. The model should take into consideration the dynamics of the system surrounding these workers in order to facilitate strategic decision making. The model needs to help bank managers assess whether their banks’ strategy and proposed objectives are being properly implemented by front-office em-ployees. Given this context, the present study sought to apply problem structuring methods (PSMs), namely, techniques for structuring and modeling decision problems within dynamic and complex systems in abstract and fuzzy domains. These methods have been described in the literature as tools with great potential for clarifying issues based on an understanding of the dynamics of the systems involved (Sterman et al., 2015; Christoforou & Andreou, 2017; Ladeira et al., 2019). The current research thus opted to apply PSMs to the evaluation of bank branch employees.
More specifically, cognitive mapping is widely acknowledged to be an important instru-ment for structuring and clarifying highly complex situations in order to support decision making. This tool facilitates the development of more transparent and coherent solutions that incorporate both objective and subjective aspects (Ferreira et al., 2017; Carayannis et al., 2018). Fuzzy cognitive maps (FCMs), in particular, are used to represent complex systems’ behavior through the representation and quantification of the intensity of cause-and-effect relationships between the systems’ components. According to Olazabal and Pascual (2016, p. 21), this method “is considered a useful tool for setting management objectives, [and] com-municating and learning, especially in the context of scenario planning applications driven by uncertainty and complexity”. The system dynamics (SD) approach, in turn, prevents
man-agement evaluations from being conducted only on an ad hoc basis. This approach ensures assessment models are more transparent, gives them a holistic view of the relevant systems, and measures what managers should focus on most closely (Santos et al., 2002). Thus, a good understanding of cause-and-effect relationships within systems makes identifying the most important evaluation measures possible so that interventions can lead to the desired results (Santos et al., 2002). A significant feature of the SD process is that it involves stakeholders, which is considered an added value in the literature (Santos et al., 2002; Torres et al., 2017).
Based on these complementary quantitative and qualitative methods, the present study sought to identify determinants of bank branch front-office employee performance through the integrated use of fuzzy cognitive mapping and the SD approach. A review of the rel-evant literature confirmed that no previous study has applied this dual methodology in this research context. The proposed approach, therefore, constitutes a significant contribution to the existing literature on employee performance evaluation, behavioral modeling, and operational research and/or management science.
The rest of this paper is organized as follows. The next section offers an overview of the literature on the banking sector and bank branch front-office employee evaluation. The third section introduces the methodology and some epistemological aspects. Section four describes the procedures followed to construct the proposed framework. The final section provides the study’s conclusions and presents some guidelines for further research.
1. Related literature
Banks’ survival depends essentially on their capability to respond to the needs of the market in which they operate, on the creation of a distinctive brand associated with quality, and on a constant search for new strategies and innovations (Jackson III et al., 2003). In this context, the multichannel distribution strategy consists of the use of various channels or different combinations of channels to deliver products and/or services to the final consumer. This can be done either through direct distributors such as stores, sales people, or the Internet or through indirect distributors such as brand representatives and distributors (Wilson & Daniel, 2007; Bellou et al., 2015). In particular, this strategy in the banking sector is based on using multiple channels for banking activities, which has become banks’ most popular business model (Ho & Wu, 2009). To avoid losing major clients, banks choose to use digita-lization to create superior experiences and thus avoid the erosion of these institutions’ client base (Reydet & Carsana, 2017).
After bank branches appeared and the client manager role was created, the first signs of innovation in these facilities were the emergence of automatic teller machines that provide safe access to bank accounts. Subsequently, the banking sector invested heavily in telephone services with two main purposes: (1) to ease the flow of information to clients and provide options for conducting some operations through call centers; and (2) to conduct telemarket-ing. Following the Internet’s rise, websites were launched as a new channel for clients to carry out operations without needing to go to physical customer service providers, regardless of whether these services were financial operations (Ramos et al., 2011; Hoehle et al., 2012; Reis et al., 2019). In the new millennium, clients are much more connected to technology through their smartphones, and this has compelled banks to structure banking applications that allow clients to consult and manage their accounts, cards, and balance in real time. Customers can
also make transfers or other payments through their telephones (Hoehle et al., 2012). In this context, comparisons need to be made of the pros and cons of bank branch presence in this multi-channel strategy. Since bank branches represent the way that banks define their market strategy and manage their service quality, branches clearly play an important role in banks’ sustainability (Ferreira et al., 2016). Bank branches’ physical spaces also have a commercial function, with employees seeking to attract new clients and sell financial products and/or services (Eskelinen & Kuosmanem, 2013). These branches are also an extremely important connection between banks and elderly clients who are unable to use other distribution chan-nels (Szopiński, 2016).
In general, bank branches are the main link between clients and their bank, disseminating these institutions’ values and commitment to clients, as well as requiring quality standards fulfillment since branches are the banks’ public image (Athanassopoulos, 1997; Quaranta et al., 2018). Because bank branch front-office employees play such an important role, their performance is clearly fundamental to banks’ success as these workers must participate in all processes related directly to clients. Front-office employees are also responsible for com-mercial aspects since these staff members are in the forefront of efforts to contact the public (Eskelinen & Kuosmanen, 2013; Bellou et al., 2015; Kearney et al., 2017). Overall, these em-ployees are the “face of the company (i.e., bank)” and the agents who directly ensure service quality (Pimpakorn & Patterson, 2010).
The need to evaluate front-office employees’ performance is urgent, including the quality of services they provide to clients, primarily because these workers convey banks’ objectives and provide the main commercial contact with customers (Lee et al., 2011; Eskelinen & Kuosmanen, 2013). They have to accomplish their banks’ proposed quantitative or qualitative goals (Arbore & Busacca, 2009; Ferreira et al., 2012). Employees can generate competitive advantages for their organization (Małachowski & Korytkowski, 2016) by providing unique resources. Thus, front-office employee performance evaluations allow top managers to con-duct accurate analyses of service processes by identifying errors in service provision and to set new goals and guidelines for creating and implementing new strategies at this level. This process culminates in the elimination of inefficiencies and development of competitive advantages (Santos et al., 2008; Yang, 2009; Herrera-Restrepo et al., 2016).
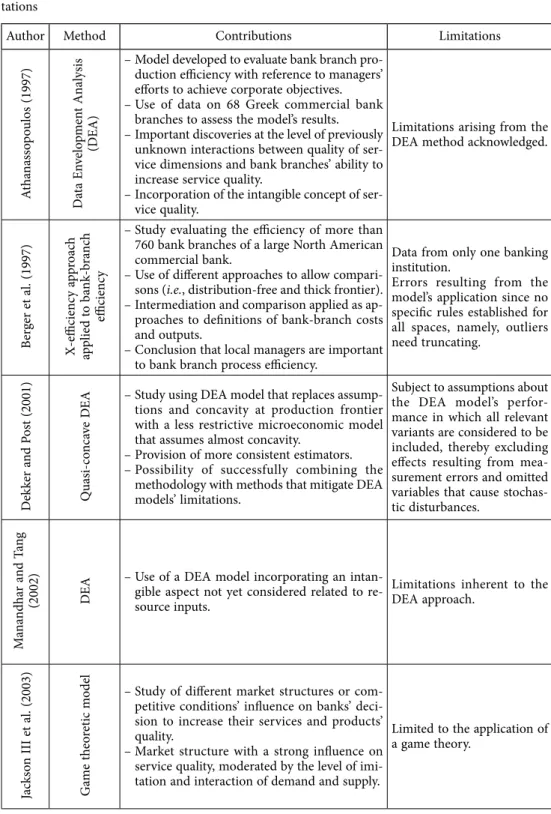
To simplify the information obtained from measurements that are part of performance management processes, models based on different techniques have been created, offering distinct insights into the same problems and providing valuable findings to researchers. How-ever, none of these systems is without limitations. Various authors have attracted attention over the years by using innovative methods that seek to eliminate flaws in previous studies. Table 1 presents some of the major contributions to the knowledge about this topic.
As previously mentioned, perfect approaches or models do not exist. This problem be-comes even more significant when applied to an area as complex as the banking sector. When front-office employee evaluations are conducted, an additional layer of subjectivity can be verified. Thus, some limitations are highlighted in Table 1, which fall into two major categories. The first is sample limitations, including numerical or geographical restrictions, a reduced number of banks covered by the study, or the unclear definition of the criteria used to evaluate bank branch front-office employees. The second category is the absence of dynamic analyses of variables considered in the research. Acknowledging the existing models’ general limitations is a fundamental step toward adopting new complementary approaches to overcome these problems.
Table 1. Evaluation models of bank branches and/or front-office collaborators: contributions and limi-tations
Author Method Contributions Limitations
At ha na ss op ou los (1997) D at a En ve lo pm en t A na lysi s (D EA)
– Model developed to evaluate bank branch pro-duction efficiency with reference to managers’ efforts to achieve corporate objectives. – Use of data on 68 Greek commercial bank
branches to assess the model’s results. – Important discoveries at the level of previously
unknown interactions between quality of ser-vice dimensions and bank branches’ ability to increase service quality.
– Incorporation of the intangible concept of ser-vice quality.
Limitations arising from the DEA method acknowledged.
Ber ger et al . (1997) X-efficien cy a pp ro ac h ap plie d t o b an k-b ra nc h efficien cy
– Study evaluating the efficiency of more than 760 bank branches of a large North American commercial bank.
– Use of different approaches to allow compari-sons (i.e., distribution-free and thick frontier). – Intermediation and comparison applied as ap-proaches to definitions of bank-branch costs and outputs.
– Conclusion that local managers are important to bank branch process efficiency.
Data from only one banking institution.
Errors resulting from the model’s application since no specific rules established for all spaces, namely, outliers need truncating. D ek ker a nd P os t (2001) Q ua si-co nc av e D
EA – Study using DEA model that replaces assump-tions and concavity at production frontier
with a less restrictive microeconomic model that assumes almost concavity.
– Provision of more consistent estimators. – Possibility of successfully combining the
methodology with methods that mitigate DEA models’ limitations.
Subject to assumptions about the DEA model’s perfor-mance in which all relevant variants are considered to be included, thereby excluding effects resulting from mea-surement errors and omitted variables that cause stochas-tic disturbances. M an an dh ar an d T an g (2002) DE
A – Use of a DEA model incorporating an intan-gible aspect not yet considered related
to re-source inputs.
Limitations inherent to the DEA approach. Jac ks on III et al . (2003) Ga m e t he or et ic m ode l
– Study of different market structures or com-petitive conditions’ influence on banks’ deci-sion to increase their services and products’ quality.
– Market structure with a strong influence on service quality, moderated by the level of imi-tation and interaction of demand and supply.
Limited to the application of a game theory.
Author Method Contributions Limitations Ka ra tep e et al . (2005) M ul ti-s ta ge , m ul ti-ph as e, a nd m ul ti-s am ple ap pr oac hes
– Service quality scale developed based on a model with multiple stages, phases, and sam-ples.
– Use of a 20-item questionnaire as a measure-ment instrumeasure-ment to assess clients’ perceptions of the level of service quality.
Acknowledgment of the need to carry out further studies to validate the measurement of service quality based on the four factors presented.
W u et al . (2006) D EA a nd n eura l net w or ks a pp ro ac
h – Construction of a DEA model with neural
networks in order to obtain a more robust analysis in which more efficient units are identified and more patterns of good perfor-mance are explored
– Research addresses some DEA model limita-tions in terms of flexibility and assumplimita-tions.
Few theoretical studies on this approach, which re-quires more research. Sample confined to a single bank. O liv eira a nd H ip pe l (2011) Q ua nt ita tiv e exp lo ra tio n of lo cu s o f inn ova tio n
– Exploratory quantitative model that address-es the need for innovation in servicaddress-es imple-mented by users themselves.
– Focus on retail banking and commercial ser-vices.
Limitations of samples men-tioned. Pa radi et al . (2011) Tw o-s ta ge D EA
– Model constructed to address managers’ crit-icisms, avoid a single perspective, and reflect better the multifunctional nature of operating units.
– Model’s two phases simultaneously allow a comparative evaluation of operational units’ performance and the aggregation of efficiency results from the first phase, thereby generating a composite index for each unit.
Use of only one financial in-stitution.
Limitations inherent to the DEA technique. Es ke lin en et al . (2014) Ext en de d va lue efficien cy a na lysi s
– Study focused on extending value engineering analysis through factual or non-factual com-parative evaluations of profits and returns. – Approach with a greater capability for
dis-crimination than an administrative evaluation dataset.
Limitations due to the mod-el.
Sample based on only one financial institution.
Author Method Contributions Limitations Fer reira et al . (2016) Fuzzy cog ni tiv e m ap pin
g – Model focused on creating a holistic vision in order to identify service quality determinants
in a bank branch and their cause-effect rela-tionships.
– Constructivist decision-support model using banking specialists to obtain results.
– Identification of cause-and-effect relation-ships.
– Study the only one to apply this methodology to bank-branch performance evaluations. – Approach allowing a gradual development of
knowledge and learning process.
Study failed to conduct dy-namic analyses of identi-fied variables in the holistic structure. Q ua ra nt a et al . (2018) M ul tidim en sio na l ap pr oac h b as ed o n in dex es
– Study focused on providing a combination of prior studies’ strengths through a three-step procedure.
– First step includes a large number of efficiency indices generated by all existing theories and methodological approaches.
Sample includes a single bank in a single region. Insufficient research on the model’s contributions and limitations in the literature. Overly technical approach that fails to take into account organizational or manage-ment implications.
The present study sought to address the existing models’ limitations. The objective was to create a broader, clearer, more transparent, and more informed conceptual model in this research context, which needs to facilitate the identification and comprehension of evalua-tion criteria and their cause-and-effect relaevalua-tionships. To this end, a constructivist perspective was adopted, and fuzzy cognitive mapping was integrated with the SD approach. FCMs can be the starting point for decision makers who need to identify the criteria to be included in assessment models and the degree of intensity of the cause-and-effect relationships among these criteria. The SD approach, in turn, enables analyses of the decision-support system, creating and testing scenarios and predicting the behavior of specific variables and/or the entire system.
In the present study, the combined use of these methods generated a holistic understand-ing of the dynamics of bank branch front-office employee performance. This approach helped increase transparency in the decision-making process whenever conflicts arose between mul-tiple variables, actors, points of view, uncertainties, and interests (Liao, 2008; Ackermann, 2012). The next section presents the methodologies applied.
2. Methodology
The current research had a constructivist orientation based on the argument that knowledge is built through personal experiences and learning processes (Barger et al., 2018). According to this constructivist epistemological stance, societies, cultures, standards, and social contexts play an important role in building each individual’s perceptions (Hursen & Soykara, 2012). Within this logic, high complexity decision problems emerge that require the use of PSMs because of the problems’ unmanageable structure. PSMs are often called “soft operations End of Table 1
research” or “soft systems”, and these methods are effective tools with which trained facilita-tors can help groups facing challenges on a decision-making level (Marttunen et al., 2017; Smith & Shaw, 2019). Fuzzy cognitive mapping is one of the most well-known PSMs. 2.1. Fuzzy cognitive mapping
Cognitive maps are an aggregation of organized ideas structured into hierarchies, with cause-and-effect relationships represented by arrows. In other words, cognitive mapping functions as an epistemological structure with which individuals can organize their thoughts, experi-ences, and values (Faria et al., 2018). The relationships between variables and/or decision criteria in the defined, hierarchical network of ideas can be positive or negative depending on the nature of the cause-and-effect relationships (Ribeiro et al., 2017). That is, cognitive maps are mental models that individuals create during analyses of problems, and each cognitive structure depends on each person’s rationalization, cognition, and perspective (Peña et al., 2008; Carayannis et al., 2018).
Cognitive mapping is widely acknowledged as an important instrument for structuring and clarifying highly complex situations during decision-making processes, thereby generat-ing more transparent, coherent solutions that incorporate objective and subjective aspects (Ferreira et al., 2017; Carayannis et al., 2018). This means that, regardless of its subjective nature, cognitive mapping has a strong potential for structuring problems mainly because this technique, first, promotes exchanges of ideas and dialogues between decision makers. Second, it reduces the omission of important criteria and, third, successfully handles quali-tative variables. Fourth, cognitive mapping allows the decision-making process to stimulate continuous learning, as well as a deeper understanding of the defined criteria and causali-ties. Fifth, this tool facilitates the organization of difficult decision problems and, last, helps decision makers to develop and implement strategic guidelines (Ferreira et al., 2012; Canas et al., 2015; Faria et al., 2018).
The present study used an FCM as an upgraded form of cognitive mapping in order to determine the causal structure of the decision problem in question and the social systems involved (Ziv et al., 2018). The map generated for the current research introduced facilita-tors to the involved individuals’ different perspectives and perceptions, which is what makes cognitive mapping a knowledge-based methodology (Ladeira et al., 2019). Fuzzy cognitive mapping first appeared in Kosko’s (1986) work, as the cited author added the fuzzy logic ap-proach developed in the 1960s to traditional cognitive mapping (Ribeiro et al., 2017). Fuzzy logic is an extension of traditional dual logic, which helps decision makers to deal with problems characterized by ambiguity due to the absence of well-defined decision criteria or more reliable forms of variables. Thus, fuzzy cognitive mapping is the ideal approach to the description of real, behavioral problems in which imprecise quantitative data can be observed (Pluchinotta et al., 2019).
This method strengthens cognitive mapping by introducing fuzzy values between [–1, 1] (i.e., real values), which are attributed to the criteria and their cause-and-effect relationships (Ferreira et al., 2017). Fuzzy cognitive mapping was developed in order to address the criti-cism that cognitive maps lack the option of including dynamic analyses of interactions be-tween criteria within the decision-support systems depicted in these maps. Dynamic analysis is necessary to predict accurately changes in the systems’ components (Ziv et al., 2018). The combination of fuzzy logic with cognitive maps facilitates representations of vague knowl-edge and approximations involving rationalization when uncertainty is present in variables
(Pluchinotta et al., 2019). FCMs are a simple approach to extracting individuals’ mental models that contain various forms of knowledge about specific domains or systems, thereby allowing human knowledge to be incorporated into decision making within the specific con-texts under study (Ladeira et al., 2019). FCMs are thus dynamic models with intelligible content that is fully executed and represented (Ladeira et al., 2019).
FCMs’ concepts work as the decision-support system’s key drivers, with connections rep-resenting cause-and-effect relationships between any two concepts Ci and Cj. Feedback can be obtained by measuring interactions between any two concepts (Kok, 2009; Ziv et al., 2018). In terms of decision criteria or concepts, a bivalent logic is followed, in which fuzzy values between [0, 1] (i.e., real values) can be assigned. The relationship (i.e., arches) weights between criteria can be measured using a trivalent logic in which fuzzy values between {–1, 0, 1} can be assigned. This means that causality can be negative, neutral, or positive (Ferreira et al., 2017).
Positive causality indicates a stimulating relationship, whereas negative causality implies an adverse relationship between concepts (Kok, 2009). Thus, the information derived from FCMs retains cognitive mapping’s qualitative component but adds a more quantitative ap-proach through which the represented system’s dynamics can be analyzed. This provides op-portunities to analyze future scenarios (Ziv et al., 2018). Figure 1 is an example of an FCM showing the causality between concept nodes and their weights.
FCMs are, therefore, an approach used to represent the behavior of complex systems through the representation of cause-and-effect relationships. According to Olazabal and Pas-cual (2016, p. 21), FCMs are “considered a useful tool for setting […] management objectives, [as well as] communicating and learning […, e]specially in the context of scenario planning applications driven by uncertainty and complexity”. Even though this approach has some limitations (see Özesmi & Özesmi 2004; Olazabal & Pascual 2016), FCMs are frequently recommended as a way to deal with highly complex issues. These maps’ simplicity and flex-ibility allow this technique to be applied in many areas, and FCMs’ benefits can be maximized when combined with SD (Kok, 2009).
2.2. System dynamics
All complex dynamic systems are characterized by counterintuitive behavior caused by agents’ interactions through time, which is a consequence of constant changes in sys-tems and their intrinsic features (Franco et al., 2018). The decision problems addressed by SD are aggravated by two conditions. First, SD involves variables whose amounts change over time, and, second, the variables include complex feedback structures (Sederati et al., 2019). Learning is thus nonlinear in complex, dynamic systems, becoming as a result a time-con-suming process.
SD-related problems are mainly due to individuals’ use of heuristics when evaluating the patterns of event causalities in these systems, making decision makers insensitive to even quite central components of complex systems (Sterman, 2002). Consequently, important ele-ments such as the systems’ internal feedback, nonlinear relationships, and inability to process new information or decisions within the time available are not considered. These omissions create temporal delays between the actions taken in the systems and the verification of the results and/or consequences (Papachristos, 2019). In other words, the causes and their effects are separated in time, which, when added to the multiple relationships among the variables involved, undermines the understanding needed to determine exactly what events triggered the systems’ behavior (Sterman, 2002; Papachristos, 2019).
SD method was introduced by Forrester (1961) – in the form of modeling method – to map and explain industrial problems through control theory. Despite its origins in con-trol theory and servomechanisms, which were developed within the “hard” sciences (i.e., engineering and mathematics), SD is fundamentally interdisciplinary. It can be applied to human behavior within psychology, economics, and other social sciences because learning about complex behavioral systems requires more than simple mathematical models (Sterman, 2002). This approach is, however, in part a methodology used to develop and test formal mathematical models and computational simulations of complex systems’ linear and nonlin-ear dynamics, in order to analyze their behavior over time (Sterman, 2002; Song et al., 2017). The SD approach facilitates the identification of structural elements and policies that lead to decisions, successfully overcoming nonlinear relationships’ “noisy” environment generated partly by decision makers’ perceptual and cognitive limitations (Papachristos, 2019). This approach seeks to split the decision-support system into smaller fragments, examining each element as a way to analyze change impacts and results in terms of the remaining elements under study (Sederati et al., 2019).
SD models are usually formulated following a logic based on higher order, nonlinear, and stochastic differential equations in order to represent the relevant decision makers’ rules, natural processes, and physical structures (Sterman, 2002). When numerous nonlinear re-lationships are included, SD models cannot be estimated using numerical methods because these are higher-order models, as can be seen in Eq. (1) (Sterman, 2002):
( )=
∫
( )
−( )
+ 0 0 ( ) . t t t tStock Inflow s Outflow s ds Stock , (1)
in which Stock is the calculated final value and t( )t 0 is the initial time. In addition, the rates Inflow s and
( )
Outflow s represent the stock’s inflows and outflows, respectively. The( )
( )
Inflow s portray the value of inputs at any time s, between the initial time t0 and the cur-rent time t, and the Outflow s relate to the value of the outputs at any time s, between the
( )
Figur e 2. E xa m ple o f a s to ck-a nd-flo w di ag ra m (s our ce: J ia et al . 2019, p . 34)
initial time t0 and the current time t. Finally, the stock exchange’s net rate will be equal to the Outflow s subtracted from the
( )
Inflow s (Sterman, 2002; Sing et al., 2019). Figure 2( )
privides an example of a stock-and-flow diagram.Given the above specifications, the SD approach allows decision makers to understand and analyze how each element or segment within systems interacts with other system ele-ments, based on a diagram such as the one shown in Figure 2. This facilitates the formulation of predictions about decision-support systems’ behavior (Sederati et al., 2019). Therefore, computational modeling software can be used to understand better the connections between systems’ structure and behavior and to look for endogenous explanations of dynamic prob-lems. These findings, in turn, help decision makers establish policies that lead to the desired changes (Sederati et al., 2019).
The present study had the objective of developing a holistic perspective on the decision problem under study. SD combined with fuzzy cognitive mapping provided tools not only to conceptualize and implement performance evaluation models but also to analyze and use the information obtained during performance assessment, thereby providing data to the top management making the decisions (Santos et al., 2002). This methodology included simulations that added a more dynamic component to the FCM, working alongside nar-rative structuring, gathering feedback from key drivers (Kok, 2009), and thus following a constructivist logic. Despite its limitations, SD proved to have remarkable features ideal for dealing with dynamic, complex decision-support systems. The present results demonstrated why SD is the preferred method used to model and simulate complicated system problems, with known applications in various fields of research.
3. Application and results
Decision problem structuring phase is of great importance as the structure produced serves as a basis for the remaining phases of the decision-making process (Bana e Costa et al., 1997; Rodrigues et al., 2017). Guarnieri et al. (2016, p. 1109) report that, “by structuring the prob-lems, actors feel more comfortable stating their values and preferences and as a result, create a more democratic environment for decision-making”. In this phase, decision makers also clarify their goals and motivations with respect to the model.
Belton and Stewart (2002) argue that, to structure and understand a decision problem fully, a panel of decision makers (i.e., experts) needs to be involved. According to Rosenhead (2006, p. 762), PSMs, such as the fuzzy cognitive mapping and SD approaches, “are designed for deployment in a group format [… They] permit the simultaneous consideration of alterna-tive perspecalterna-tives […, and they] are participaalterna-tive in nature, with interaction[s] among partici-pants, and between participant[s] and facilitator(s)”. In the current study, a panel of seven decision makers was created based on the following guidelines. First, the facilitators needed to ensure the panel could function well as “a group of people working together to explore an issue of common concern (say, five to ten persons)” (Belton & Stewart, 2002, p. 40). Second, the participants had to be able to identify the issue’s components, and all the experts involved in the process had to share a broad understanding of the topic. Third, the participants needed to have knowledge and experience in the banking industry and, in particular, bank branch front-office employee evaluations. Last, the panel had to be heterogeneous in terms of gender, age, and professional experience. Notably, the objective of the expert panel meetings was not to achieve representativeness – or the ability to form generalizations – but rather to maintain
a strong focus on process. The latter would ensure an enriched discussion of bank branch front-office employee evaluation. Bell and Morse (2013, p. 962) argue that, in this type of research, “there is less emphasis on outputs per se and more focus on process”. A facilitator (i.e., researcher) took part in the group sessions, assuming responsibility for mediating the decision-makers’ interactions, as well as registering the results.
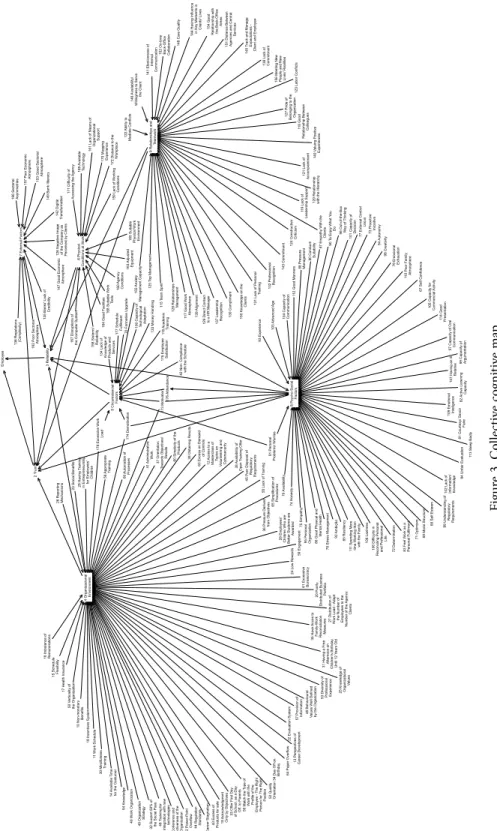
3.1. Collective cognitive map and causal intensity assessment
The first session started with initial introductions of each participant, as well as an expla-nation of the methodologies to avoid any eventual misunderstandings among the group members. The following trigger question was then asked: “Based on your values and profes-sional experience, which factors and characteristics influence bank branch front-office employee performance?”. The subsequent debate was facilitated by the “post-its technique” (Eden & Ackermann, 2001), which enabled for the construction of a group cognitive map.
During this process, the decision makers were invited to share values and experiences and write each idea on a separate post-it note. The post-it notes were marked with either a minus (–) or plus (+) sign whenever a negative or positive cause-and-effect relationship was found between the criteria and the employees’ evaluation (i.e., a given criterion negatively or positively influences bank branch front-desk employee performance) (Ribeiro et al., 2017). The debate continued among the experts until the group expressed generalized satisfaction with the number and depth of the identified criteria.
According to Ferreira (2016, p. 135), “the construction of a collective cognitive map assumes a subjective nature strongly dependent on the facilitator’s skills and deeply influenced by the per-ceptions of the group”. This process produced about 180 different criteria that represented the collective perception of this particular group of decision makers. The second stage could then begin, during which the decision makers were invited to create clusters within the wide range of criteria generated by their discussion. The criteria were grouped by areas of concern, with the result that six different areas were identified. These were: (1) Organizational Environment; (2) Circumstantial Factors; (3) Physical Conditions at Work; (4) External Factors; (5) Psycho-Social Factors; and (6) Relationships and Teamwork. In addition, trust and credibility were considered strategic criteria with connections to all clusters. The first session continued with the facilitator asking the participants to organize the criteria by order of importance inside each cluster. This facilitated the construction of a simple collective cognitive map using the Decision Explorer software (https://banxia.com/), which was subsequently collectively ana-lyzed and validated by the group (see Figure 3).
The second group session was convened to continue the structuring process and was at-tended by 6 out of the 7 initial decision makers. According to the literature (e.g., Azevedo & Ferreira, 2019), this situation is common, and the absence of one expert does not jeopardize decision-making processes. In addition, the number of participants was still in the range suggested by the relevant literature.
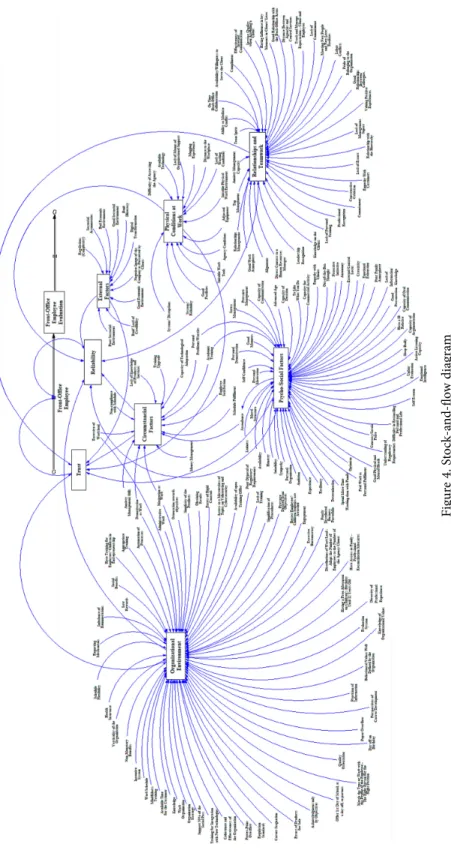
In this second session, fuzzy logic was applied to the cause-and-effect relationships iden-tified in the collective cognitive map. Intensity values between –1 and 1 were assigned to each cause-and-effect relationship. This procedure was accompanied by intense debate and negotiation due to the different perspectives discussed. However, the results permitted the construction of an FCM, which was latter transformed into a stock-and-flow diagram using the Vensim PLE Plus software (https://vensim.com).
Figur e 3. C ol le ct iv e cog ni tiv e m ap 1 Front-OfficeEmployee 2 T rust 3 Reliability 4 OrganizacionalEnvironment 5 Circumstancial Factors 6 Physical Conditions at Work 7 External Factors 8 Psycho-Social Factors 9 Relationships and Teamwork 10 Non-monetary Benefits 11 Work Schedule 12 Access to a
Masterclass ofTopics onVolunteering and Cybersecurity
13 Perspectives of Career Development
14
Available T
ime
for the Costumer
15 ScheduleFlexibility 16 Imbalance of Remunerations 17 Health Insurance 18 Incentives System 19 Acknowledgment Only by Objectives 20 Poorly Distributed Business Portfolio 22 Evaluation System 23 Social Benefits 24 Low Rewards 25 Knowledge of Organizational Values 26 Reporting Mechanisms
27 Distribution of Work Load -
Adapt
the Number of Employees to the
Number of the
Agency
Clients
28 Employees' Children Who are Better Studenrs areAwarded
29 Having T
raining
in Entrepreneurshipfor Employees'
Children
30 MindfulnessTraining
31 Having a FreeAfternoon onChildren's Birthday Until 12 Y
ears Old
32 Suuport 50% of the Social Pass
33 Offer First Day of School, as a DayOff, to Parents 34 Day Off onBirthday
35 Have
Acces to
Family-Work ReconciliationMeasures 36 Pressure Derivedfrom Objectives
37 Orientation Towards Objectives/ Results 38 Availability of Open T raining Offer 39 Obtaining Results 40 Work Organization 41 AdministrativeWork 42 Non- Compliancewith the Schedule
43 Excess ofProducts for sale 44 RegulationStandards
45 Poor Disposal ofRegulatory Requirements
46 T
raining for
Integration with newtechnologies
47 Career Stagnation
48 Behavioural
Values Well Defined by the Organization
49 Organization
Strategy
50 V
erticality of
the Organization
51 Coherence and Effectiveness of theOrganization
52 Quality Orientation
53 Diversity of Professional Experience
54 Knowledge
55 Lack of T
raining
56 Match the T
ype of
Work with the Profile of the Employee - The Right Person for The Right
Position 57 Provision ofInformation 58 Appropriate Training 59 Engagement 60 Simplicity of the Products 61 Excessive Bureaucracy 62 Power-PointOverflow 63 Excess on Demand of Controls 64 Paper Overflow 65 Simplification ofProcedures 66 Automation of Processes 67 Self Confidence 68 Self Esteem 69 Moral Structure 70 Formative Upgrade 71 Optimism 72 Determination 73 ProactiveIniciative 74 Honesty 75 Simpathy 76 Availability 77 External Control Locus 78 Stress Management 79 Emocional Exhaustion 80 Conduct/Suitability 81 Courtesy/ Savoir Faire 82
Active ListeningCapacity
83 Feel Work as a Personal Fulfilment
84 Unfair Evaluation
85 Resiliency
86 Good Physical and
Mental Health
87 Empathy With the
Clients 88 Pressure Management 89 Capacity pf Argumentation 90 T o Enjoy What Y ou Do 91 Personal Problems/ Worries 92 Ambição 93 Experience 94 Autonomy 95 Personal Organization 96 Out-of-the-Box Way of Thinking
97 Capacity of OralCommunication
98 Creativity
99 Understanding ofRegulatory Requirements 100 Capacity of Technological Adaptation
101 Capacity ofDecision
102 Lack of Information/ Knowledge
103
Advanced
Age
104 Capacity of Communication
105 Capacity for Commercial
Activity
106 Difficulty in
Reconciling Personaland Professional
Life
107 Having an ill
Relative
108 Laziness
109 EmotionalInteligence 110 Poor FamilyAtmosphere
11
1 Spending More time Working than with the Family
112 Good Manners 113 Sleep Badly 114 Good Presentation 115 T eam Spirit 116 Academic Training 117 Good WorkAtmosphere
118 Good
Relationship Between
Colleagues
119 Lack of
Leadership Support
120 Relationship with the Hierarchy 121 Lack ofAccompainiment 122 Ability to Mediate Conflicts 123 Labor Conflicts 124 Constructive Criticism 125 T op Management
126 Negative Image of the Company as Perceived by Clients
127 Pride ofBelonging to the Organization
128 RelationshipsManagement 129 Direct Contact to a HR Manager
130 Compliment
131 Lack of Personal
Training
132 ProfessionalRecognition
133 Money Handling
134 Lack of Knowledge of Products andServices
135 Banks' Lack of Credibility 136 Regulations(Complexity) 137 LeadershipRecognition 138 Lack of Commitment 139 Alignment 140 V
aluing PositiveExperiences
141 Efectiveness of
Internal
Communication
142 DigitalTransformation
143 Commitment
144 Having Influencein Key Moments inClients' Lives
145 T
rack and Manage Expectations
-Client and Employee
146 Availability/ Willingness to Serve the Client 147 Good Economic Atmosphere 148 Care Quality 149 Bank Iliteracy 150 Knowledge on the Clients
151 Distance Between Agencies and Central
Services
152 On-time Back-Office Collaboration
153 Good SectorialAtmosphere
154 Good
Relationship with the Back-Office
Areas
155
Anxiety
Management Capacity
156 Meeting New People and New Lives' Realities
157 Poor Economic Atmosphere 158 Sistems'Reliability 159 Lack of Working Conditions 160 Agency Conditions
161 Lack of Means ofOrganizational
Support
162 Poor SectorialAtmosphere
163
Adjusted
Equipment
164 Good Facilities
165 Suitable Physical Work Environment 166 Sectorial Asymmetries
167 Disruptions of the Computer System
168 Suitable Work Tools 169 Available Technology 170 Mugging Experience 171 Difficulty of Accessing the Agency 172 Distance to the Workplace 173 Motivation 174 Demotivation 175 EmployeeSatisfaction 176 Atttendance 177 ScheduleFulfilment 178 Excessive Work Load -- --
-Using the SD approach, a dynamic decision-problem model was then developed in order to verify the system’s behavior over time. The basis for this procedure was the cognitive map previously generated and approved by the panel of experts, as well as the fuzzy values as-signed by the decision makers to each cause-and-effect relationship highlighted in this com-plex system. Figure 4 presents the stock-and-flow diagram obtained, which was next used to create and test scenario simulations and to conduct dynamic analyses of the variables.
A set of simulations were run to test the model’s robustness, identify the criteria with the most impact on front-office employee evaluations, as well as the criteria’s most important relationship dynamics, and observe the model’s behavior in the face of changes. This simula-tion procedure, in turn, facilitated a battery of dynamic analyses.
3.2. Dynamic analysis of bank branch front-office employee performance
In this study, the proposed model was tested by running 15 simulations, which allowed for the comparison of different scenarios. Before the testing phase, different aggregation equa-tions were created based on the fundamental features of FCMs and SD, as shown in Eq. (2). For the strategic criteria of trust and reliability, these equations were used to gather the previ-ously calculated values and add to them the decision-maker panel’s contributions regarding the relationships between each cluster and the strategic criteria, as expressed in Eqs (3) and (4) (although similar in terms of mathematical formulation, these equations are based on different degrees of intensity).
Σ = ∫ ; 100 Determinantsi Clusteri (2)
(
)
= = ∫ + ∑
1 ln n ; iTrust Clusteri InitialValueof Clusteri (3)
(
)
= = ∫ + ∑
1 ln n . iReliability Clusteri InitialValueof Clusteri (4)
However, the flow variable was calculated differently from the remaining criteria. To achieve scale normalization, logarithms were used to obtain similar results to the remaining stocks, as shown in Eq. (5). Finally, the product of the variable front-office employees’ evalu-ation was calculated by following a normalizevalu-ation logic similar to that applied to the clusters, although only one variable was considered, as expressed in Eq (6). In all cases, the scales were normalized to help the panel members make cognitive comparisons:
Front Office Employee- =ln
(
Trust Trust s InitialValue Reliability Reliability s InitialValue+ ’ + + ’ .)
=
(
+ + +)
- ln ’ ’ .
Front Office Employee Trust Trust s InitialValue Reliability Reliability s InitialValue ; (5)
= ∫
-- ’ .
100
Front Office Employee
Front Office Employees Evaluation (6)
Several simulations were run to test the decision-support system’s robustness and ob-serve the criteria with the most impact on employee evaluations, as well as to analyze the model’s behavior before changes. These simulations allowed the system’s performance to be monitored under business anomalous conditions (Torres et al., 2017). The runs performed
Figur e 4. S to ck-a nd-flo w di ag ra m
facilitated a direct comparison of the curves obtained from the graphics so that, in addition to comparing the curves with the base scenario, different behaviors of variables over time could be verified.
All 15 simulations provided high-value information about the decision-support system’s behavior in scenarios such as economic and financial crises, improvements in bank tools and processes, changes in employees’ psychological conditions, or aggravations and/or improve-ments within specific clusters. Multi-cluster analyses were also performed that sought to measure criteria intensities when these variables were connected to more than one cluster. The attendance criterion, for instance, has two cause-and-effect relationships, and its role is unique in the system because the decision-maker panel considered that this criterion is dependent on psycho-social factors, as shown in Eq. (7):
= − 0.5+ - .
Attendance Psycho Social Factors (7)
Thus, one of the first observations made was the impact of the attendance criterion on the circumstantial factors cluster, which produced quite different curves and revealed varied behaviors from other clusters (see Figure 5).
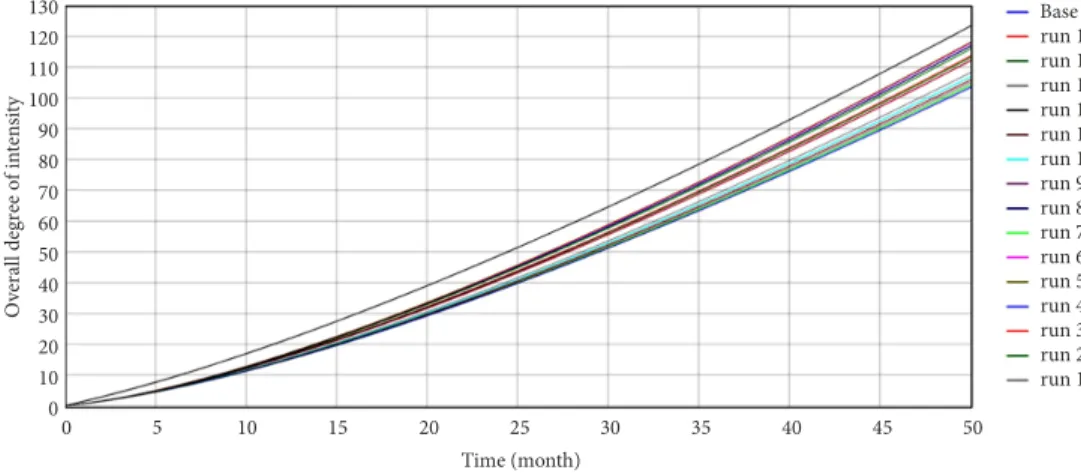
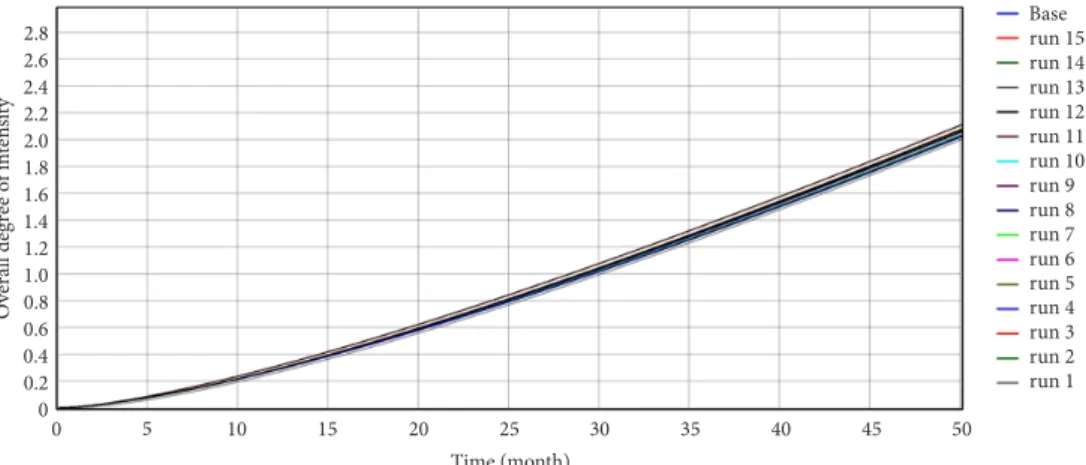
Basically, criteria that belong to more than one cluster are quite important to the system given that a change in them would have a stronger impact because this alteration would affect more than one cluster at the same time. Scenarios in which the change focus is on strategic criteria and their connections also produce deeper and more visible alterations as the criteria effects are more comprehensive. Figures 6 to 9 show the impacts of all scenarios for trust, reliability, front-office employees, and front-office employee evaluations.
Tables 2 and 3 reveal further details about the behavior of front-office employees and front-office employee evaluation determinants over time. All the determinants included in the stock-and-flow diagram can affect how front-office employee evaluations evolve overtime, so decision makers must constantly analyze and control the model’s possible variations and take corrective actions as needed.
Figure 5. All Runs for circumstantial factors
Base run 15 run 14 run 13 run 12 run 11 run 10 run 9 run 8 run 7 run 6 run 5 run 4 run 3 run 2 run 1 –1.0 –0.5 0 0.5 O verall degr ee o f in ten sity 1.0 1.5 2.0 2.5 3.0 0 5 10 15 20 25 30 35 40 45 50 Time (month)
Figure 6. All runs for trust
Figure 7. All runs for reliability
Figure 8. All runs for front-office employees
Base run 15 run 14 run 13 run 12 run 11 run 10 run 9 run 8 run 7 run 6 run 5 run 4 run 3 run 2 run 1 0 5 10 15 20 25 30 35 40 45 50 Time (month) 0 10 20 30 40 50 60 70 80 90 100 110 120 130 O verall degr ee o f in ten sity Base run 15 run 14 run 13 run 12 run 11 run 10 run 9 run 8 run 7 run 6 run 5 run 4 run 3 run 2 run 1 0 5 10 15 20 25 30 35 40 45 50 Time (month) 0 10 20 30 40 50 60 70 80 90 100 110 120 130 O verall degr ee o f in ten sity Base run 15 run 14 run 13 run 12 run 11 run 10 run 9 run 8 run 7 run 6 run 5 run 4 run 3 run 2 run 1 0 5 10 15 20 25 30 35 40 45 50 Time (month) 0 1 2 3 4 5 6 O verall degr ee o f in ten sity
As can be seen from the results presented in Tables 2 and 3, the dynamic analyses carried out provided a deeper understanding of the cause-and-effect relationships between deter-minants of bank branch front-office employee evaluation. Although statistical models are by far more popular in this research context, these models impose rigorous distribution as-sumptions, require particular scaling properties of the data, and remain limited in flexibility (cf. Castela et al., 2018). In addition, correlations do not necessarily imply causation, which means that, to model and analyze complex systems’ behavior, cause-and-effect relationships need to be examined carefully, thus strengthening the attractiveness of using the proposed FCM-SD-based approach.
3.3. Consolidation and recommendations
To test the validity of the model constructed, a meeting was held with the director of Mil-lennium BCP’s Business Process Management Competence Center, as this director is respon-sible for the introduction of new systems, processes, and business tools. At the meeting, the director was informed of the proposed decision-support system and its results. The meet-ing was intended to be a consolidation session since the goal was to elicit the opinion of a banking specialist who was considered neutral because he did not participate in the panel meetings. To this end, the session was divided into two parts, of which the first presented the methodologies adopted (i.e., fuzzy cognitive mapping and SD). In the second part, the results obtained and the model’s possible practical applications were discussed.
Overall, the interviewee provided quite positive feedback regarding the methods and results, thereby supporting the integrated use of FCM and SD in analyses of bank branch front-office employee performance. This dual-methodology use in the present study “allowed the opinions of different experts to be aggregated, creating a holistic framework that was shared by all, […] within which cause-and-effect relationships between variables could be detected and understood” (in the director’s words).
Despite the proposed model’s contextualized contents and the impossibility of extrapolat-ing the obtained results directly to other contexts, the interviewee felt this research was an example of how technology and processes can be successfully matched. The dual methodol-ogy fosters a useful “indirect approach to technolmethodol-ogy” (also in his words) because a strategic
Figure 9. All runs for front-office employee evaluations
Base run 15 run 14 run 13 run 12 run 11 run 10 run 9 run 8 run 7 run 6 run 5 run 4 run 3 run 2 run 1 0 0.2 0.4 0.6 0.8 1.0 1.2 1.6 1.8 2.0 1.4 2.2 2.4 2.6 2.8 O verall degr ee o f in ten sity 0 5 10 15 20 25 30 35 40 45 50 Time (month)
Ta ble 2. R un s f or f ro nt-o ffice em plo ye e e va lu at io ns Tim e (m on th) 0 1 2 3 4 5 6 7 8 9 10 Fr on t-Office Em plo ye e E va lu at io n: B as e 0 0.00693147 0.0188212 0.0347316 0.05394 0.0759131 0.100252 0.12665 0.154867 0.184709 0.216019 Fr on t-Office Em plo ye e E va lu at io n: r un 15 0 0.00693147 0.0208015 0.0391484 0.060839 0.0852099 0.111821 0.14036 0.170589 0.202324 0.235417 Fr on t-Office Em plo ye e E va lu at io n: r un 14 0 0.00693147 0.0188212 0.0348021 0.0541479 0.0763112 0.10088 0.127539 0.15604 0.186184 0.217809 Fr on t-Office Em plo ye e E va lu at io n: r un 13 0 0.00693147 0.0188212 0.0346649 0.0537414 0.0755297 0.0996423 0.125782 0.153716 0.183257 0.214249 Fr on t-Office Em plo ye e E va lu at io n: r un 12 0 0.00693147 0.0208015 0.0391484 0.060839 0.0852099 0.111821 0.14036 0.170589 0.202324 0.235417 Fr on t-Office Em plo ye e E va lu at io n: r un 11 0 0.00693147 0.0188212 0.0346229 0.0536157 0.0752857 0.0992528 0.125226 0.152976 0.182319 0.213104 Fr on t-Office Em plo ye e E va lu at io n: r un 10 0 0.00693147 0.0188212 0.0346407 0.0536691 0.0753896 0.0994189 0.125464 0.153293 0.18272 0.213595 Fr on t-Office Em plo ye e E va lu at io n: r un 9 0 0.00693147 0.0188212 0.0348206 0.054202 0.0764142 0.101042 0.127767 0.15634 0.186561 0.218266 Fr on t-Office Em plo ye e E va lu at io n: r un 8 0 0.00693147 0.0188212 0.0348153 0.0541868 0.0763858 0.100998 0.127706 0.156261 0.186463 0.218149 Fr on t-Office Em plo ye e E va lu at io n: r un 7 0 0.00693147 0.0188212 0.0346013 0.0535502 0.0751575 0.0990465 0.124929 0.152579 0.181813 0.212482 Fr on t-Office Em plo ye e E va lu at io n: r un 6 0 0.00693147 0.0188212 0.034839 0.0542556 0.0765162 0.101202 0.127993 0.156636 0.186932 0.218715 Fr on t-Office Em plo ye e E va lu at io n: r un 5 0 0.00693147 0.0188212 0.0348421 0.0542649 0.076534 0.10123 0.128033 0.15669 0.186999 0.218797 Fr on t-Office Em plo ye e E va lu at io n: r un 4 0 0.00693147 0.0188212 0.0346022 0.0535525 0.0751608 0.09905 0.124932 0.152579 0.18181 0.212473 Fr on t-Office Em plo ye e E va lu at io n: r un 3 0 0.00693147 0.0188212 0.0347586 0.0540198 0.0760662 0.100494 0.126993 0.15532 0.18528 0.216713 Fr on t-Office Em plo ye e E va lu at io n: r un 2 0 0.00693147 0.0188212 0.0347496 0.0539933 0.0760155 0.100414 0.126879 0.15517 0.185091 0.216483 Fr on t-Office Em plo ye e E va lu at io n: r un l 0 0 0.008258 0.0217372 0.0390774 0.0594887 0.0824503 0.107591 0.134635 0.163364 0.193607 Ta ble 3. R un s f or f ro nt-o ffice em plo ye e Tim e (m on th) 0 1 2 3 4 5 6 7 8 9 10 Fr on t-Office Em plo ye e: B as e 0.693147 1.18897 1.59104 1.92084 2.19731 2.43387 2.6398 2.82168 2.98423 3.13098 3.26457 Fr on t-Office Em plo ye e: r un 15 0.693147 1.387 1.83469 2.16906 2.43709 2.66116 2.85383 3.02289 3.1735 3.30931 3.43294 Fr on t-Office Em plo ye e: r un 14 0.693147 1.18897 1.59809 1.93458 2.21633 2.4569 2.66588 2.85008 3.01441 3.16253 3.2972 Fr on t-Office Em plo ye e: r un 13 0.693147 1.18897 1.58437 1.90765 2.17883 2.41126 2.61401 2.7934 2.95402 3.09923 3.23162 Fr on t-Office Em plo ye e: r un 12 0.693147 1.387 1.83469 2.16906 2.43709 2.66116 2.85383 3.02289 3.1735 3.30931 3.43294 Fr on t-Office Em plo ye e : r un 11 0.693147 1.18897 1.58017 1.89928 2.167 2.3967 2.5973 2.77501 2.9343 3.07846 3.21001 Fr on t-Office Em plo ye e: r un 10 0.693147 1.18897 1.58195 1.90284 2.17205 2.40293 2.60446 2.78291 2.94278 3.08741 3.21933 Fr on t-Office Em plo ye e: r un 9 0.693147 1.18897 1.59994 1.93814 2.22122 2.46279 2.67252 2.85728 3.02205 3.1705 3.30542 Fr on t-Office Em plo ye e: r un 8 0.693147 1.18897 1.59941 1.93715 2.2199 2.46124 2.67082 2.85548 3.02019 3.16861 3.30353 Fr on t-Office Em plo ye e: r un 7 0.693147 1.18897 1.57801 1.89489 2.16073 2.3889 2.58826 2.76497 2.92344 3.06692 3.19791 Fr on t-Office Em plo ye e: r un 6 0.693147 1.18897 1.60178 1.94166 2.22605 2.4686 2.67906 2.86436 3.02954 3.1783 3.31346 Fr on t-Office Em plo ye e: r un 5 0.693147 1.18897 1.60209 1.94228 2.22691 2.46965 2.68025 2.86568 3.03095 3.1798 3.31503 Fr on t-Office Em plo ye e: r un 4 0.693147 1.18897 1.5781 1.89502 2.16084 2.38892 2.58817 2.76474 2.92305 3.06637 3.19718 Fr on t-Office Em plo ye e: r un 3 0.693147 1.18897 1.59374 1.92612 2.20465 2.44278 2.64991 2.83271 2.99597 3.14327 3.2773 Fr on t-Office Em plo ye e: r un 2 0.693147 1.18897 1.59284 1.92437 2.20222 2.43983 2.64657 2.82907 2.9921 3.13921 3.2731 Fr on t-Office Em plo ye e: r un l 0 0.8258 1.34792 1.73402 2.04113 2.29615 2.51412 2.70432 2.87294 3.02429 3.16151
vision of banking needs to be well-aligned with all operational processes. Although the pro-posed approach is not a substitute for statistical approaches, its application by managers and decision makers can provide insights into key feedback loops in the decision-support system, which might otherwise go undetected by statistical approaches alone.
The results’ subjective nature and dependence on a specific banking context naturally produce idiosyncratic results, which means that they cannot be extrapolated to other contexts without procedural adjustments (e.g., other countries). This limitation is arguably compen-sated for, however, by the amount of information the panel members analyzed and discussed. The level of detail facilitated a better understanding of the determinants of bank branch front-office employee evaluations, as well as their respective cause-and-effect relationships. A review of the relevant literature confirmed that this methodological combination is a novel approach in this research context.
Conclusions
Bank branch front-office employee evaluation has always been quite important to banking institutions. This decision-making process is an extremely complex and dynamic system in which, besides objective goals, subjective components should also be included to ensure these employees’ performance assessments are complete. Inherent features of the decision-support system, such as causal dynamics, require top managers and banks to develop a different, more detailed understanding of criteria. Thus, the combined used of FCM and SD techniques fa-cilitated the construction of an analytical model of bank branch front-office employee evalu-ation that considers the established cause-and-effect dynamics of performance criteria. This decision-support system is a simple tool that is easy to read and interpret. Through a holistic vision of the problem in question, this instrument seeks to give managers essential informa-tion needed to evaluate bank branch front-office employee performance, as well as providing guidelines for making necessary strategic decisions.
On a methodological level, combining these techniques overcomes the identified limita-tions of previous models by, first, identifying a larger number of criteria, thereby permitting a more integrated, holistic approach to the decision problem. Second, the dual methodology incorporates subjective determinants through specialists’ opinions, values, and experience. Third, the techniques highlight the identified criteria’s relationships and quantify those re-lationships’ weight, which offers a broader understanding of the decision-support system’s dynamics. Last, this approach includes a stable, strong decision-making tool able to simulate different scenarios.
Specifically regarding implications for management, the applied techniques and the re-sulting model offer various benefits. First, the model provides a clear visual representation of the decision problem, thereby assuring a deeper understanding of front-office employee evaluation components. Second, this approach has the capability to identify the decision-support system’s negative aspects and opportunities for improvement in order to enhance the decision-making process. Third, the model can be used to identify the criteria with the strongest impact on employee performance evaluations. Last, the methodology facilitates the creation of scenarios so that managers can observe and preview the system’s behavior in the face of changes that might occur. Therefore, methods based on constructivist think-ing, such as (fuzzy) cognitive mapping and SD, produce more realistic evaluation models
because subjective components are incorporated through decision makers’ knowledge about decision-making processes.
Despite the useful results discussed above, the present study was grounded in a learn-ing logic based on constructive debate and the continuous sharlearn-ing of ideas and experiences among decision makers, which does not seek to achieve optimum solutions. In light of the current findings and prior models’ results, the proposed decision-support system is not without its limitations. Two main limitations were identified of which the first was that the model’s development required a great deal of time and dedication from each member of the decision-maker panel. The second limitation was that the entire modeling and construction process was extremely dependent on the specific context, experts’ personal and professional experience, and their receptivity and contributions, which implied idiosyncratic behaviors. As a result, although the combined use of cognitive mapping techniques and SD allows for changes in the model at any time and ensures much flexibility, any extrapolation of the pres-ent results without appropriate adaptations could be misleading.
Future research must keep in mind that the proposed model focuses on Portuguese banks’ realities and, thus, its usefulness in other contexts will depend on the changes introduced by decision-maker panels. Nonetheless, the methods applied should remain valid because of the present study’s processual approach, even though the current results’ limited potential for extrapolation is the methodologies’ greatest shortcoming. Keeping this in mind, bank branches in different contexts (e.g., other specialists and geographical contexts) should be able to structure their front-office employee performance evaluation criteria using similar techniques. One possible future line of research could involve developing different scenarios based on new challenges that might arise in the market. These scenarios would allow experts to understand the decision-support system’s behavior and find ways to improve the proposed model’s focus. A larger number of simulations are needed to ensure a stronger model and more informed and prepared management to maintain control over decision-making pro-cesses. Overall, the methodologies applied in the present study need to be used primarily as a complement to other analytical tools, namely, multicriteria evaluation models or other con-structivist models (for examples, see Belton and Stewart (2002) and Zavadskas et al. (2014)). The proposed dual methodology could also be combined with artificial intelligence methods to provide further insights into bank branch front-office employee evaluation, thereby gen-erating further developments in this field.
Acknowledgements
This work was partially funded by the Portuguese Foundation for Science and Technol-ogy (Grant UID/GES/00315/2019). Records of the expert panel meetings, including images, software output and non-confidential information of the study, can be obtained from the corresponding author upon request. The authors gratefully acknowledge the involvement and knowledge sharing of the panel members: Catarina Azevedo, Catarina Silvares, Cláudia Kay, Eduardo Raposo, Fernanda Ribeiro, João Amorim and Luís Silva. The authors are also grateful to João Costa, Business Process Management Competence Center Director at Millen-nium BCP (Portuguese private banking corporation), for his availability and the important insights he provided during the consolidation of results.
References
Ackermann, F. (2012). Problem structuring methods “in the Doc”: Arguing the case for Soft OR.
Eu-ropean Journal of Operational Research, 219(3), 652–658. https://doi.org/10.1016/j.ejor.2011.11.014
Arbore, A., & Busacca, B. (2009). Customer satisfaction and dissatisfaction in retail banking: Exploring the asymmetric impact of attribute performances. Journal of Retailing and Consumer Services, 16(4),
271–280. https://doi.org/10.1016/j.jretconser.2009.02.002
Athanassopoulos, A. (1997). Service quality and operating efficiency synergies for management control in the provision of financial services: Evidence from Greek bank branches. European Journal of
Operational Research, 98(2), 300–313. https://doi.org/10.1016/S0377-2217(96)00349-9
Azevedo, A., & Ferreira, F. (2019). Analyzing the dynamics behind ethical banking practices using fuzzy cognitive mapping. Operational Research, 19(3), 679–700.
https://doi.org/10.1007/s12351-017-0333-6
Bana e Costa, C., Stewart, T., & Vansnick, J. (1997). Multicriteria decision analysis: Some thoughts based on the tutorial and discussion sessions of the ESIGMA meetings. European Journal of
Op-erational Research, 99(1), 28–37. https://doi.org/10.1016/S0377-2217(96)00380-3
Barger, M., Perez, T., Canelas, D., & Linnenbrink-Garcia, L. (2018). Constructivism and personal epis-temology development in undergraduate chemistry students. Learning and Individual Differences,
63, 89–101. https://doi.org/10.1016/j.lindif.2018.03.006
Bell, S., & Morse, S. (2013). Groups and facilitators within problem structuring processes. Journal of the
Operational Research Society, 64(7), 959–972. https://doi.org/10.1057/jors.2012.110
Bellou, V., Chaniotakis, I., Kehagias, I., & Rigopoulou, I. (2015). Employer brand of choice: An em-ployee perspective. Journal of Business Economics and Management, 16(6), 1201–1215.
https://doi.org/10.3846/16111699.2013.848227
Belton, V., & Stewart, T. (2002). Multiple criteria decision analysis: An integrated approach. Kluwer
Academic Publishers. https://doi.org/10.1007/978-1-4615-1495-4
Beltratti, A., & Stulz, R. (2012). The credit crisis around the globe: Why did some banks perform better?
Journal of Financial Economics, 105(1), 1–17. https://doi.org/10.1016/j.jfineco.2011.12.005
Berger, A., Leusner, J., & Mingo, J. (1997). The efficiency of bank branches. Journal of Monetary
Eco-nomics, 40(1), 141–162. https://doi.org/10.1016/S0304-3932(97)00035-4
Canas, S., Ferreira, F., & Meidutė-Kavaliauskienė, I. (2015). Setting rents in residential real estate: A methodological proposal using multiple criteria decision analysis. International Journal of Strategic
Property Management, 19(4), 368–380. https://doi.org/10.3846/1648715X.2015.1093562
Carayannis, E., Ferreira, F., Bento, P., Ferreira, J., Jalali, M., & Fernandes, B. (2018). Developing a socio-technical evaluation index for tourist destination competitiveness using cognitive mapping and MCDA. Technological Forecasting & Social Change, 131, 147–158.
https://doi.org/10.1016/j.techfore.2018.01.015
Castela, B., Ferreira, F., Ferreira, J., & Marques, C. (2018). Assessing the innovation capability of small- and medium-sized enterprises using a non-parametric and integrative approach. Management
Deci-sion, 56(6), 1365–1383. https://doi.org/10.1108/MD-02-2017-0156
Christoforou, A., & Andreou, A. (2017). A framework for static and dynamic analysis of multi-layer
fuzzy cognitive maps. Neurocomputing, 232, 133–145. https://doi.org/10.1016/j.neucom.2016.09.115
Dekker, D., & Post, T. (2001). A quasi-concave DEA model with an application for bank branch per-formance evaluation. European Journal of Operational Research, 132(2), 296–311.
https://doi.org/10.1016/S0377-2217(00)00153-3
Eden, C., & Ackermann, F. (2001). SODA – The principles. In J. Rosenhead, & J. Mingers (Eds.),
Ra-tional analysis for a problematic world revisited: Problem structuring methods for complexity, uncer-tainty and conflict (pp. 21–41). Chichester, John Wiley & Sons.