1
M
ASTER
FINANCE
MASTER
’
S
F
INAL WORK
D
ISSERTATION
“E
XPORT
I
NTENSITY
AND
F
INANCIAL
P
ERFORMANCE OF
P
ORTUGUESE
S
MALL AND
M
EDIUM
E
NTERPRISES
(SME)”
RAFAEL DA FONSECA TOMÁS
2
M
ASTER
FINANCE
MASTER
’
S
F
INAL WORK
DISSERTATION
“E
XPORT
I
NTENSITY
AND
F
INANCIAL
P
ERFORMANCE OF
P
ORTUGUESE
S
MALL AND
M
EDIUM
E
NTERPRISES
(SME)”
RAFAEL DA FONSECA TOMÁS
O
RIENTATION:
P
ROFESSORD
OUTORAE
LSAM
ARIAN
OBRE DAS
ILVAF
ONTAINHA3
Index
List of Acronyms and Abbreviations ... 4
Abstract ... 5
Introduction... 6
1. Literature Review ... 9
2. Data and Methodology ... 14
2.1 Data Base Description and Sample ... 14
2.2 Methodology ... 15
3. Variables ... 17
3.1 Dependent Variables: Export Intensity ... 17
3.2 Independent Variables ... 17
3.2.1 Firm Size ... 18
3.2.2 Expenditure Variables ... 18
3.2.3 Performance ... 19
4. Results and Discussion... 21
4.1 Descriptive Analysis ... 21
4.2 Presentation and Discussion of Results ... 22
4.2.1 Linear Models ... 22
4.2.2 Probit Models ... 25
5. Conclusions ... 27
References ... 31
4
List of Acronyms and Abbreviations
CAE Rev. 3 – Classificação das Actividades Económicas, Revisão 3
EBITDA – Earnings Before Interests, Taxes, Depreciations and Amortization EC – European Community
EU – European Union GVA – Gross Value Added
INE – Instituto Nacional de Estatística MFW – Master Final Work
NACE - Statistical Classification of Economic Activities in the EC Nº or N – Number
ROA – Return on Assets
SCIE – Sistema de Contas Integradas das Empresas SME – Small Medium Enterprises
SNC – Sistema Normalizado Contabilístico Tx.var. – Variation rate
5
Abstract
The purpose of this investigation is to explain the export intensity of Small and Medium Enterprises (SME) in Portugal. The relation between export intensity and financial performance is analyzed in detail. The empirical analysis is based on a sample of SME firms from the manufacturing sector obtained from the firm-level accounting data Sistema de Contas Integradas das Empresas (SCIE). Two models of export intensity of SMEs are analyzed, linear and probit, considering two kinds of dependent variables: (i) the percentage of foreign sales (considering; and (ii) a binary variable that measures the predominance (value 1 for percentages of foreign sales higher than 50%). As explanatory variables are tested variables related to company characteristics (e.g. size, technological level, wage costs) and to financial performance (e.g. debt, financial autonomy). Results are mixed depending on the model or sample studied, however, in general, return on assets, productivity, net result and debt-to-equity ratio have a positive relationship with the export intensity. Size and technological level also impacted positively. Average wage has a negative effect on export intensity, suggesting an international competitiveness based on costs.
6
Introduction
The recent financial crisis that hit the more developed economies was drastic to national markets and affected the GDP, the purchasing power, the employment, the investment, the production and the profits of financial and non-financial firms. To overcome these problems, the non-financial firms, particularly the manufacturing sector, looked for finding alternatives on foreign market, (community and non-community external market) to compensate the decrease of the domestic market. Some companies reached that goal, increasing their export intensity and the degree of internationalization. In Portugal, in 2012, the non-financial export corporations was the only ones that grew gross value added (GVA), turnover and even people at work, whereas the remaining economic activity showed significant decreases (INE, 2014).
The Figure A.1., which shows the weight of exports in Portuguese Gross Domestic Product (GDP) for the period 1995 to 2013 illustrates the relevance of exports in particular since 2009. The rate of change of the Portuguese exports is always higher than the rate of change of real Portuguese GDP during the period between the first quarter of 2009 to the first quarter of 2014, and since 2010, it is always positive which contrast with the rate of change in GDP. Consequently, the exports in macroeconomics terms presented an evolution that contributed to the performance of national economy being not so negative during the recent crisis years (Figure A.3). The composition of Portuguese exports in recent years also shows the importance of goods produced in the manufacturing industry and the traditional sectors are at the top of the exporter sectors (e.g. clothing and shoes).
7 The aim of this dissertation is to contribute to a better understanding of the Portuguese exports determinants adopting a microeconomic perspective, focusing on Small and Medium Enterprises (SME) and giving a special attention to the financial performance of these companies, evaluated by indicators based on firm-level accounting data. The SME represent about half (53%) of the Portuguese turnover (INE, 2012).
This Master Final Work (MFW) contributes to the knowledge of the characteristics of the SME contributing positively, through the exports, to the macroeconomic performance and to identify the determinants of SME exports intensity in manufacturing sector. In some analysis (Floriani and Fleury, 2012; Kirca, Hult et al., 2011; Boso, Cadogan and Story, 2012), exports are measured as one among other forms of internationalization, however, in this MFW only the exports are analyzed.
How has the economic and financial theory analyzed the explanatory factors of the firms’ exports and within these explanatory factors to financial performance factors?
Alvarez and Lopez, (2012) find that exporting firms are, on average, more productive, with better performance and pay higher wages that firms which only operate in the domestic market. Through indicators of financial performance, among others, will be analyzed whether the same is true for the Portuguese case exports will be studied. The independent variables in the explanatory model of the export intensity (to the EU market and the non-EU market) are characterized by size, costs and financial performance.
8 The study of variables related to SME exports is driven by the identification of a research gap in relation to how these firms in Portugal have responded to recent market adverse conditions and incorporating in this analysis the financial perspective. This investigation follows Alvarez and Lopez (2012), who study the link between the financial performance and the exports of Chilean SMEs.
Through financial ratios and others whose method of calculation is shown in INE (2012: 27 to 32), the indicators used by Alvarez and Lopez (2012), Voulgaris, Doumpos and Zopounidis (2000) and Floriani and Fleury (2012) here are studied the determinants of SME exports.
As in previous studies, the methodologies more used to explain the export intensity of firms is linear regression, which allows to determine the specific contribution of each independent variable (e.g. financial autonomy) to explain the dependent variable, the percentage of sales oriented to the external market. Beyond the linear model, a different methodological approach is adopted. Considering as dependent variable the binary variable that measures the exports predominance of firms, Probit models will be applied to analyze the factors that contribute most to the SMEs exports (positively and negatively). The main data source used in the empirical analysis is accounting firm-level information from Sistema de Contas Integradas das Empresas (SCIE) for the year 2011. The sample includes non-financial SMEs belonging to the manufacturing sector (N=12,138 firms).
This research adds value to the work done previously on Portuguese exports (Oliveira and Teixeira, 2011; Machado, 2013) in three areas: (i) studies the SME for a recent period affected by the economic and financial crises; (ii)
9 combines the financial performance of companies and the internationalization of the same, with a focus on exports; (iii) and use detailed accounting data.
This dissertation is structured as follows. After this introduction, we present in the second section, the literature review. The third section introduces the database, the sample and the methodology used to evaluate and explain the performance of Portuguese SMEs, including a brief presentation and justification of the variables used in the model. In the fourth section results are presented and discussed. Finally, conclusions are presented and some limitations and clues to future investigations are identified.
1. Literature Review
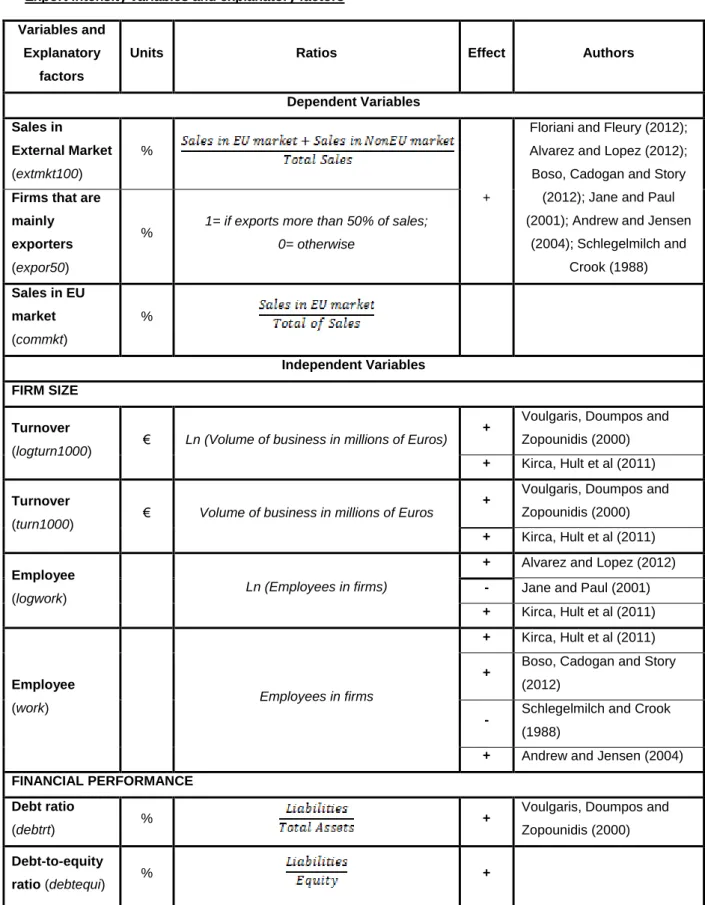
During the recent years, exports and the financial performance of companies, especially SMEs, have been the focus of multiple investigations under diverse perspectives (Floriani and Fleury, 2012; Voulgaris, Doumpos and Zopoundis, 2000; Alvarez and Lopez, 2012; Kirca, Hult et al., 2011; Boso, Cadogan and Story, 2012; Machado, 2013; Jane and Paul, 2001; Andrew and Jensen, 2004; Schlegelmilch and Crook, 1988). Table A1 in Appendix summarizes the Literature Review and Table A2 in Appendix shows the measures and indicators used (definition and calculation).
Some authors try to understand the orientations of exporting firms, how they behave and what are the markets that companies seek more (Boso, Cadogan and Story, 2012), whereas other authors seek to understand what influences and what more contributes to good financial performances in firms, studying the
10 characteristics of the firms, for example, the activity sector and the market where they operate (Voulgaris, Doumpos and Zopoundis, 2000; Kirca, Hult et al., 2011; Machado, 2013).
There is also a smaller group of literature that combines the two approaches presented in the previous paragraph, export intensity on one hand and financial performance on the other, in order to explain in what way they are linked and if there is a positive relation between them (Floriani and Fleury, 2012; Alvarez and Lopez, 2012; Jane and Paul, 2001). The present investigation fits in this line. Although there are some investigations into the behavior of Portuguese exports based on business surveys (Oliveira and Teixeira, 2011; Machado, 2013), as far as we know there are no studies that addresses the Portuguese case in perspective adopted for this research, namely financial performance and sales orientation to the international market and using firm-level accounting data.
Boso, Cadogan and Story (2012) distinguish the orientations of entrepreneurs and market orientation, arguing that it is essential an interconnection between the two for a successful export strategy. The first point is related to the ability of exporters to explore new possibilities, to shape the firm behavior and the structure of markets in their favor and to gain competitive advantage. The second type of orientation, the market orientation, is related to the ability of exploit the expertise of export companies to identify and respond to the needs and preferences of customers which is related to the marketing activity. The term “market orientation” is generally associated to production oriented by the needs/demand of the market, i.e. the customers. Boso et al. (2012) suggest that through a positive interaction between the orientations of entrepreneurs and
11 markets, companies can achieve the same exporter success even in harsh environments and, when companies have financial resources can implement new products. In this MFW, the year under examination is 2011, when the macroeconomic environment was adverse. It will be possible to analyze the Portuguese case, despite the fact that it does not exist in the database information about strategic aspects of the firm or entrepreneur characteristics.
Voulgaris, Doumpos and Zopoundis (2002) apply twelve financial ratios to assess the performance of Greek SMEs for the period 1988-1996, and separate the companies into three groups: dynamic group, are those with a very solid financial position; medium group, those which are on an intermediate level, or has a stable position; and lastly, those which show financial needs, the weak group. The authors use a method of valuation called UTADIS (UTilités Additives
DIScrimantes), which aims to develop a model of aggregation criteria used to
determine the ranking of alternatives. They conclude that until 1996, mainly as a result of improved economic conditions, the dynamic group was the larger one, so the SMEs had good financial results. For the Portuguese case it will be studied if the deterioration of economic conditions has affected the performance of SMEs.
Kirca, Hult et al., (2011) base their research on the theory of internationalization multinationality-performance relationship through a analysis. This meta-analysis consists on the meta-analysis and comparison of results from different studies, trying to find patterns in the results, differences or other interesting relationships among the 120 independent samples under scrutiny. They conclude that multinationalization provides an efficient way of organization that
12 allows the company to transfer its assets to generate higher returns in international markets. This seems to be consistent for all firms, however, unlike our research, this study do not focus only on SMEs and also explain that multinationalization is not just made up by exports, may involve other activities such as opening a subsidiary or a company abroad.
Recently, Machado (2013) presented a method for evaluating the performance of SME Portuguese companies, the Balanced Scorecard, and claims that this is a superior method to that only integrates financial measures. The Balanced
Scorecard is a methodology of measurement and management of performance
which can also be used as a model of business performance evaluation. However, although in some countries this method is frequently used, in Portugal this has a low percentage of use in SMEs, therefore it does not seem suitable for our investigation.
Floriani and Fleury (2012) through a structural equation model test the relationship between the degree of internationalization, the financial performance and the development of international skills by Brazilian SMEs. They conclude that the degree of internationalization has a positive impact on the development of workers skills, which affects positively the financial performance. However, they report that the increase of internationalization level, by itself, does not imply a better performance of SMEs, because it is necessary a development of skills inside the company. To measure these three aspects (internationalization, performance and skills), financial and others indicators were used, such as return on assets, net profit, international orientation and the number of workers abroad. Although the Floriani and Fleury
13 (2012) study be, in some aspects, similar to our own, the model used does not seem the most appropriate for the Portuguese SMEs because it needs additional information not currently available and also because the investigation of internationalization goes beyond export activities. However, some common indicators with Floriani and Fleury (2012) will be taken into account.
Jane and Paul (2001) study the effects on the financial performance of firms as result from the internationalization of Japanese SMEs, and discover that the internationalization of companies has a positive impact on their financial performance.
Oliveira and Teixeira (2011), also study internationalization strategies of Portuguese SMEs based on various criteria, such as size, technological level of companies and sectors where they operate, using as informative support studies previously done and a specific survey applied to the Portuguese firms. However, Oliveira and Teixeira (2011) do not test the association between internationalization of SMEs and correspondent financial performance.
In the present investigation of the Portuguese case, the methodology mainly follows Alvarez and Lopez (2012), who tested the effect of the financial development on the probability of exporting of Chilean manufacturing firms from 1990 to 2000. They conclude that financial performance does not imply a significant change in export performance, they also challenge empirically the conventional view that financial development is likely to benefit SMEs, which are assumed to have higher credit access restrictions compared with larger firms. Consequently, it is not expected that financial development can
14 significantly alter the performance of exports SME. Our research contributes to this discussion.
2. Data and Methodology
2.1 Data Base Description and Sample
The main data for the empirical analysis are firm-level accounting data from SCIE. Annually, Statistics Portugal (INE) publishes reports with aggregate results from SCIE’ accounting data, in addition to several economic-financial ratios, such as liquidity ratios, capital ratios and assets indicators (INE, 2012 and 2014). Some ratios and indicators used in this research followed the concepts and ways of calculation presented in INE (2012: 27 to 32). The overall sample consists of 12,138 small and medium enterprises of manufacturing for 2011. The choice of the year 2011 was due to be the only year where there was information on the share of exports in total sales and also due to be the latest year for which information in micro data format was available from INE on the date of the beginning of MFW.
The classification of firms by size in small and medium enterprises (SMEs) corresponds to the definition adopted by the INE (2012). However, micro enterprises were excluded (firms which employs less than 10 persons and not exceed the €2 million of turnover). Therefore, the SMEs considered in this research are manufacturing firms employing between 10 and 249 persons (inclusive) and whose annual turnover does not exceed 50 million Euros (INE, 2012:3).
15 SMEs are classified according to the Classificação das Actividades Económicas (CAE) Rev. 3 (5 digits). This allows to adopt the Eurostat categorization according to technological level criterion (Eurostat 2014) based on the Statistical Classification of Economic Activities in the EC (NACE). This groups the manufacturing firms into four categories according to the technological level (Lower, Medium-Low, Medium-High and High).
Table A3 in Appendix summarizes the characteristics of the sample by exporting status, size and sector of activity. Clothing and footwear sectors, both known as ‘traditional’, correspond to 1676 firms in the sample and the mean of exports in sales per firm is high (respectively 45% and 43% ).
2.2 Methodology
The methodologies for empirical analysis are descriptive analysis and modelization. Modelling adopts: (i) a linear regression in which the dependent variable is the export intensity (percentage of exports in total sales); (ii) and a probit model where the dependent variable is a binary variable associated with the export predominance (50% or higher) in the sales. The estimation of models and various tests were performed using IBM SPSS Statistics 22 and STATA software.
Linear Model
The following linear model was adopted:
Extmkti = C + βj sizeji + λl performanceli + δr costsri + ηstechsi
16
βj, λl, δr, ηs correspond to the coefficients associated to the groups of
explanatory factors (e.g. size, performance)
The calculation methods for each variable are in Table A1. The descriptives in Table A2.
Where:
- Extmkt, the dependent variable, is the share of exports in total turnover.
- size (logturn1000 and turn1000, logwork, and work), performance (debtrt, debtequi, finauton, netres, product, roa, solvab and wintang) and costs (ino, invest, labor, logwage and wage, wcorpor) represent the different groups of independent variables.
- tech is a proxy for technological level of companies.
- C is the constant, the independent term.
Probit Model
After estimating the linear model, is alternatively applied a probit model where the dependent variable is the exports predominance (or not). In this probit model, the dependent variable (binary) is expor50, which measures the exporting prevalence of companies.
Table A2 shows the measures and indicators used (definition and calculation) in the descriptive analysis and in models. Next section justifies the selection of the relevant variables and breakdowns by size, exports geographical orientation and technological level.
17
3. Variables
3.1 Dependent Variables: Export Intensity
The export intensity is evaluated through two variables, one used in the linear model and the other used in the probit model: (i) the share of exports in total sales; and a dummy variable that takes the value 1 when firms are predominantly exporters (companies that sell abroad more than 50%) and takes the value 0 in all other cases1.
Exporting intensities for the EC and non-EC are also studied in separate. It is expected that companies sell more to EU market since they are tax free and have easier circulation of goods and services. However, the opposite effect can occur given the crisis that some EU countries members are facing. We also made estimates for subgroups of firms adopting the size criterion (small vs. medium) and the technological level.
3.2 Independent Variables
The choice of variables is based on the literature surveyed in Section 1. A summary of the relation between the variables and the literature is in Table A1 in Appendix. The measures, ratios and indicators calculation follows the literature and for most of the performance indicators it is adopted the original descriptions of INE (2012: 27 a 32). Table A1 and A2 in Appendix show how the variables are calculated and their original descriptions.
1 In some analysis (Floriani and Fleury, 2012; Kirca, Hult et al., 2011; Boso, Cadogan and Story, 2012), exports are
18
3.2.1 Firm Size
In the group of variables of size are included, turnover (turn1000 and
logturn1000) and employee (work and logwork). Grounded on the literature, it is
expected that size have a positive impact on exports (Voulgaris, Doumpos and Zopounidis, 2000; Kirca, Hult et al., 2011) and because scale facilitates internationalization (Alvarez and Lopez, 2012; Boso, Cadogan and Story, 2012; Andrew and Jensen, 2004).
3.2.2 Expenditure Variables
The tested variables related to costs are: research and development (inov), investment rate (invest), wage costs in total costs (labor), wage per person (logwage and wage) and weight of corporate bodies remuneration (wcorpor).
The indicator of Employees assigned to Research and Development (R&D) refers to the set of expenses related to R&D performed inside the firms. This indicator is proxy measure of the potentiality of companies for innovation. It an indicator of input as opposed to output indicators such as patents registered. It The innovation (inov) tends to have a positive impact on exports because innovation provides an improvement in quality of products and services and this can lead to an increase in external competitiveness, an expansion in market share and an export growth (Floriani and Fleury, 2012; Jane and Paul, 2004; Kirca, Hult et al. 2011; and Schlegelmilch and Crook 1988).
The investment rate (invest), also impacts positively because can lead to an improvement in products and services and consequently facilitating exports
19 increase exports, as demonstrated by Kirca, Hult et al. (2011) and Floriani and Fleury (2012).
The ratio workers costs/turnover (labor) measures the wage of workers in the total turnover of enterprises, can also be defined as a ratio that measures the payroll of the company in relation to its business and characterize the firm in relation to labor intensity and the importance of labor costs. It also gives a proxy measure of the proportion of each productive factor (capital and labor) in the firm as well the labor intensity. The indicator wage per person (wage and the logarithmic transformation (logwage) is the average wage of employees calculated as the total wage bill divided by the number of employees (Temouri et al. 2013). It evaluates indirectly the external competitiveness by wage costs Dunford et al. (2013).
The corporate bodies remuneration / total labor costs (wcorpor) ratio measures the weight of corporate bodies remuneration into the total of human resources costs and is used in this study as a proxy variable for the management complexity. It is expected that a more complex management is associated with greater export capacity, greater ability to study the foreign markets, and in general greater ability to internationalization. On the other hand, a greater management complexity can also include agency costs and in that case it may affect negatively financial performance.
3.2.3 Performance
Variables associated to performance are tested: debt ratio (debtrt), debt-to-equity ratio (debtequi), financial autonomy (finauton), net result (netres),
20 apparent productivity of labor (product), return on assets (roa), solvability (solvab) and weight of intangible fixed assets (wintang) (INE, 2012: 27 to 32).
The ratio liabilities/total assets (debtrt) is an indicator that measures the firms’ debt, reflects the share of borrowed capital in the company financing. Voulgaris, Doumpos and Zopounidis (2000) demonstrate that whereas firms with higher export intensity, are also those with more indebtedness. Another ratio that also measures the level of debt of companies and its degree of dependence on lenders is the liabilities/equity (debtequi) ratio, which, despite having not been used in the literature surveyed, is expected to have a positive effect. However due to the recent times of crisis, it is normal for companies to have some debt.
Financial autonomy (finauton), is an indicator that expresses the global financial autonomy of firms indicating the extent to which total assets is financed by capital from their own shareholders. Voulgaris, Doumpos and Zopounidis (2002) point to a positive relationship with SMEs exports.
Net result (netres) represents the net result generated by. It is expected that this variable has a positive relation with the dependent variable, as shown in literature (Floriani and Fleury, 2012; Kirca, Hult et al., 2011).
The Return on Assets (roa) is very important in assessing the financial performance of the companies because expresses the rate of return on the capital invested in firms, meaning firms’ profitability from the point of view of the investor, as reported by Voulgaris, Doumpos and Zopounidis (2002), Floriani and Fleury (2012) e Kirca, Hult et al. (2011). And it is expected that this indicator has a positive impact on exports.
21 The equity/liabilities (solvab) ratio evaluates the ability of companies for paying their responsibilities assumed at short, medium and long term and evaluates the degree of independence of companies in relation to creditors; the higher its value, more guarantees the lenders have to receive their money.
The intangible assets/total assets (wintang) ratio measures the weight of intangible fixed assets in total assets and serves to realize the importance of licenses, patents, under the heading of corporate assets.
The ratio VABcf/Employees in firms (product) represents the contribution of labor factor used by firms, measured by GVA generated by each worker, commonly referred as productivity. This ratio is expected to have a positive impact on SMEs exports as evidenced by Alvarez and Lopez (2012) and Boso, Cadogan and Story (2012).
4. Results and Discussion
4.1 Descriptive Analysis
In order to study what sectors have higher export intensity, what technological level these export sectors exhibit, and to which markets export (EU and non-EU market), sales to foreign market of 22 manufacturing sector are analyzed. In Table A3 (appendix)we can observe that industries with higher export intensity are the footwear and clothing, sectors classified as low technological levels (Eurostat, 2014) but there are signs of the occurrence of an upgrade in the technological level and the quality of exported products (Amador and Opromolla, 2009). Another industry with high export intensity is the industry of other transport equipment (sector number 30 in Table A3) that presents a
22 medium-high level of technology, e.g. shipbuilding, aircraft manufacturing and manufacturing of motorcycles. The sectors with lower export intensity are the food industry, the tobacco industry and the printing and reproduction of recorded media. Regarding the first sector (food industry), despite being slightly exporter (5%), is the sector where there are more firms, 1789 in total.
As for exports orientation to the EU market and non-EU market, we can observe the dominance of the EU market in most of the sectors, which is explained by the greater facility in movement of goods and services within the EU and also exemption from taxes.
Through Table A3 (appendix), we can conclude that small firms present less export intensity than medium firms, and SMEs tend to orient their sales to the EC market.
4.2 Presentation and Discussion of Results
4.2.1 Linear Models
The results obtained by the estimation of the linear model are shown in Table 2. The variables with greatest explanatory power for SMEs exports are size, labor costs and the weight of corporate bodies’ remunerations. Regarding the variables of financial performance (debtequi, finauton, netres, product, roa),
invest, labor and tech they are statiscally significant in Model 1, despite not
having high explanatory power (Table 2).
Firm size, measured by number of employees (logwork and work), has a positive relation with exports, converging with the literature, such as Andrew and Jensen (2004), Kirca, Hult et al. (2011), Boso, Cadogan and Story (2012)
23 and Alvarez and Lopez (2012). However, when firm size, is measured instead by the turnover (turn) it has a negative impact on export intensity which diverge from the literature (Voulgaris, Doumpos and Zopounidis, 2000; Kirca, Hult et al., 2011) (Table A1, appendix). Nevertheless, its logarithm (logturn), as mentioned authors have found, has a positive correlation.
Moreover, the logarithm of the wage per person (logwage) ratio has a negative impact on export intensity of firms. Alvarez and Lopez (2012) when they studied the exports the Chilean companies have reached the same result. The weight of the corporate bodies’ remuneration (wcorpor) also has a negative impact on export intensity of firms.
Earnings before interest, taxes, depreciation and amortization (netres), the return on assets (roa), productivity (product) have a positive effect in line with the literature (Table A1, appendix). The debt-to-equity ratio also shows a positive relation in contrast to financial autonomy that has a negative impact. Firms with higher export intensity also have high debt levels.
Regarding the ratios invest and labor, the empirical results shows an inverse relationship with the SMEs exports and diverged from the literature reviewed (Kirca, Hult et al., 2011). The result obtained for the investment rate (invest) can be explained by the absence of information about investment over the previous years, it means the accumulated investment.
From the estimated models for small and medium firms, separately (models 2 and 3 respectively of Table 2) the results obtained are identical to those obtained from the global model. The variables turnover (logturn1000 and
24 wage per person (logwage) are statistically significant for Model 2 and Model 3 (Table 2).
The model estimated only for small firms (Model 2) have some differences to the model estimated for the medium firms (Model 3). For example, debt (debtrt e debtequi), the wage costs in total costs (labor), the weight of corporate bodies’ remuneration (wcorpor) and the technological level (tech) that are statistically significant for the small are not for the medium.
Regarding the models estimated according to the technological level of the sectors that companies belong (Models 4 to 7, Table 2) the results diverge among groups. This may be due to real differences or to factors omitted from in considering models, such as management strategies or innovative practices not reflected in the indicators.
In the low-tech firms (Model 4, Table 2), the variables that present statistically significant results are similar to the global model. However, when the technological level of firms is higher (Model 6 and 7, Table 2) the variables with statistical significance are fewer. For Model 6, referring to the group of companies with a medium-high technological level, the variables with statistical significance for the SMEs exports are turnover (logturn1000), the return on assets (roa), the wage costs in total costs (labor), the wage per person (logwage) and the weight of corporate bodies’ remuneration (wcorpor). Whereas in Model 7, the investment rate (invest) and the weight of corporate bodies’ remuneration (wcorpor) are the only ones that show statistical significance, and both with negative signal in their coefficients.
25 Table 2 – Results of regression linear models
Firm Size Technological Level Model 1 (Total) Model 2 Small Model 3 Medium Model 4 1- Low Model 5 2- Medium-Low Model 6 3- Medium-High Model 7 4- High logturn1000 12,648*** (.448) 12.645*** (.865) 17.128*** (2.066) 15.215*** (.556) 10.971*** (.678) 11.515*** (1.219) turn1000 -.001*** (.000) -.002*** (.000) -.001*** (.000) -.001*** (.000) Debtrt .931*** (.301) 5.331*** (1.525) Debtequi 0.005* (1.942) .005* (.000) .006** (.003) Finauton -.984*** (.317) -.394* (.218) Netres 4.311E-06*** (.000) 4.781E-06*** (.000) 3.510E-06*** (.000) 6.570E-06*** (.000) 4.657E-06*** (.000) Product 0.000*** (.000) -6.939E-05* (.000) .000*** (.000) .000*** (.000) .000*** (.000) Roa 1.832** (.869) 1.783** (.826) 15.828** (7.410) 5.934*** (2.061) 21.208** (8.917) Solvab -.323*** (.121) Wintang 62.485* (32.283) Invest -.002* (.001) -.034** (.013) Labor 1.167*** (.322) 10.756*** (1.511) 1.097*** (.218) 15.221*** (3.021) 19.656*** (5.294) Logwage -7.592*** (1.107) -7.460*** (1.310) -10.902*** (3.120) -10.488*** (1.388) Wage .000* (.000) -.001*** (.000) Wcorpor -11.256*** (3.570) -7.375** (3.539) -31.170*** (11.118) -98.981** (40.596) Tech 1.209** (.485) 1.232** (.520) Adjusted R square .124 .054 .059 .143 .109 .134 .108 Number of Observations 10101 8095 1854 6213 2898 894 93
Source: Table built by the author based on Table (output in SPSS)
Note: ***, **, *, represent level of significant at 1%, 5%, 10%, respectively. The estimated standard errors are presented in the parentheses. The table omits the non-statistically significant variables commons to models 1 to 6.
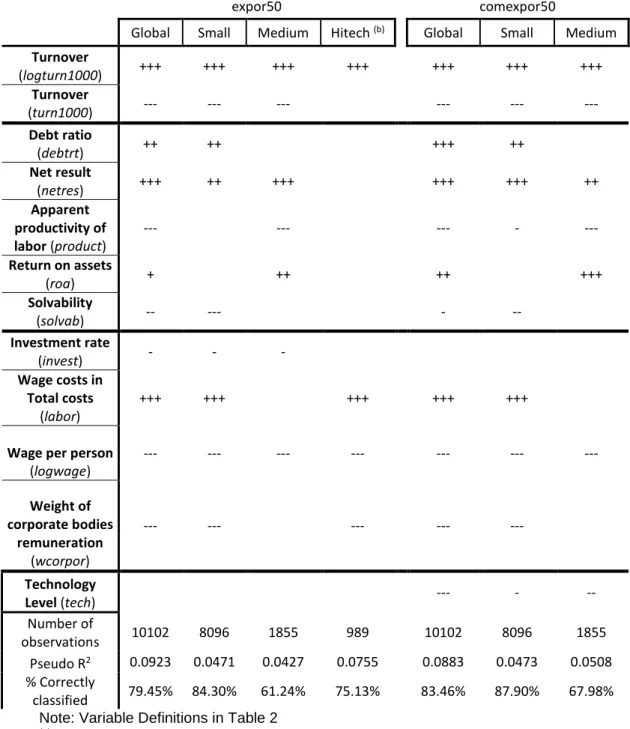
4.2.2 Probit Models
Using the binary dependent variable expor50, were tested global models, by size and by technological level. In the global model, an increase by one unit in the turnover (logturn1000) provides a 13% increase in the probability of the SME to export 50% or more of the sales, while an increase of 1% in weight of
26 corporate bodies’ remuneration (wcorpor) in total remuneration reduces by 19% the probability of the firm exporting 50% or more of the sales (see Table A4 and Probit Models outputs, appendix). For all the probit models estimated (Table A4 in appendix), the Pseudo R2 and the percentage of correctly classified cases reflect a good quality of the estimations.
For the models of small and medium enterprises, analyzed in separate, the variables with the greatest explanatory power remain the turnover (logturn1000) and the weight of corporate bodies’ remuneration (wcorpor). However, in both models there are different variables that must be referenced, such as the wage costs in total costs (labor) for the small firms. In the case of medium-sized enterprises, the variables with the greatest explanatory power are the logarithm of turnover (logturn1000), the return on assets (roa) and the log of wage per person (logwage) all with positive signs in the marginal effects after probit.
Upon the estimation of the model for subsamples according to the technological level, an aggregation of technological level 3 (Medium-High) and 4 (High) was made, defining them as Hitech. In this model the four variables with statistical significance are: the turnover (logturn1000) and the wage costs in total cost (labor) with a positive effect; and the wage per person (logwage) and the weight of corporate bodies’ remuneration (wcorpor) with the negative effect. (see Table A4 and Probit Models output, in appendix).
Finally, it was created a dummy variable only for the EU markets exports,
comexpor50, to explain the predominance of exports (50% or more of the sales)
only considering the EC market. The subsamples of size and technological level are considered in separate (Table A4 in Appendix, columns 5, 6 and 7). In the
27 case of EU market exports predominance, for the global model and the model of small firms, the variables with the more explanatory power and that are statistical significant are: turnover (logturn1000) and the weight of corporate bodies’ remuneration (wcorpor), like what happen in the estimated models for the all the exports independently from the geographical orientation (expor50). Regarding the estimated model for medium firms, in addition to the above variables, the log of wage per person and the return on assets are statistical significant. (see Table A4 and Probit models output, appendix). The output 8. (in Appendix) show that comparing to small firms, the medium firms have additional 20% of probability of exporting more than half of their sales to EU markets and for the belonging to sectors with high or middle-high technological level (techhig=1) the probability of exporting more than 50% of their sales to the EU markets decreases by 4.6%.
5. Conclusions
Taking as the unit of observation manufacturing SMEs, the export intensity is analyzed for 2011. This analyze is performed for the total sample (N= 12,128) and also for subsamples of different sizes (small vs. medium) and belonging to sectors with different technological levels. The exports to EC markets are also studied separately.
The main conclusions from this investigation are:
From the descriptive analysis:
- The firms that belong to the clothing and footwear sectors (NACE 14 and 15), two sectors are classified as low technological level (Eurostat 2014).
28 (Table A3, appendix), traditional Portuguese sectors and traditional exporters, are the ones that present higher export intensity.
- There are significant differences in export intensity by size: medium-sized firms take great advantage because the average percentage of foreign sales per firm for the first group is 17% and for the second 44% (Table A3, appendix).
- The EU market is the largest importer of Portuguese SMEs products, with an exception for three sectors where the division between the two markets (EC and non-EC) is identical: manufacture of beverages, industry pharmaceuticals, industry of repair and installation of machinery (Table A3, appendix).
- Regarding the technological level of the sector which firms belong, exist a huge variation on export intensity. Computer, electronic and optical products, belonging to the high level of technology has a share of 40% of sales to exports.
Motor vehicles, trailers and semi-trailers and Other transport equipment,
medium-high 3, have a share of 37% and 46% of exports per firm. (Table A3, appendix). There are also significant differences in the technological level by firm size.
From the explanatory models of export intensity:
- Following the literature, the explanatory factors associated to financial performance that shows positive contributes for the exports are the net result and the return on assets, (Table A1, appendix).
29 - For the variables related to debt (debt ratio, debt-to-equity ratio and
financial autonomy), the results show an inverse relationship between financial
difficulties and exports in particular for small firms and with a low level of technology (Table 2). This results diverge from the literature (Table A1),
- The firm size is usually measured by the turnover or by the number of
workers. Both measures were tested and results show a positive effect.
Vougaris, Doumpos and Zopounidis (2000) and Kirca, Hult et al. (2011) using turnover to evaluate size demonstrate the same.
- The subsamples of the small and medium enterprises show common results (Table 2), although: the small firms present additionally the debt with a positive effect on export intensity and the management complexity with a negative effect; and (ii) for the medium firms, these two variables are not statiscally significant.
- The firms with more intensity in labor related to capital have higher export intensity. The wage per person has a negative impact on export intensity. The productivity shows for some samples a positive explanatory power, converging with the investigation of Alvarez and Lopez (2012) and Boso, Cadogan and Story (2012).
- The proxy for innovation, weight of R&D costs does not show statistical significance (Table A1), diverging from the literature what can be explained by the use of one single year in this study. The weight of intangible fixed assets and solvability are also not statiscally significant.
30 This research has several limitations, and some of them suggest clues for future research. Three are suggested below.
An important limitation was the impossibility to detect trends and dynamics of export performance, since there are only data for 2011. A clue for future research would be include variables in to analyze periods prior to 2011 (e. g. growth rates, accumulated values and lagged variables).
One investigation lead is exploring the relations of mutual causality, with longitudinal data, for example, if the net results correspond to determinants of exports, or if the exports determine these net results.
The exports intensity are one from several components of internationalization intensity. In the future, issues like the participation of foreign capital could be studied.
Acknowledgment
I would like to thank to my parents for all the support provided throughout my academic life, with particular focus at this stage. I also want to thank to all my family and friends who were present and also helped at this stage. However, my special thanks go to Professor Elsa Maria Nobre da Silva Fontainha for all the dedication, ability and commitment that guided this dissertation. Finally, I want dedicate this work to my grandfather, José Maria da Fonseca.
31
References
Alvarez, R., & Lopez, R. A. (2012). Financial development, exporting and firm heterogeneity in Chile. Review of World Economics, 149(1), 183-207.
Amador, J., & Opromolla, L. D. (2009). Textiles and clothing exporting sectors in Portugal–recent trends. Banco de Portugal Economic Bulletin Spring, 145-166.
Andrew, B. B., & Jensen, J. B. (2004). Why some firms export. The Review of
Economics and Statistics, MIT Press, vol. 86(2), pages 561-569, 04
Banco de Portugal (2013) Economic Bulletin, Winter 2013, Banco de Portugal.
Bonaccorsi, A. (1992). On the relationship between Firm size and Export intensity.
Journal of International Business Studies Vol. 23, No. 4, pp. 605-635
Boso, N., Cadogan, J. W., & Story, V. M. (2012). Complementary effect of entrepreneurial and market orientations on export new product success under differing levels of competitive intensity and financial capital. International
Business Review, 21(4), 667-681.
Chen, K. H., & Shimerda, T. A. (1981). An empirical-analysis of useful financial ratios.
Financial Management, 10(1), 51-60.
Chiao, Y.-C., & Li, P.-Y. (2009). Are more exports better for a firm's performance? The moderating effect of FDI. European Journal of International Management, 3(3), 286-301.
Durmusoglu, S. S., Apfelthaler, G., Nayir, D. Z., Alvarez, R., & Mughan, T. (2012). The effect of government-designed export promotion service use on small and medium-sized enterprise goal achievement: A multidimensional view of export performance. Industrial Marketing Management, 41(4), 680-691.
Dunford, M., Liu, W., Liu, Z., & Yeung, G. (2013). Geography, trade and regional development: the role of wage costs, exchange rates and currency/capital movements. Journal of Economic Geography, lbt025.
European Commission (2014) European Competitiveness Report 2014, Helping Firms Grow, Commission Staff Working Document,SWD(2014)6319 final Directorate-General for Enterprise and Industry, Unit A5 - Economic Analysis and Impact Assessment Unit, European Union.
Eurostat (2014), Eurostat indicators of high-tech industry and knowledge-intensive services, January 2014. Annex 3 – High-tech aggregation by NACE Rev. 2.Annex 8 – Knowledge intensive activities by NACE Rev. 2.
Ferreira, J., Raposo, M., & Fernandes, C. (2012). The Influence of Innovative Capacity on Firms Performance: Portuguese and Spanish Evidences.
Proceedings of the 7th European Conference on Innovation and Entrepreneurship, Vols 1 and 2, 226-234.
32
Floriani, D. E., & Fleury, M. T. (2012). O efeito do grau de internacionalização nas competências internacionais e no desempenho financeiro da PME brasileira.
Revista de Administração Contemporânea, 16(3), 438-458.
Gamba, V., & Montanaro, L. (2009). Does internationalisation emerge from accounting documents? A survey among piedmont firms. Managerial and entrepreneurial developments in the Mediterranean Area, EuroMed Press, pp. 637-658
Gombola, M. J., & Ketz, J. E. (1983). A note on cash flow and classification patterns of financial ratios. Accounting Review, 58(1), 105-114.
Griffith, D. A., & Czinkota, M. R. (2012). Release the constraints: Solving the problems of export financing in troublesome times. Business Horizons, 55(3), 251-260.
Gupta, M. C., & Huefner, R. J. (1972). Cluster analysis study of financial ratios and industry characteristics. Journal of Accounting Research, 10(1), 77-95.
Honório, L. C. (2009). Grau de internacionalização de empresas brasileiras de manufaturados e a influência de fatores organizacionais e estratégicos. RAM.
Revista de Administração Mackenzie, 10(5), 154-180.
INE (2012). Empresas Portuguesas 2011, Edição Lisboa-Portugal.
INE (2012) Statistical Yearbook of Portugal 2012 Statistics Portugal.
INE (2014). Empresas em Portugal 2012, Edição Lisboa-Portugal. Strategic
Management Journal, volume 22, Issue 6-7, pages 565-586.
Jing, R. (2012). The Collapse Speed of China's Exports in the 2008-2009 Financial Crisis. Cesifo Economic Studies, 58(4), 650-670.
Kirca, A. H., Hult, G. T. M., Roth, K., Cavusgil, S. T., Perryy, M. Z., Akdeniz, M. B., et al. (2011). Firm-specific assets, multinationality, and financial performance: A meta-analytic review and theoretical integration. Academy of Management
Journal, 54(1), 47-72.
Lee, S.-B., Kotabe, M., Yoon, A. H., & Kwon, K.-H. (2013). Export Strategies and Performance of Small and Medium-sized Enterprises: Evidence from Korean Manufacturing SMEs. Journal of Korea Trade, 17(1), 1-24.
Lisboa, A., Skarmeas, D., & Lages, C. (2013). Export market exploitation and exploration and performance Linear, moderated, complementary and non-linear effects. International Marketing Review, 30(3), 211-230.
Lu, Jane W. & Beamish, Paul W. (2001). The internationalization and performance of SMEs. Strategic Management Journal, 22: 565-586.
Machado, M. J. C. V. (2013). Balanced Scorecard: an empirical study of small and medium size enterprises. RBGN Review of Business Management, 15(46), 129-148.
33
Majocchi, A., & Zucchella, A. (2003). Internationalization and performance: Findings from a set of Italian SMEs. International Small Business Journal, 21(3), 249.268
Nunes, A. S. C. (2011). Os Determinantes da Performance Bancária durante a crise financeira: o caso dos países do Eurosistema, Trabalho Final de Mestrado Dissertação em Finanças, Instituto Superior de Economia e Gestão, Universidade Técnica de Lisboa (mimeo).
Okpara, J. O. (2009). Strategic choices, export orientation and export performance of SMEs in Nigeria. Management Decision, 47(8), 1281-1299.
Oliveira, P., & Teixeira, A. A. C. (2011). The internationalization profiles of Portuguese SMEs. Faculdade de Economia, Universidade do Porto.
Park, A., Yang, D., Shi, X., & Jiang, Y. (2010). Exporting and firm performance: Chinese exporters and the Asian financial crisis. Review of Economics and
Statistics, 92(4), 822-842.
Ricci, L. A., & Trionfetti, F. (2012). Productivity, Networks, and Export Performance: Evidence from a Cross-country Firm Dataset. Review of International
Economics, 20(3), 552-562.
Ruppenthal, T., & Bausch, A. (2009). Research on export performance over the past 10 years: a narrative review. European Journal of International Management, 3(3), 328-364.
Schlegelmilch, B. B., & Crook, J. N. (1988). Firm-level Determinants of Export Intensity. Economic Analysis & Policy, vol. 40 No. 1, 291-300
Singla, C., & George, R. (2013). Internationalization and performance: A contextual analysis of Indian firms. Journal of Business Research, volume 66, Issue 12, 2500-2506
Temouri, Y., Vogel, A., & Wagner, J. (2013). Self-selection into export markets by business services firms–Evidence from France, Germany and the United Kingdom. Structural Change and Economic Dynamics, 25, 146-158.
UCLA: Statistical Consulting Group. Introduction to STATA. from http://www.ats.ucla.edu/stat/stata /(accessed August, 2014).
Urbonavicius, S., & Dikcius, V. (2010). Export barriers during the periods of growth and recession: The major factors and propositions. Argumenta Oeconomica, 24(1), 31-47.
Viviani, J.-L. (2009). Export Implicit Financial Performance: The Case of French Wine Companies. International Food and Agribusiness Management Review, 12(3), 23-48.
Voulgaris, F., Doumpos, M., & Zopounidis, C. (2000). On the evaluation of Greek industrial SME's performance via multicriteria analysis of financial ratios.
34
Wang, Y.-H., & Lee, H.-S. (2008). A clustering method to identify representative financial ratios. Information Sciences, 178(4), 1087-1097.
Westhead, P., Wright, M., & Ucbasaran, D. (2001). The internationalization of new and small firms: A resource-based view. Journal of Business Venturing, 16(4), 333-358.
Wooldridge, J. M. (2012). Introductory Econometrics: A Modern Approach. Michigan
State University, 5th edition.
Xiang, D., Worthington, A. C., & Higgs, H. (2012). Firm-level Determinants and Impacts of Finance-seeking Behaviour and Outcomes for Small and Medium-sized Enterprises (SMEs) in Australia. Griffith Business School, No. 2011-15
Yang, Y., & Mallick, S. (2014). Explaining cross-country differences in exporting performance: The role of country-level macroeconomic environment.
International Business Review, 23(1), 246-259.
Yi, J. (2014). Firm heterogeneity, sunk costs, spatial characteristics and export market participation: Evidence from China. Journal of International Trade &
Economic Development, 23(3), 361-386.
Zou, S. M., Taylor, C. R., & Osland, G. E. (1998). The EXPERF scale: A cross-national generalized export performance measure. Journal of Intercross-national
35
Appendix
Table A1: Summary of literature about export intensity of firms Export intensity variables and explanatory factors
Variables and Explanatory
factors
Units Ratios Effect Authors
Dependent Variables Sales in External Market (extmkt100) % +
Floriani and Fleury (2012); Alvarez and Lopez (2012); Boso, Cadogan and Story (2012); Jane and Paul (2001); Andrew and Jensen
(2004); Schlegelmilch and Crook (1988)
Firms that are mainly exporters
(expor50)
% 1= if exports more than 50% of sales; 0= otherwise Sales in EU market (commkt) % Independent Variables FIRM SIZE Turnover
(logturn1000) € Ln (Volume of business in millions of Euros)
+ Voulgaris, Doumpos and
Zopounidis (2000)
+ Kirca, Hult et al (2011)
Turnover
(turn1000) € Volume of business in millions of Euros
+ Voulgaris, Doumpos and
Zopounidis (2000)
+ Kirca, Hult et al (2011)
Employee
(logwork) Ln (Employees in firms)
+ Alvarez and Lopez (2012)
- Jane and Paul (2001)
+ Kirca, Hult et al (2011)
Employee
(work) Employees in firms
+ Kirca, Hult et al (2011)
+ Boso, Cadogan and Story
(2012)
- Schlegelmilch and Crook
(1988)
+ Andrew and Jensen (2004)
FINANCIAL PERFORMANCE Debt ratio
(debtrt) % +
Voulgaris, Doumpos and Zopounidis (2000)
Debt-to-equity
36
Financial Autonomy
(finauton)
€ +
Voulgaris, Doumpos and Zopounidis (2000)
Net result
(netres) M€ EBITDA
+ Floriani and Fleury (2012)
+ Kirca, Hult et al (2011)
Apparent Productivity of labor (product)
€
+ Alvarez and Lopez (2012)
+ Boso, Cadogan and Story
(2012)
Return on
assets (roa) %
+ Voulgaris, Doumpos and
Zopounidis (2000)
+ Floriani and Fleury (2012)
+ Kirca, Hult et al (2011) Solvability (solvab) € Weight of intangible fixed assets (wintang) % EXPENDITURE VARIABLES Research and Development (inov)
Employees assigned to Research and Development
+ Floriani and Fleury (2012)
+ Jane and Paul (2001)
+ Kirca, Hult et al (2011)
+ Schlegelmilch and Crook
(1988)
Investment
Rate (invest) %
Floriani and Fleury (2012)
+ Kirca, Hult et al (2011) Wage costs in total costs (labor) € Wage per person (logwage) € -
Alvarez and Lopez (2012)
Wage per
person (wage) € +
Andrew and Jensen (2004)
Weight of corporate bodies remuneration (wcorpor) % Technology Level (level) %
1- Low; 2- Low; 3- Medium-High; 4- High
37
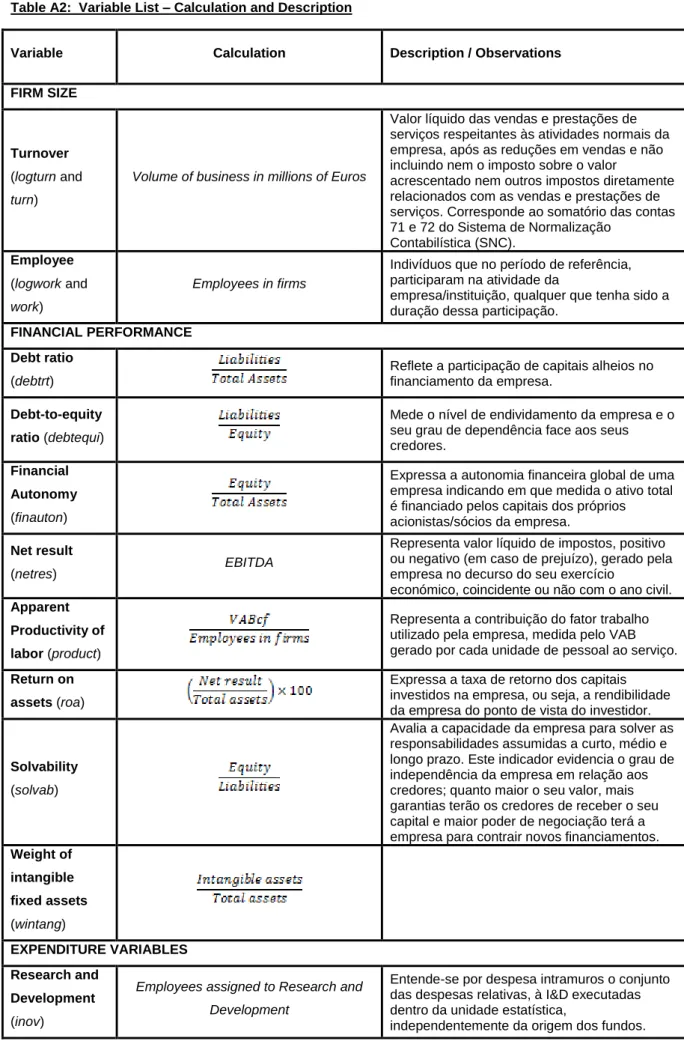
Table A2: Variable List – Calculation and Description
Variable Calculation Description / Observations FIRM SIZE
Turnover
(logturn and turn)
Volume of business in millions of Euros
Valor líquido das vendas e prestações de serviços respeitantes às atividades normais da empresa, após as reduções em vendas e não incluindo nem o imposto sobre o valor
acrescentado nem outros impostos diretamente relacionados com as vendas e prestações de serviços. Corresponde ao somatório das contas 71 e 72 do Sistema de Normalização Contabilística (SNC). Employee (logwork and work) Employees in firms
Indivíduos que no período de referência, participaram na atividade da
empresa/instituição, qualquer que tenha sido a duração dessa participação.
FINANCIAL PERFORMANCE Debt ratio
(debtrt)
Reflete a participação de capitais alheios no financiamento da empresa.
Debt-to-equity ratio (debtequi)
Mede o nível de endividamento da empresa e o seu grau de dependência face aos seus credores.
Financial Autonomy
(finauton)
Expressa a autonomia financeira global de uma empresa indicando em que medida o ativo total é financiado pelos capitais dos próprios acionistas/sócios da empresa.
Net result
(netres) EBITDA
Representa valor líquido de impostos, positivo ou negativo (em caso de prejuízo), gerado pela empresa no decurso do seu exercício
económico, coincidente ou não com o ano civil.
Apparent Productivity of labor (product)
Representa a contribuição do fator trabalho utilizado pela empresa, medida pelo VAB gerado por cada unidade de pessoal ao serviço.
Return on assets (roa)
Expressa a taxa de retorno dos capitais investidos na empresa, ou seja, a rendibilidade da empresa do ponto de vista do investidor.
Solvability
(solvab)
Avalia a capacidade da empresa para solver as responsabilidades assumidas a curto, médio e longo prazo. Este indicador evidencia o grau de independência da empresa em relação aos credores; quanto maior o seu valor, mais garantias terão os credores de receber o seu capital e maior poder de negociação terá a empresa para contrair novos financiamentos.
Weight of intangible fixed assets (wintang) EXPENDITURE VARIABLES Research and Development (inov)
Employees assigned to Research and Development
Entende-se por despesa intramuros o conjunto das despesas relativas, à I&D executadas dentro da unidade estatística,
38
Investment Rate (invest)
Representa o peso da formação bruta de capital fixo em relação ao valor acrescentado bruto.
Wage costs in total costs (labor) Wage per person (logwage)
Expressa o contributo médio de cada trabalhador, no total de gastos com o pessoal suportados pela empresa, correspondendo ao quociente entre os Gastos com o pessoal e o Número de pessoas ao serviço na empresa.
Weight of corporate bodies remuneration (wcorpor) Tecnology Level (tech)
1- Low; 2- Medium-Low; 3- Medium-High;
39 Table A3 - Share of exports in total sales by firm (Means by sector and size category) % of exports in
sales - Total % of Exports to EC market EC market in total sales - Total EC market in Small Firms EC market in Medium Firms
CAE_2dig Sector (Manufacture) Tech (**) Mean (*) N Mean (*) N Mean (*) N Mean (*) N Mean (*) N 10 Food products 1 5.15 1789 74.75 534 3.88 1789 3.41 1489 13.47 253 11 Beverages 1 21.16 222 50.50 170 10.85 222 19.84 180 27.35 33 12 Tabacco products 1 0.18 1 83.62 1 0.15 1 0.18 1 13 Textiles 1 28.94 534 81.47 386 23.21 534 22.51 400 49.50 127
14 Wearing apparel 1 44.53 993 89.90 699 41.70 993 37.19 730 64.30 256
15 Leather and related products (includes footwear) 1 42.89 683 90.15 513 39.60 683 32.19 476 67.73 205
16 Wood and of products of wood 1 21.73 571 76.45 348 16.83 571 18.13 493 43.07 72 17 Paper and paper products 1 10.56 160 82.26 122 8.77 160 6.60 123 21.08 35 18 Printing and reproduction of recorded media 1 5.13 349 65.66 210 3.16 349 4.10 313 14.16 35 20 Chemicals and chemical products 3 15.47 158 62.56 109 10.40 158 11.68 118 22.67 24 21 Basic pharmaceutical products and pharmaceutical preparations 4 18.70 42 51.44 27 12.58 42 13.95 16 20.61 24 22 Rubber and plastic products 2 23.20 411 81.24 342 19.94 411 16.73 311 45.56 92 23 Other non-metalic mineral products 2 25.24 743 71.49 495 18.21 743 22.12 618 42.34 120 24 Basic metals 2 29.44 85 78.72 66 25.20 85 18.80 43 45.10 31 25 Fabricated metal products, except machinery and equipment 2 21.22 1467 73.32 914 15.79 1467 17.37 1243 41.79 212
26 Computer, electronic and optical produts 4 39.66 52 65.02 42 25.02 52 31.33 35 56.60 16
27 Electrical equipment 3 25.80 158 63.74 117 18.74 158 20.96 117 38.19 38 28 Machinery and equipment n.e.c 3 28.90 392 62.23 311 18.00 392 23.55 309 48.09 79
29 Motor vehicles, trailers and semi-trailers 3 37.06 141 76.15 116 30.66 141 26.39 91 55.77 48
30 Other transport equipment 3 45.71 46 82.83 33 37.16 46 39.78 28 52.31 17
31 Furniture (inlcui todo o tipo de mobiliário) 1 21.92 728 72.34 494 17.51 728 18.34 640 47.94 88 32 Other manufacturing 1 23.81 186 65.73 132 17.37 186 19.12 156 49.86 29 33 Repair and installation of machinery and equipment 2 10.48 194 53.98 105 5.64 194 8.42 170 27.12 20
Total 22.87 10105 75.46 6286 18.40 10105 17.85 8099 44.08 1855
40
Figure A.1- Weight of global demand components in Portuguese GDP (percentage) 1995-2013
Source: Banco de Portugal and Statistics Portugal (INE)
Figure A.2 – Real Gross Domestic Product, Exports and Imports Portugal 2009Q1 – 2014Q1 ;
(year-on-year rate of change - y.r. - in percentages)
Source: Banco de Portugal
Figure A.3 – Contribution of domestic demand and net exports (p.p.) to GDPmp real growth (%)_
41
Table A4 Marginal Effects after Probit (summary qualitative table)(a)
expor50 comexpor50
Global Small Medium Hitech (b) Global Small Medium
Turnover (logturn1000) +++ +++ +++ +++ +++ +++ +++ Turnover (turn1000) --- --- --- --- --- --- Debt ratio (debtrt) ++ ++ +++ ++ Net result (netres) +++ ++ +++ +++ +++ ++ Apparent productivity of labor (product) --- --- --- - --- Return on assets (roa) + ++ ++ +++ Solvability (solvab) -- --- - -- Investment rate (invest) - - - Wage costs in Total costs (labor) +++ +++ +++ +++ +++
Wage per person
(logwage) --- --- --- --- --- --- --- Weight of corporate bodies remuneration (wcorpor) --- --- --- --- --- Technology Level (tech) --- - -- Number of observations 10102 8096 1855 989 10102 8096 1855 Pseudo R2 0.0923 0.0471 0.0427 0.0755 0.0883 0.0473 0.0508 % Correctly classified 79.45% 84.30% 61.24% 75.13% 83.46% 87.90% 67.98% Note: Variable Definitions in Table 2
(a)See Tables Probit Models output in Appendix for the STATA Output with the Marginal Effects
values.
(b) Hitech subsample of firms definition is based on tech variable (see Table A1 e A2 with
variable definitions) Hitech, a dummy variable is defined grouping the categories 3 and 4 of tech (hitech=1) and categories 1 and 2 of tech (hitech=0). This subsample includes only 3 and 4 categories.