Luís Miguel Paredes Blanco
Licenciado em Engenharia Geológica
Compaction quality control on site of
earthworks - A comparative study
Dissertação para obtenção do Grau de Mestre em
Engenharia Geológica (Geotecnia)
Orientadora: Prof. Doutora Ana Paula Fernandes da Silva
(FCT/UNL)
Co-orientador: Mestre Eng.º Alexandre M. Gameira dos
Santos Ferreira (DGRM)
Júri:
Presidente: Prof. Doutor Pedro Calé da Cunha Lamas Arguente: Prof. Doutora Maria da Graça Azevedo Brito
Vogal: Prof. Doutora Ana Paula Fernandes da Silva
II Compaction quality control on site of earthworks - A comparative study
Copyright @2015 Luís Miguel Paredes Blanco
III
A
CKNOWLEDGMENTS
A presente dissertação representa o culminar de um percurso académico que não poderia ter sido ultrapassado sem a ajuda de algumas pessoas e entidades. Desde já quero deixar um enorme obrigado a todos os que, de alguma forma contribuíram para a elaboração desta dissertação.
Ao engenheiro Santos Ferreira, por toda a disponibilidade e paciência demonstrados durante a realização deste trabalho.
À professora Ana Paula Silva, pela oportunidade de realizar este projecto, assim como pela partilha de conhecimentos, amizade e compreensão demonstrados durante a realização desta dissertação e percurso académico. Agradeço, ainda, a extensa e cuidada revisão desta dissertação.
Às intuições Instituto Portuário e dos Transportes Marítimos (IPTM) e Direção Geral dos Recursos Marítimos (DGRM), pela possibilidade de realizar o estágio nas mesmas.
Aos meus pais, por todo o amor e carinho demonstrados, bem como por todos os sacrifícios que realizaram para me poderem facultar as melhores condições de vida.
A todos os meus familiares.
À Bárbara Carreira, por toda ajuda, compreensão, carinho e atenção demonstrada.
Aos meus amigos, Andreia Barbas, André Costa, Diana Silva, Henrique Lopes, Luís Conceição pelo apoio, momentos de diversão proporcionado ao longo deste percurso académico.
V
A
BSTRACT
The capacity to use geologic materials (soil and rock) that are available in the surrounding environment is inherent to the human civilization and has contributed to the evolution of societies throughout the course of history. The use of these materials in the construction of structures such as houses, roads, railways or dams, stirred the improvement of socioeconomic and environmental conditions.
Several reports of structural problems on embankments can be found throughout history. A considerable number of those registers can be linked to inadequate compaction, demonstrating the importance of guaranteeing a suitable quality of soil compaction. Various methodologies and specifications of compaction quality control on site of earthworks, based on the fill moisture content and dry unit weight, were developed during the 20th century. Two widely known methodologies are the conventional and nuclear techniques. The conventional methods are based on the use of the field sand cone test (or similar) and sampling of material for laboratory-based testing to evaluate the fill dry unit weight and water content. The nuclear techniques measure both parameters in the field using a nuclear density gauge.
A topic under discussion in the geotechnical community, namely in Portugal, is the comparison between the accuracy of the nuclear gauge and sand cone test results for assessing the compaction and density ratio of earth fills, particularly for dams. The main purpose of this dissertation is to compare both of them. The data used were acquired during the compaction quality control operations at the Coutada/Tamujais dam trial embankment and core construction. This is a 25 m high earth dam located in Vila Velha de Rodão, Portugal. To analyse the spatial distribution of the compaction parameters (water content and compaction ratio), a 3D model was also developed.
The main results achieved are discussed and finally some considerations are put forward on the suitability of both techniques to ensure fill compaction quality and on additional research to complement the conclusions obtained.
VII
R
ESUMO
A capacidade de recorrer a materiais geológicos (solo e rocha) presentes no meio envolvente é inerente à civilização humana e tem contribuído para o seu desenvolvimento ao longo da história. A utilização destes materiais na construção de infraestruturas como estradas, habitações ou barragens, estimulou uma melhoria gradual das condições socioeconómicas e ambientais.
Ao longo da história podem ser encontrados diversos relatos sobre problemas estruturais em aterros que podem ser associados a processos de compactação inadequados, demonstrando-se assim a importância de controlar a qualidade da compactação. Para esse propósito foram desenvolvidas diversas metodologias e especificações durante o séc. XX, baseadas no peso específico e o teor em água do solo após colocação no aterro.
Duas metodologias amplamente utlizadas nas operações de controlo são designadas por convencional e nuclear. Na metodologia convencional usa-se o ensaio da garrafa de areia (ou similar) através do qual se colhem amostras que são enviadas para laboratório para determinar o seu peso volúmico e teor em água in situ. Na técnica nuclear recorre-se ao gamadensímetro nuclear para determinar ambos os parâmetros.
Um tópico debatido na comunidade geotécnica, nomeadamente em Portugal, é a comparação do grau de exactidão dos resultados obtidos pelos ensaios com o gamadensímetro nuclear e a garrafa de areia para obter o grau de compactação e o peso volúmico, in situ, durante o controlo de compactação de aterros, particularmente em barragens de aterro. O principal objectivo da presente dissertação consiste em comparar os resultados obtidos pelos ensaios acima referidos durante o controlo de compactação. Para realizar este estudo foram utilizados dados referentes ao empreendimento da barragem de Coutada/Tamujais, que consiste numa barragem de terra com 25 m de altura situada em Vila Velha de Rodão, Portugal. Adicionalmente, foram realizados modelos tridimensionais para analisar a distribuição espacial dos parâmetros de compactação (teor em água e grau de compactação).
Os resultados obtidos são discutidos, e tecem-se considerações sobre a aplicabilidade de ambas as técnicas durante o controlo de compactação. Adicionalmente, sugerem-se trabalhos futuros a desenvolver sobre o presente tema.
IX
T
ABLE OF
C
ONTENTS
Acknowledgments ... III Abstract... V Resumo ... VII Table of Contents ... IX List of Illustrations ... XIII List of Tables ...XVII List of Acronyms ...XIX List of Symbols ...XXI
1. Introduction ... 1
1.1. Objectives and methodology ... 2
1.2. Organization ... 3
2. Earth dams ... 5
2.1. Definition and classification ... 5
2.1.1. Types of embankment dams ... 5
2.1.2. Types of earth dams ... 6
2.2. Historical evolution ... 8
2.3. Dam failures ... 12
2.4. Earth dams components ... 15
2.5. Construction phases ... 16
2.6. Construction techniques and quality control of fills ... 17
3. Soil compaction ... 21
3.1. Soil origin and proprieties ... 21
3.1.1. Soil description and classification ... 24
3.1.2. Volumetric relations ... 25
3.2. Soil compaction - general principles ... 27
3.2.1. Proctor test ... 29
3.2.2. Compaction of cohesive soils ... 31
3.2.3. Compaction of cohesionless soils ... 33
3.2.4. Compaction of soils and water contents ... 34
X
3.4. Compaction specifications ... 38
3.5. Trial embankment ... 39
3.6. Compaction control ... 40
3.6.1. Determination of the fill unit weight... 41
3.6.1.1. Sand cone test ... 42
3.6.1.2. Nuclear method ... 43
3.6.2. Determination of the water content... 45
3.6.3. Comparision between SCT and NDG... 47
3.6.4. Comparison between field and laboratory compaction control ... 56
3.6.4.1. Hilf method ... 56
3.6.4.2. Family of curves method ... 57
4. Case Study ... 61
4.1. Coutada/Tamujais Dam ... 61
4.1.1. Main characteristics ... 61
4.1.2. Morphology ... 62
4.1.3. Regional geology and tectonic ... 62
4.1.4. Hydrogeology and seismicity ... 64
4.1.5. Local geology ... 64
4.1.5.1. Dam reservoir ... 64
4.1.5.2. Dam axis ... 64
4.2. Earth materials ... 64
4.3. Site investigation and laboratory tests ... 65
4.4. Construction materials ... 66
4.4.1. Borrow area A - Alluvium materials ... 66
4.4.2. Borrow area B and B’- Arkosic materials ... 67
4.5. Trial embankment ... 67
4.5.1. Construction procedures ... 68
4.5.2. Compaction control ... 70
4.5.3. Data analysis – Methodology ... 72
4.5.4. Results ... 73
XI
4.5.4.2. Comparison between SCT and NDG results for stage 2... 80
4.5.4.3. Comparison between SCT and NDG results for stage 3... 86
4.5.5. Trial embankment main conclusions ... 91
4.6. Core fill ... 94
4.6.1. Construction procedures ... 94
4.6.2. Compaction control ... 95
4.6.3. Data analysis – Methodology ... 96
4.6.4. Results ... 97
4.6.4.1. Point to vicinity points comparison ... 97
4.6.4.2. Point to mean of vicinity points comparison ... 98
4.6.4.3. Closest point comparison ... 99
4.6.4.4. Core and stage 2 trial embankment results comparison ... 100
4.6.5. Spatial variability modelling ... 101
4.6.6. Core fill control main conclusions ... 107
5. Final considerations and future works ... 111
References ... 119
Annexes ... 125 Annex I - Hilf method
XIII
L
IST OF
I
LLUSTRATIONS
Figure 1.1 - Typical sections for embankments... 1
Figure 1.2 - Methodology used for the comparison between the conventional and nuclear methodologies ... 3
Figure 2.1 – Embankment dam classification systems ... 5
Figure 2.2 - Earthfill dams types ... 7
Figure 2.3 - Sadd-El-Kafarra dam ... 8
Figure 2.4 - View of the Cornalvo (1) and the Prosperina (2) dams ... 9
Figure 2.5 - Number of dams inaugurated per each decade of the 20th century ... 10
Figure 2.6 - World distribution of each type of dam ... 10
Figure 2.7 - Distribution of large dams in the world ... 11
Figure 2.8 - Dams purpose ... 11
Figure 2.9 - Geographic distribution of dam failures ... 13
Figure 2.10 - Percentages of causes for earth dam failures ... 14
Figure 2.11 - Percentages of sub-cases of quality problems for earth dam failures ... 15
Figure 2.12 - Earth dam components ... 15
Figure 2.13- Construction processes for embankments ... 17
Figure 3.1 - Transportation processes of weathered materials ... 22
Figure 3.2 - Hjulström diagram ... 22
Figure 3.3 - Soil formation processes ... 24
Figure 3.4 - Soil phases ... 25
Figure 3.5 - Compaction curve ... 28
Figure 3.6 - Effects of the compactive effort on compaction characteristics ... 29
Figure 3.7 - Apparatus for the Proctor test ... 30
Figure 3.8 - Water-clay relation ... 32
Figure 3.9 - Compaction curves for six types of soil, compacted with the Standard Proctor test ... 33
Figure 3.10 - Generic compaction curve for cohesionless soils ... 33
Figure 3.11 - Wet and dry side of optimum in soils ... 34
Figure 3.12 - Effects of compaction on the structure of the soil ... 35
Figure 3.13 - Sand cone test apparatus ... 42
Figure 3.14 - NDG equipment and its main parts ... 44
Figure 3.15 - Control of compaction using the nuclear gauge ... 44
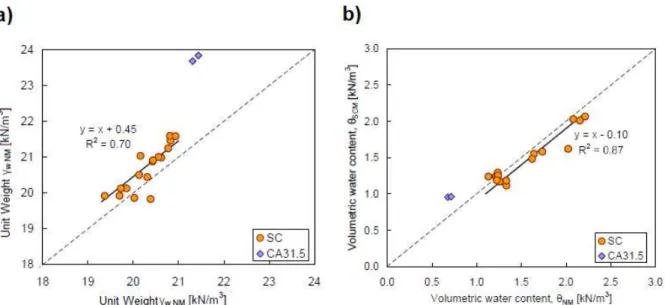
Figure 3.16 - Comparison between the results from the conventional and nuclear approach ... 49
Figure 3.17 - Comparison of soil parameters obtained from NDG and conventional methodology performed on the same grid ... 50
Figure 3.18 - Comparison of soil parameters per layer obtained from nuclear and conventional methodology ... 51
XIV Figure 3.20 - Comparison of state parameters per layer obtained from nuclear and conventional
methodology ... 52
Figure 3.21 - Comparison of field moisture measurements with NDG with the OVM ... 53
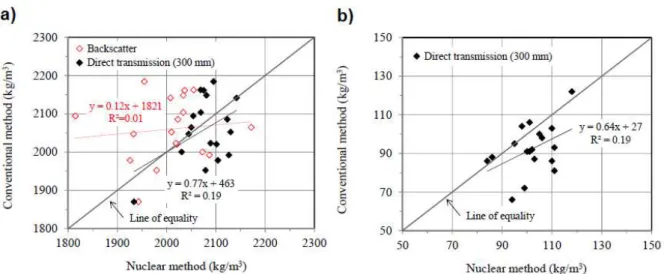
Figure 3.22 - Comparison of the wet density results obtained with backscatter and direct mode ... 54
Figure 3.23 - Comparison of soil parameters per layer obtained within nuclear and conventional methodologies ... 55
Figure 3.24 - Family of curves ... 59
Figure 4.1 - General view of Tamujais/Coutada dam ... 61
Figure 4.2 - Excerpt from the Carta Geológica de Portugal, Folha 24-D- Castelo Branco at the original scale of 1/50 000 ... 63
Figure 4.3- Location of the trial embankment within the structure, rescaled from the original of 1:500 68 Figure 4.4 - Location of the compaction control tests performed ... 69
Figure 4.5 - Procedure for the compaction of each 10 m stripes, with the equipment overlapping 0.5m ... 70
Figure 4.6 – Scattergrams for the 𝛾𝑓𝑖𝑙𝑙, 𝜔𝑓𝑖𝑙𝑙, and DC parameters obtained with the first analysis, for stage 1 results ... 76
Figure 4.7 - Scattering for the second analysis of stage 1, considering all the measurements taken at different depths and placing water contents as one population ... 78
Figure 4.8 - Scattering for the third analysis of stage 1, considering the NDG results taken with the DM as one population ... 80
Figure 4.9 - Scattergrams for the 𝛾𝑓𝑖𝑙𝑙, 𝜔𝑓𝑖𝑙𝑙, and DC parameters obtained with the first analysis, for stage 2 results ... 83
Figure 4.10- Scattering for the second analysis of stage 2, considering all the measurements taken at different depths and placing water contents as one population ... 84
Figure 4.11 - Scattering for the third analysis of stage 2, considering the NDG results taken with the DM as one population ... 86
Figure 4.12 - Scattergrams for the 𝛾𝑓𝑖𝑙𝑙, 𝜔𝑓𝑖𝑙𝑙, and DC parameters obtained with the first analysis, for stage 3 results ... 89
Figure 4.13 Scattering for the second analysis of stage 3, considering all the measurements taken at different depths and placing water contents as one population ... 90
Figure 4.14- Scattering for the third analysis of stage 3, considering the NDG results taken with the DM as one population ... 91
Figure 4.15- Generic representation for the compaction control process used: one SCT is associated with a variable number of NDGs ... 96
Figure 4.16- Scattergrams for the point to vicinity points comparison ... 97
Figure 4.17- Scattergrams for the point to mean of vicinity points analysis ... 99
Figure 4.18- Scattergrams for the closest point analysis ... 100
Figure 4.19 - Fill unit Weight model for the SCT results with a vertical exaggeration of 2.5 ... 102
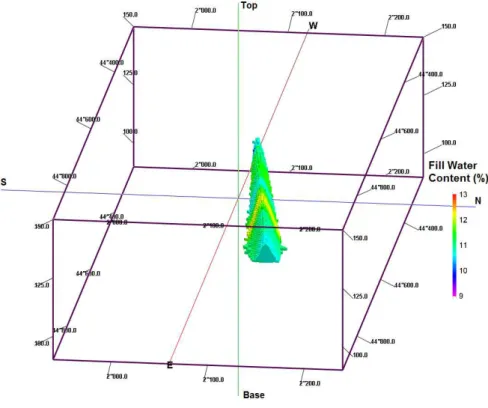
Figure 4.20 - Fill water content model for the SCT results with a vertical exaggeration of 2.5 ... 103
XVII
List of Table
S
Table 2.1 - Types of embankment dams ... 7
Table 2.2 - Examples of embankment dam failures ... 12
Table 2.3- Function of the structural elements represented in the Figure 2.12 ... 16
Table 3.1- Soil definitions from the points of view of an engineer and a geologist ... 21
Table 3.2 - Transportation processes and the types of deposits formed by each process ... 23
Table 3.3 - Portuguese, European and American Standards for soil identification... 25
Table 3.4 - Volume and weight relationships ... 26
Table 3.5 - Characteristics of the Proctor tests ... 31
Table 3.6- Portuguese and American Standards for the Proctor test ... 31
Table 3.7 - Characteristics from soils compacted on both sides of the compaction curve ... 34
Table 3.8 -Main features and Applicability of compaction Equipment ... 37
Table 3.9 - Commonly used devices to access the fill unit weight and water content ... 40
Table 3.10 - Portuguese and American Standards for the SCT... 43
Table 3.11- Portuguese, European and American Standards for the Oven Method ... 46
Table 3.12 - Evolution of the comparison between NDG and SCT between 1940 and 1981 ... 48
Table 4.1 - Borrow areas description ... 65
Table 4.2 - Site investigation works associated to each dam zone... 66
Table 4.3-Equipment and type of soil used in each construction stage ... 70
Table 4.4 –r ranges and their correlation ... 73
Table 4.5- Descriptive statistics for both methodologies obtained with the stage 1 results ... 75
Table 4.6 - Correlation matrix for the results from the first analysis that were applied to stage 1 data, considering the measurements taken at different depths, and different placing water contents as individual populations ... 77
Table 4.7- Correlation coefficients for the results of the second analysis that was applied to stage 1 data, considering all the measurements taken at different depths and placing water contents as one population ... 79
Table 4.8 - Correlation coefficients for the third analysis of stage 1, considering the NDG results as one population ... 80
Table 4.9-Descriptive statistics for both methodologies obtained with the stage 2 results ... 82
Table 4.10- Correlation matrix for the results from the first analysis that were applied to stage 2 data, considering the measurements taken at different depths, and different placing water contents as individual populations ... 84
Table 4.11-Correlation coefficient for the results of the second analysis that was applied to stage 2 data, considering all the measurements taken at different depths and placing water contents as one population ... 85
Table 4.12 - Correlation coefficients for the third analysis of stage 2, considering the NDG results as one population ... 86
XIX
L
IST OF
A
CRONYMS
AS Australian standards
ASBNT Associação Brasileira de Normas Técnicas ASTM American Society for Testing Materials BSM Backscatter mode
CEN European Committee for Normalization
CPNI Centre for the Protection of the National Infrastructure CIGB Comissão Internacional de Grandes Barragens DM Direct transmission mode
EDG Electrical density gauge EL Equality line
ESCS European Soil Classification System
FCT-UNL Faculdade de Ciências e Tecnologia - Universidade NOVA de Lisboa IDW Inverse distance weightening
ISAC Inert steel aggregate
ISO International Society of Standardization ICOLD International Commission of Large Dams IQR Interquartile range
IST Instituto Superior Técnico
LNEC Laboratório Nacional de Engenharia Civil
MADRP Ministério da Agricultura do Desenvolvimento Rural e das Pescas MDI Moisture density indicator
NDG Nuclear densimeter gauge
NP Norma Portuguesa
NRC National Research Council OMC Optimum moister content
OVM Oven method
SCT Sand cone test SDG Soil density gauge SPT Standard penetration test SS Steel shot
USACE United States Army Corps of Engineers USBR United Sates Bureau of Reclamation USCS United Soil Classification System
USDI-BR United States Department of the Interior-Bureau of Reclamation UTL Universidade Técnica de Lisboa
WB Water Balloon
XXI
L
IST OF
S
YMBOLS
Greek alphabet
𝛾 In situ or natural unit weight (kN/m3)
𝛾′ Submerged unit weight (kN/m3)
𝛾𝜔 Water unit weight (kN/m3)
𝛾𝜔𝑐 Cylinder wet unit weight (kN/m3)
𝛾𝜔𝑓𝑖𝑙𝑙 Fill wet unit weight (kN/m3)
𝛾𝑑 Dry unit weight (kN/m3)
𝛾𝑑𝑐 Cylinder dry unit weight (kN/m3)
𝛾𝑑,𝑓𝑖𝑒𝑙𝑑 Field dry unit weight (kN/m3)
𝛾𝑑𝑓𝑖𝑙𝑙 Fill dry unit weight (kN/m3)
𝛾𝑑,𝑟𝑒𝑓 Dry unit weight from the reference sand (kN/m3)
𝛾𝑑𝑚𝑎𝑥 Maximum dry unit weight (kN/m3)
𝛾𝑑𝑚𝑎𝑥,𝑙𝑎𝑏𝑜𝑟𝑎𝑡𝑜𝑟𝑦 Maximum dry unit weight obtained in laboratory (kN/m3)
𝛾𝑑𝑚𝑎𝑥,𝑟𝑒𝑓 Maximum dry unit weight for reference sample (kN/m3)
𝛾𝑠𝑎𝑚𝑝𝑙𝑒𝑚𝑎𝑥 Maximum wet unit weight for the sample (kN/m3)
𝛾𝑑𝑚𝑖𝑛 Minimum dry unit weight for purely (kN/m3)
𝛾𝑓𝑖𝑙𝑙 Fill unit weight (kN/m3)
𝛾𝑚𝑎𝑥 Converted maximum wet unit weight (kN/m3)
𝛾𝑠 Solids unit weight (kN/m3)
𝜂 Viscosity of the water (kg/m.s) 𝜌𝑠 Density of the soil particles (kg/m3)
𝜌𝑤 Density of the water (kg/m3)
𝜌𝑤𝑒𝑡 Wet density of compacted specimen (kg/m3)
𝜌𝑤𝑒𝑡𝑐 Converted wet density of compacted specimen (kg/m3)
𝜔 Water content (kN/m3)
𝜔𝑓𝑖𝑙𝑙 Fill water content (%)
𝜔𝐿 Liquid limit value (%)
𝜔𝑜𝑝𝑡 Optimum water content (%)
𝜔𝑃 Plastic limit (%)
𝜔𝑟𝑒𝑓 Optimum water content for the reference sample (%)
Latin alphabet
Α Coefficient of seismicity
C Relation between the fill and laboratory compactive efforts CL Inorganic clay with low to medium plasticity
D Diameter (m)
DC Degree of compaction (%)
𝑒 Void ratio
𝑒𝑚𝑎𝑥 Maximum void index for sand
𝑒𝑚𝑖𝑛 Minimum void index for sand g Gravitacional acceleration (m/s2)
𝐺𝑠 Specific gravity of the solid particles GC-GM Clayey gravel with silt
GP-GC Poorly graded gravel with clay GW-GC Well graded gravel with clay ℎ𝑑 Height of fall of the hammer (m)
𝑣 Velocity (m/s)
𝑀𝑐 Mass of container (kg)
𝑀𝑐𝑠 Mass of container and oven dry specimen (kg)
𝑀𝑐𝑤𝑠 Mass of container and wet specimen (kg)
𝑀ℎ Mass of the hammer (kg)
𝑀𝑠 Mass of solid particles (kg)
XXII
n Porosity (%)
𝑁𝑏 Number of blows given by the hammer
𝑁𝑡 Number of layers used on the test PI Plasticity index (%)
R Pearson coefficient
R2 Coefficient of determination
RC Relative compaction (%)
S Degree of saturation (%)
SC Clayey sand
SC-SM Clayey sand with silt
SM Silty sands
SW Well graded sand
SP-SM Poorly graded silty sands 𝑉 Volume of compacted soil (m3)
𝑉𝑎 Volume of air in the voids (m3)
𝑉𝑓 Volume of water that remains in the cylinder at the end of the test (m3)
𝑉𝑖 Volume of liquid in the cylinder when in the beginning of the test (m3)
𝑉𝑠 Volume of solids (m3)
Vs Versus
𝑉𝑇 Total volume of a soil sample (m3)
𝑉𝑣 Volume of voids (m3)
𝑉𝑤 Volume of water in the voids (m3)
𝑊𝑎/𝑟 Weight of water that was added or removed to the soil sample (kN)
𝑊𝐶+𝐽 Weight of the device composed by the jar and cone when filled with sand, during the sand cone test (kN)
𝑊𝐸𝑆 Weight of the excavated soil (kN)
𝑊𝐹𝐶 Weight of sand that used to fill the cone, during the sand cone test (kN)
𝑊𝐹𝐻 Weight of the sand that is used to fill the hole during the sand cone test (kN)
𝑊𝑊𝑠𝑎𝑚𝑝 Wet weight from the soil sample (kN)
𝑊𝑅𝐽 Weight of sand remaining in the jar, during the sand cone test (kN)
𝑊𝑆 Weight of soil solids (kN)
𝑊𝜔 Weight of water (kN)
1
1. I
NTRODUCTION
The ability to use soils and rocks from surrounding environment as construction materials is inherent to humans and this has contributed to the development of the first civilizations, which used them to build shelters. Nowadays, these geologic materials are used to build more complex structures, such as embankments.
Embankment can be defined as structure generally with a trapezoidal section, in which geological materials (soil or rock) are used as construction materials. Depending on the type of material, there are two types of embankments: earth and rock fills.
These structures can be used in a wide range of geotechnical projects, such as dams, slope stability, highways or landfills. However, its design and mechanical proprieties must be adapted in conformity with the type of project, since the desired behaviour for each type of embankment depends on the project purpose.
A typical example of this situation is the difference between the acceptable behaviour for earth dams and road embankments. An embankment dam is constructed to store water, therefore the existence of cracks in the embankment is unacceptable, since cracks allow water seepage and, in extreme cases, can lead to failure. On the other hand, this type of structures can support minor deformations, which are not tolerable in road construction once any minor deformations can create cracks in the road surface. Nonetheless, the presence of minor cracks in a road embankment will not affect its serviceability. Figure 1.1 represents typical profiles of embankments for different types of project. This dissertation focuses on the earth embankments associated to dam projects designated as earth fill dams.
A) Homogenous embankment for road/railway; B) Canal embankment.
Figure 1.1 - Typical sections for embankments (Gulhati & Datta, 2008)
2 Those failures showed the importance of ensuring the quality of the soil compaction, and stimulated the development of techniques to measure the results from soil compaction, which are mostly based on two properties:
Fill water content; Fill unit weight.
There are a wide variety of techniques that can be used during the compaction quality control operations; two commonly used methodologies are the conventional and the nuclear. The conventional methodology consists in using a sand cone test - SCT (or similar) and sampling of material for laboratory-based testing to evaluate the control parameters (fill water content and dry unit weight); in the nuclear methodology these parameters are measured by a nuclear density gauge (NDG).
The sand cone test is a time consuming and destructive method to access the control parameters in the field, in contrast to the nuclear gauge, which is a rapid and non-destructive test. However the accuracy of the nuclear gauge measurement relatively to the sand cone test has been questioned since their introduction during the 60s.
Nevertheless, the technical and technologic evolution witnessed in the last decades, allied to the short time period that is necessary to measure the control parameters with the nuclear gauge, and the fact that it is a non-destructive test, contributed to an increase of its popularity. Nowadays, it is a widely accepted method in compaction control operation but in some countries, namely in Portugal, the problem about which method is more accurate remains contemporary and is still discussed by the technical and scientific community.
1.1. O
BJECTIVES AND METHODOLOGY
This dissertation falls within the scope of the Mestrado em Engenharia Geológica (Geotecnia) from the Universidade NOVA de Lisboa- Faculdade de Ciências e Tecnologia (FCT-UNL). The main purpose of this work is to study the suitability of using the conventional (SCT) and nuclear methodologies (NDG) during compaction control operations, by comparing the accuracy of the results obtained during the construction of an earth dam (test fill and core).
It uses the results from the compaction quality control operations developed during the construction of the Coutada/Tamujais dam core and trial embankment, a 22.5 m high earthfill dam located in municipality of Vila Velha de Rodão, Portugal, comprising an area of 322 ha. The data from the trial embankment and core were analysed as two different case studies.
3 compaction) were compared through three types of bivariate analysis, which differed for each case study.
Complementarily, the results from the dam core quality control were plotted in three-dimensional models using Rockworks® (version15) software to study the spatial variation of the control parameters.
Figure 1.2 - Methodology used for the comparison between the conventional and nuclear methodologies
1.2. O
RGANIZATION
The dissertation is divided into five chapters, as summarized in the following paragraphs:
First chapter comprises the description of dissertation subject, objectives and organization; Second chapter consists in a state of the art about the history, types of earthfill dams and their
construction techniques;
4 Fourth chapter comprises all the aspects referent to the case study, the results achieved during the comparison between both methodologies for compaction control, the 3D model, and the discussion of the results;
Fifth chapter encompasses the final considerations, and suggestions about future researches that might be taken to complement the conclusions.
5
2. E
ARTH DAMS
This chapter consists in a brief review of general aspects related to earth dams, such as their concept and evolution through the course of the Human history, classification systems, construction phases and structural elements, and most usual designs.
2.1. D
EFINITION AND CLASSIFICATION
2.1.1. T
YPES OF EMBANKMENT DAMSThe dams described in this work can be defined as manmade structures built across valleys that act as barriers to store water. These structures can be classified by their construction materials, dimensions and storage capacity, hydraulic design, construction methods, and purpose (Figure 2.1). Taking into account the construction materials, these structures can be divided essentially in two types: rock fill, and earth fill dams. As the names indicate, an earth fill dam is predominately composed by soil materials; on the other hand, rock fill is mostly composed by rock materials. As mentioned before, this dissertation will focuses of the first type.
Figure 2.1 – Embankment dam classification systems
6 characteristics that are not adequate to other types of dams, like the ones made of concrete. This factors contribute to the popularity of earth fill dams (USBR, 2011).
A classification system regarding the dam dimensions and reservoir capacity was defined by international committee of large dams (ICOLD), this system divides dams in two types: large and small
dams. This institution defines large dams as “a dam with a height of 15 m or greater from lowest
foundation to crest or a dam between 5 m and 15 m impounding more than 3 million cubic meters”
(ICOLD, 2011 apud ICOLD, 2012).
This definition is commonly recognized in the world, however the Portuguese distinction between small and large dams, presented in the Decree-Law, n.o 344/2007 of 15 October by the Subcomissão dos Regulamentos de Barragens, differs from ICOLD, since it groups dams in two categories, with the following characteristics:
Large dams, structures with a height equal or higher to 15 m, or dams with an height equal or higher than 10 m with an reservoir capacity above 1 million m3;
Dams with a height lower than 15 m that cannot be included in the large dams category, and with a reservoir capacity lower than 100,000 m3.
Depending on the dam purpose, they can be divided into three classes: storage dams, diversion dams and detention dams. Storage dams as the name indicates are constructed to impound water for supply; diversion dams are used for carrying water into ditches, canals or other transportation systems, and detention dams retard and minimize the consequences of sudden floods (USBR, 1987).
2.1.2. T
YPES OF EARTH DAMSIn each earth dam project, the adopted design “must be realistic. It should reflect actual foundations
conditions at the site and the material available for embankment construction. It should not be patterned after a successful design used at a site with different conditions or material, or even at a site
with similar conditions. It should be designed for its specific site geology” (USBR, 1987). In other words, design should be adapted to the construction site, and based on the information retrieved during the investigation phase. In compliance with Moum et al. (1985) and Raj (2008), a design based classification for embankment dams, divides earth dams in three generic classes: diaphragm, homogeneous and zoned (Figure 2.2).
7
a) Homogenous earthfill; b) Homogeneous dam with diaphragm; c) Zoned embankment dam.
Figure 2.2 - Earthfill dams types (Moum, et al., 1985)
Table 2.1 - Types of embankment dams (adapted from Zackaria et al., 2006; Fell et al., 2015)
Dam type Typical section
Degree of filter control of internal erosion and piping Degree of control of pore pressures for stability Applicability Homogeneous
earth fill Non-existent Poor
Low hazard areas
Earth fill with
toe drain Poor Poor
Zoned earth fill Moderate Good Very low to significant hazard areas
Earth fill with
horizontal drain Poor Poor
Very low and low to significant if no population at risk
Earth fill with vertical and horizontal drain
Very good to
good Good Significant to extreme hazard areas
Earth and rock
fill, central core Very good Very good
Significant to extreme hazard areas. May be
costly and complicated for dams
less than 20m high
Earth and rock fill, sloping
upstream core Very good Very good
Significant to extreme hazard areas. May be
costly and complicated for dams
less than 20m high. Adequate for staged
8
2.2. H
ISTORICAL EVOLUTION
Dams played an unquestionable role in the human evolution, and the first ones to be constructed were mainly used to store water for agriculture, but currently dams usually have multiple purposes, for example: water supply, recreation, irrigation, and hydropower generation. Singh (1996) states that the oldest archaeological findings related to dams are located in Jawa, Jordan, and are dated from 4000 B.C.; this findings indicate the presence a structure used to store water constructed of earth with a masonry facing.
According to Singh & Varshey (1995) and Jesus (2011), the first significant developments in dam construction were set by the earliest civilization in the valleys of the Nile, Tigris and Euphrates and the Indus; all these cultures benefited from a climate and topography that were adequate for rain water storage. The dams constructed by these civilizations, with particular reference to the Egyptian civilization (2950 - 2750 B.C.), were earth embankments used for agriculture irrigation. One of the oldest dams recorded in this period is the Sadd-El-Kafara dam, in Egypt, with 4800 years old, composed of two rubble walls separated by a central fill formed by sand and gravel; this dam is represented in the Figure 2.3.
The next ground-breaking steps in dam construction were taken during the Roman Civilization, even though Romans used the same hydraulic concepts as the firsts civilizations mentioned above. They developed the capacity to construct more complex dams, and some of them are still functional, nowadays. This civilization introduced the construction of arc dams, in the 1st century A.D. Nero ordered the construction of a 40 m high arch dam for recreational purposes (Bretas et al., 2012). From all the dams constructed during this period, one must emphasize the Cornalvo dam (Figure 2.4-1) and the Prosperina dam (Figure 2.4-2), both located in the vicinity of Badajoz, Spain, which are both gravity dams dated from the 1st and 2nd centuries A.D., respectively.
9
Figure 2.4 - View of the Cornalvo (1) and the Prosperina (2) dams (Jesus, 2011)
According to Singh & Varshey (1995), until the 19th century embankment dam design was mostly based on empirical knowledge. The inexistence of appropriate design methodologies led to various dam failures throughout history, creating a disbelief in this type of dams and some limitations related to their maximum height. Usually and before 1925, the maximum height for these structures did not exceed 30 m; however, in that year, the USBR constructed an earth dam that exceeded 40 m in height. From this year forward, an increase of the knowledge associated to soil mechanics stimulated the resolution of problems associated to embankment dams construction and increased their popularity. The improvements in embankment dam construction where the following (op. cit):
Development of investigation techniques for the study of dam foundations and construction materials, and laboratory techniques to identify this materials proprieties. The information obtained with these techniques enable the creation of dam designs based on the foundation characteristics and materials proprieties;
The theoretical knowledge on soil mechanics developed from 1925 onwards was used to improve the dams design preserving it against the potential sources of failure;
Quality control specifications were defined to guarantee that any desired fill characteristics specified in the project were achieved;
Development of monitoring equipment and practises which enable the study of the post-construction structural behaviour, and an increase of knowledge about dam behaviour that was used in the design of future dams.
These innovations associated to a demographic growth and an increasing demand for electric energy production, which started after the end of the Second World War (1939-1945), increased the acceptance of embankment dams and encouraged the development of higher structures and, in some cases, in places that in the past were not adequate for embankment dams, like valleys with steep abutment slopes or deep pervious foundations (Singh & Varshey, 1995). Figure 2.5 represents the number of dams inaugurated per decade during the 20th century, in accordance with the works of the Comissão Internacional das Grandes Barragens (CIGB, 2008). It can be observed that the number of
10 end of the Second World War which, as emphasised above, was an important factor to the evolution of dam construction.
Figure 2.5 - Number of dams inaugurated per each decade of the 20th century (adapted from CIGB, 2008)
Presently, the ICOLD (2014) specifies the existence of 58,266 large dams in their member states; the majority of these dams are earth dams (63%), as demonstrated in the Figure 2.6.
Figure 2.6 - World distribution of each type of dam (ICOLD, 2014)
According to a CIGB (2008), 90% of the world large dams are located in three continents: Asia, North America and Europe, as illustrated in the Figure 2.7. This study also refers that, in 2008, earth dams represent 43.7% of the total; therefore, between 2008 and 2014, the significance of earth dams in the world increased 20%, demonstrating their importance nowadays.
863
546 838 1015
11
Figure 2.7 - Distribution of large dams in the world (adapted from CIGB, 2008)
The dams can be divided in two types: single purpose and multipurpose - Figure 2.8; in both of them, the majority are used for irrigations purposes.
In Portugal, the most ancient archaeological evidences that can be associated to dams are dated from the Roman period. Quintela et al. (1989) published several works about this subject, in which 20 dams from this period were identified.
Jesus (2011) states that, in Portugal, the construction of dams reached a peak during the 50s. According to Pimenta (2008 apud Faustino 2009) in 2007, there were 231 large dams in Portugal from which 66% (153) were earth fill and/or rock fill dams.
Europe 19%
Australia 2%
Asia 39% Africa
5% South America
3% North America
32%
12
2.3. D
AM FAILURES
Despite the important role that dams had in human evolution is always imperative to refer the considerable number of dam failures that occurred throughout human history, since each one of this accidents can be a reminder of the risks associated to dam construction and, also, a highlight of what must be improved and avoided during dam construction. Some historical examples of earth dams failures are listed in Table 2.2
Table 2.2 - Examples of embankment dam failures (adapted from Chanson, 2009)
One of the most studied failures is the case of the Teton dam, located in the Teton River, Idaho, United States. This dam was constructed by the Bureau of Reclamation (USBR) and completed in 1975. The failure occurred on June 5, 1976 during the first filling and one of the causes was internal erosion of the core. This accident killed 14 people and caused damages equivalent to hundreds of millions of dollars (Solava & Delatte, 2003).
Due to the destructive effects of dam failures, several studies on this subject had been developed in the last decades, since that information can be used to prevent new accidents and diminish their negative effects. Xu et al. (2007) released a study that compiles literature information relative to more than 900 dam failures through the world, excluding China. 593 (65.5%) of those failures referred to earth dams. According to Figure 2.9, the majority of the documented failures occurred in the United States (70.1%), followed by India (4.2%) and United Kingdom (3.6%).
Dam Construction date Date of the accident Description of failure Loss of life
Black Brook dam, UK 1797 1799 Collapsed caused by dam settlement and spillway
inadequacy. none South Fork (Jonhstown)
dam, USA 1839 1889
Overtopping and break of earth dam caused by spillway
inadequacy over 2000
Bilberry dam, UK 1843 1852 Failure of earth dam caused by poor construction quality 81
Dale Dyke dam, UK 1863 1863
Earth embankment failure attributed to poor construction work. Surge wave volume ~0.9
Mm3
150
Dolgarrog dams, UK 1910 1925 dams following undermining of the Sequential failure of two earth
upper structure 25
Belci dam, Romania 1962 1991 Dam overtopping and breach (caused by a failure of gate
mechanism) 97
Teton Dam, USA 1976 1976 Dam failure caused by cracks and piping in the embankment near
completion 11 Glashütte dam,
Germany 1953 2002
Earth dam overtopping during a large flood because of inadequate
13
Figure 2.9 - Geographic distribution of dam failures (Xu et al., 2007)
The results from this study were grouped into five categories: reservoir capacity, height of the dam, construction time, age, and dam type. In relation to the reservoir capacity, this study demonstrates that 16.2% (96 cases) of the failures were associated to dams with a reservoir capacity inferior to 1×10⁸ m3; however, dams with a capacity range between 1-10×108 and 10-100×108 m3 represent 10.6% (63) and 10.5% (62) of the reports, respectively.
Dams with a height inferior to 15 m represent 50.8% of the failures; from this information it is comprehensible that, in the past, dam failures generally were associated with smaller dams; however, at least 31.5% (187) of the 593 accidents occurred before 1925. As previously referred, this date can be associated to the first advances in soil mechanics, allowing the use of safer construction methodologies and higher earth dams, which to the date did not exceed 30 m of height. Therefore, the predominance of failures in this range and in the range between 15-30 m, which represents 22.8% of the occurrences, may be associated to the construction techniques and the basic soil mechanics knowledge that existed before that date. The diminution of failures in higher ranges of dam’s height
may also be associated to these developments, since dams with a height superior to 30 m only became common afterwards.
Regarding the construction time, it is possible to identify two periods, 1890-1939 and 1950-1979, representing 32.3% and 21.4%, respectively. The first five year service represent 30.5% of the documented failures. The results regarding the type of dam are not conclusive, since 89.8% of the earth dams are defined as unknown; however, it is possible to denote a predominance of failures in homogenous earth fill dams.
Generally, a dam failure is not a result from a single factor, but rather a combination of factors that may or may not be related; therefore, identifying the failure causes can be difficult. According to Foster et al. (2000, 2002 apud in Wan, et al. 2004), the two most usual types of failures on earth dams are overtopping, internal erosion and piping, which may be associated to inadequate compaction, since
70.1
4.2 3.6 2.2 1.9
18 0 10 20 30 40 50 60 70 80
United States India United Kingdom
14 compaction affects the permeability, shear strength resistance, and deformability of the embankment. The results from the Xu et al. (2007) study support this affirmation, since the most common types of failure are overtopping and quality problems (Figure 2.10) which include:
Piping in dam body; Sliding of dam body; Piping in foundation; Piping around spillway; Quality issues in spillway;
Piping around culvert and other embedded structures; Quality issues in culvert and other embedded structures.
Figure 2.10 - Percentages of causes for earth dam failures (Xu et al. 2007)
Piping problems represent 61.1% of the quality issues, as expressed in Figure 2.11.
In 1983, ICOLD and the National Research Council (NRC, 1983 apud Fell et al., 1992) published two studies referent to this subject. When those results are compared to those obtained by Xu et al. (2007), it is perceptible that 1983 results are similar to those from 2007; however, there are some differences between the studies that should be considered. ICOLD study do not differentiate any type of dam and the NRC encompasses rock dams and earth dams as fill dams. An additional detail that can be observed from this comparison is that the most common type of dam presently still is the earth dam. 11.6 5.2 3 1.3 42.5 36.4 0 5 10 15 20 25 30 35 40 45
Unknown Others Disasters Poor management
Quality problems
15
Figure 2.11 - Percentages of sub-cases of quality problems for earth dam failures (Xu et al. 2007)
2.4. E
ARTH DAMS COMPONENTS
An earth dam system is composed by a set of structural elements, each one with a specific purpose. Therefore the necessity to include a specific element on the dam body must be studied during the design stage. As illustrated in the previous section, the different types of profiles are composed by different elements.
These structural elements can be identified in the figures presented in Table 2.1 the presence of these elements on the dam body and their role are a result of the evolution of embankment dams throughout the course of history. These component are illustrated and described in Figure 2.12 and Table 2.3, respectively.
Figure 2.12 - Earth dam components (Gulhati & Datta 2008)
14.3
6.3
2.8
18.3
58.3
0 10 20 30 40 50 60 70
Unknown Qualtity issues in spillway
Pupping around spillway
Sliding of dam body/foundation
16
Table 2.3- Function of the structural elements represented in the Figure 2.12 (adapted from Gulhati & Datta, 2008)
Code Structural element Function
i Core Composed by fine grained material, controls the seepage through the dam body
ii Shells Composed by coarse grained material, provide stability to the dam
iii Cut-off barrier Prevents under-seepage through a permeable foundation iv Filters Prevent the migration of fine soil particles between zones with this type of material and a zone with coarser material v Drains Intercept the water table to transmit the seepage water
vi Vegetation and rip rap Protects the slopes from erosion vii Toe drainage Carry away seepage water and surface run off
2.5. Construction phases
According to the Department of Transport (1982), embankment construction processes can be divided into three phases: investigation, design and construction (Figure 2.13). Each one of these stages dependents on the results of the previous one. As formerly referred, embankment construction reuses geologic materials from the surrounding environments, so it is logical that the first phase of an embankment project embraces an adequate research of the construction site and surrounding areas, which include:
Bibliographic research; Geophysical exploration;
Mechanical exploration and soil sampling;
Laboratory tests to establish an adequate identification and characterization of the sampled materials.
The information obtained during this stage should be used in the design stage to define project specifications, such as dimension, construction specifications, types of equipment that should be required during the construction and the structural application of the available materials. The construction stage can be initiated when the design is defined; embankment construction includes six fundamental processes, listed below:
Exploitation of the construction materials; Transportation;
17
2.6. C
ONSTRUCTION TECHNIQUES AND QUALITY CONTROL OF FILLS
From Section 2.5, it can be understood that embankment projects are composed by a succession of interconnected processes. Several construction techniques can be used during the construction phase; however, not all of them are suitable for earth dam construction. According to USBR (1987) and Raj (2008) the rolled fill and hydraulic fill techniques are the most adequate for earth dam construction, and these methods can be combined with soil improvement procedures such as selecting, controlling moisture content, mixing, stabilizing using several admixtures, and compacting to improve the soil engineering proprieties. These two construction methods can also be used to classify teh structures as rolled fill and hydraulic fill dams.
The rolled fill and hydraulic fill techniques are described in the following paragraphs.
In the rolled fill construction technic, the majority of the embankment is built in successively mechanically compacted layers and the materials from the borrow areas are transported to the embankment site and placed generally by trucks or scrapers. Afterwards, these materials are spread by motor graders and bulldozers and, if necessary, sprinkled to form lifts that have a previously specified water content. The final step of this process is to thoroughly compact these lifts with the exact rollers that were defined in the construction specifications (op. cit.).
18 USBR (1998) states that this method can be applied to soils with inadequate engineering proprieties that need to be improved to the maximum practical extent through selection, compaction, moisture control, and special processing. This improvement is necessary in structures such as canals and earth embankments to prevent failure or functioning problems (for example: excessive leakage on the foundation) which can result in economic and social losses. The construction specifications for embankment dams generally define a moisture content range and density, and the compaction requirements which include type of roller, thickness of lifts and number of passes (op. cit.). The definition of these parameters should be based in statistical data and empirical knowledge.
Construction specifications for earthfill dams define that the water content should be uniform in the layer extent and often is slightly inferior to the optimum water content determined in laboratory with the Proctor test (op. cit). The inspection of the fill should guarantee:
The material uniformity and the nonexistence of oversized particles;
The compaction equipment is functioning correctly and fulfils the specifications;
The thickness of the layers and number of passes respect the parameters defined in the specifications;
Moisture uniformity.
An extended approach to soil compaction and its control is defined in Chapter 3. In compliance with USBR (1987) , this is the most popular method for earthfill dams construction, and presently hydraulic fills are rarely constructed therefore this dissertation will only consider rolled fill dam in the further sections.
The majority of embankment construction techniques implicate the control of water content; however, in some circumstances, it is necessary to place the material in conditions that involve an excess of water content. In this case, it may be necessary to use a technique designated as hydraulic fill, which involves excavation and transportation of the material using flowing water, which consists in pumping a soil-water suspension (typically around 85% of water) to a previously defined site and allowing it to settle. With an adequate control of the suspension and settling processes it is possible to construct a uniform embankment (USBR, op. cit., and Raj, op. cit.).
21
3. S
OIL COMPACTION
This chapter consists of a literature review on soil compaction and is divided in two main sections: the first one accesses the generalities about soil compaction, as follows:
Soil origins and its effects on their proprieties;
General principles of soil compaction in non-cohesive soils and cohesive soil; Proctor test;
Compaction parameters and equipment; Trial embankments.
The second section consists in a description of the processes associated to control compaction operations performed during an earth dam construction, field tests executed during the control operations to access the control parameters, comparison between the sand cone test (SCT) and the nuclear gauge (NDG), and the most common methods that are used to analyse the results of the quality control operations.
3.1. S
OIL ORIGIN AND PROPRIETIES
In order to comprehend the mechanisms associated to soil compaction it is necessary to understand the soil origin and, consequently, its effect on soil proprieties. The soil definition from an engineering point of view is different from the definition used by a geologist; these are synthetized in Table 3.1
Table 3.1- Soil definitions from the points of view of an engineer and a geologist
Engineer definition
Braja (2007)
“(…) uncemented aggregate
material of mineral grains and decayed organic matter (solid particles) with liquid and gas in the
empty spaces”
Terzaghi & Peck (1996)
“a natural aggregate of minerals grains that can be separated by such gentle mechanical means as
agitation in water”
Geologist definition Selley, (2000 Cesworth, 1992) apud Martini and
“rock debris and humus, which is
decaying organic matter largely of
plant origin”
22 Chemical weathering processes consist in oxidation and dissolution of the rock minerals, the chemical composition from the resultant products may be different from the original rock; for example feldspars weathering will produce clay minerals such as laterite, kaolinite, and bauxite. Chemical weathering is almost entirely dependent on water; therefore, it is commonly associated to warm and humid climates typical from tropical regions (Selley, 2000; Braja, 2007).
The products resultant from the weathering can be transported and subsequently deposited by physical agents, the soils formed by this process are designated as transported soils. The most common transportation agents are gravity, ice, water, and wind, each one of this agents is dependent on the laws of physics. Weathering products can be transported in a fluid such as wind, water or ice (in compliance with Galopim de Carvalho (2003), ice can be considered as a liquid with great viscosity) by suspension, bouncing, rolling, or as a solute (for soluble materials); the first three processes are represented in Figure 3.1.
A) Suspension; B) Bouncing; C) Rolling
Figure 3.1 - Transportation processes of weathered materials (adapted from Selley, 2000)
Deposition occurs when an agent loses its transportation capacity. Hjulström diagram, represented in Figure 3.2, expresses the relation between the transportation capacity and the energy of a flow.
Figure 3.2 - Hjulström diagram, retrieved in 23 September 2014 from http://echo2.epfl.ch/e-drologie/resumes/chapitre5/resume5.html
23 (Selley, 2000). Consequently, deposits resulting from high energy mass movements such as rock falls (which is a type of transport trigged exclusively by gravity) or avalanches can origin deposits composed by particles from different sizes, and deposits formed by low energy agents like wind generally originate deposits with a range of sizes from sand to clay (Selley, 2000; Galopim de Carvalho, 2003; Braja, 2007). The transportation processes and types of deposits that can be originate are defined in Table 3.2.
Table 3.2 - Transportation processes and the types of deposits formed by each process (adapted from Selley, 2000)
Transportation
process Originated deposit
Subaerial
Traction deposits Predominantly cross-beded sands Density deposits Nuées ardentes, etc Suspension deposits Loess
Subaqueous
Traction deposits Predominantly cross-beded sands Density (turbidity) deposits Graded sands, silts and clays
Suspension deposits Nepheloid clays
Mass gravity transport Subaerial Generally unstratified poorly sorted deposits of boulder to clay grade
(diactamictites) Subaqueous
Glacial transport Moraine deposits
If the products resultant from weathering do not suffer transportation, are designated as residual soils. This type of soils are commonly associated to warm and humid climates, since the weathering rate in this climates might be higher comparatively to semiarid or temperate climates. Rahardjoa et al. (2004) states that these soils have a heterogeneous nature and highly variable degree of weathering, their proprieties are dependent on the climatic and topographic conditions, and nature of the bedrock. Weslie (2009) defines the main factors that contribute to the heterogeneity and behaviour of a residual soil as follow:
The inexistence of a sorting process which forms homogeneous deposits, gerenally this process is associated to transportation;
The nature of the soil particles (size, shape, mineralogical composition); The state of the soil particles on the ground.
In summary, the formation of a soil deposit is a result from an interaction between the following conditions:
Composition of the parent rock; Local climate;
Type of weathering;
The existence of transportation, and the type of transportation agent; Depositional environment;
Geological events.
24 mineralogy. The depositional environment and eventual geological events that may occur after the soil deposition mostly control the state of the soil and its fabric. The regional variability of these conditions guarantees that each soil deposit is singular, therefore it is important to establish an adequate description of a soil deposit before using it as a source of material for earth dam construction. A diagram illustrating the soil formation processes and factors affecting the soil behaviour is represented in the Figure 3.3.
Figure 3.3 - Soil formation processes (Weslie, 2009)
3.1.1. S
OIL DESCRIPTION AND CLASSIFICATION25
Figure 3.4 - Soil phases (Budhu, 2011)
Limits (Liquid Limit and Plastic Limit). The Portuguese, European and American standards for each one of those tests are defined in Table 3.3, their results are used as input in soil classification systems.
Table 3.3 - Portuguese, European and American Standards for soil identification
Portuguese standards European standards American
standards Grain size distribution
(sieve and hydrometer analysis)
NP EN-196 (1966) 4:2004/Cor1(2004) ISO/TS 17892- ASTM D422-63 (2007)
Consistency limits NP-143 (1969) ISO/TS 17892-12: 2004/Cor1( 2006) ASTM D4318-10e1(2010)
There are several classification systems, one of the most used by geotechnical engineers is the United Soil Classification Systems (USCS) developed in 1952, and described by the American Society for Testing Materials (ASTM), in the D2487-11 standard. More recently, the European Committee for Normalization (CEN) developed a new system designated European Soil Classification System (ESCS), which is outlined in ISO14688-2 from 2013.
Classification systems can be used to obtain a simplified description from the soil proprieties, this information can be useful in any type of geotechnical engineering project; however should only be used as an indicator of the soil behaviour, since its behaviour cannot be predicted without in situ and laboratory tests (Venkatramaiah, 2006).
3.1.2. V
OLUMETRIC RELATIONS26 The total volume of a soil can be calculated by the Equation 3.1.
𝑉𝑇 = 𝑉𝑠+ 𝑉𝑣= 𝑉𝑠+ 𝑉𝑤+ 𝑉𝑎 (𝑚3) (3.1)
Where:
𝑉𝑇- Total volume of a soil sample (m3);
𝑉𝑠 - Volume of solids (m3);
𝑉𝑣 - Volume of voids, (m3);
𝑉𝑤- Volume of water in the voids, (m3);
𝑉𝑎 - Volume of air in the voids (m3).
The total weight of a soil sample, considering the weight of the air negligible, can be calculated by Equation 3.2.
𝑊 = 𝑊𝑠+ 𝑊𝑤= 𝑚𝑠× 𝑔 + 𝑚𝑤∗ 𝑔 (𝑘𝑁) (3.2)
Where:
𝑊 - Total weight of a soil sample (kN); 𝑊𝑠 - Weight of soil solids (kN);
𝑊𝑤- Weight of water (kN);
𝑚𝑠 - Mass of solid (kg);
𝑚𝑤 - Mass of water (kg);
g - Gravitational acceleration (≅ 9.81) (m/s2)
Volumetric and weight relations can be used to determinate several soil index proprieties, using the equations expressed in Table 3.4.
Table 3.4 - Volume and weight relationships
Volume
relationships Weight relationships
Void ratio (e) 𝑒 = 𝑉𝑣
𝑉𝑠 (3.3)
Water Content (ω) 𝑤 =𝑊𝑊𝑤
𝑠 (𝑘𝑁/𝑚
3) (3.7)
In situ or wet unit weight
(𝛾) 𝛾 =𝑊𝑉 (𝑘𝑁/𝑚3) (3.8)
Porosity (n) 𝑛 =
𝑉𝑣
𝑉𝑠 (3.4)
𝑛 =1 + 𝑒 (3.5)𝑒
Dry unit weight (𝛾𝑑)
𝛾𝑑=𝑊𝑉 (𝑘𝑁/𝑚𝑠 3) (3.9)
𝛾𝑑=1 + 𝑤 (𝑘𝑁/𝑚𝛾 3) (3.10)
Solids unit weight (𝛾𝑠) 𝛾𝑠=𝑊𝑉𝑠
𝑠 (𝑘𝑁/𝑚
3) (3.11)
Water unit weight (𝛾𝑤) 𝛾𝑤=𝑊𝑤
𝑉𝑤 (𝑘𝑁/𝑚
3) (3.12)
Degree of saturation
(S) 𝑆 =
𝑉𝑤
𝑉𝑣 (3.6)
Submerged unit weight
(𝛾′) 𝛾′= 𝛾𝑠𝑎𝑡− 𝛾𝑤 (𝑘𝑁/𝑚3) (3.13)
Specific gravity from the
solid particles (𝐺𝑠) 𝐺𝑠=
𝛾𝑠
27
3.2. S
OIL COMPACTION
-
GENERAL PRINCIPLES
Usually in geotechnical engineering the soils available for construction do not fit the technical requirements for the desired purpose. They may be weak, highly compressible or have a higher permeability than the one intended; in these circumstances, it may seem practical to relocate the construction site. However in some instances, there are other considerations apart from the geotechnical considerations making the relocation of the construction site unmanageable and in this situations it may be necessary to improve the engineering proprieties of the soils using a technique known as soil compaction.
Soil compaction consists in mechanically densifying a soil through the expulsion of the air present in the voids reducing its volume and increasing the dry unit weight. This process will also increase the saturation degree, since the void ratio decreases due to the expulsion of air. The main effects of compaction in the soil engineering proprieties are:
Increases shear strength; Decreases permeability; Reduces compressibility.
This capacity to improve the soil engineering proprieties makes compaction one of the most important and also least expensive procedures that can be used on the construction of fills for different purposes. However, an inappropriate compaction can affect the durability and stability of a structure, and in most severe cases can lead to its failure; for example if during the construction of an earth dams soils were dumped or randomly placed into a fill without any attempt to compact them, the resultant embankment may present problems related to stability and settlements. This type of situation was common before the 1930´s in highway and railway fills causing failures, namely in considerable high embankments.
Holtz & Kovacs (1981) and Venkatramaiah (2006) stated that in the 30´s, Proctor developed the fundaments of compaction, through his research works, defining that compaction is a function of four variables, namely:
Dry density; Water content;
Compactive effort in the field, which can be defined as a combined result from the number of passages and the weight of the roller;
Soil type.