Departamento de Química
PROGRAMA DE PÓS-GRADUAÇÃO EM QUÍMICA
“MÉTODO EXPERIMENTAL/TEÓRICO PARA INTERPRETAÇÃO DE
SEMICONDUTORES INORGÂNICOS”
Amanda Fernandes Gouveia*
Tese apresentada como parte dos
requisitos para obtenção do título de
DOUTORA EM CIÊNCIAS, área de
concentração: QUÍMICA INORGÂNICA.
Orientador:
Elson Longo
*bolsista FAPESP (nº 2013/26671-9)
PUBLICAÇÕES
Publicações Presentes
1. PEREIRA, P. F. S.; GOUVEIA, A. F.; ASSIS, M.; DE OLIVEIRA, R. C.; PINATTI, I.
M.; PENHA, M.; GONÇALVES, R. F.; GRACIA, L.; ANDRÉS, J. & LONGO, E.
“ZnWO
4nanocrystals: synthesis, morphology, photoluminescence and photocatalytic
properties”. Phys. Chem. Chem. Phys.,
20
: 1923, 2018.
2. ANDRÉS, J.; GRACIA, L.; GOUVEIA, A. F.; FERRER, M. M. & LONGO, E.
“Effects of surface stability on the morphological transformation of metals and metal
oxides as investigated by first-principles calculations”. Nanotechnology,
26
: 405703,
2015.
3. GOUVEIA, A. F.; FERRER, M. M.; SAMBRANO, J. R.; ANDRÉS, J. & LONGO, E.
“Modeling the atomic-scale structure, stability, and morphological transformations in
the tetragonal phase of LaVO
4”. Chem. Phys. Lett.,
660
: 87, 2016.
4. MACEDO, N. G.; GOUVEIA, A. F.; ROCA, R. A.; ASSIS, M.; GRACIA, L.;
ANDRÉS, J.; LEITE, E. R. & LONGO, E. “Surfactant-mediated morphology and
photocatalytic activity of
α
-Ag
2WO
4material”. J. Phys. Chem. C, 122 (15): 8667,
2018.
Outras Publicações
5. SANTANNA, M. A.; MENEZES, W. T.; SANTANA, Y. V. B.; FERRER, M. M.;
GOUVEIA, A. F.; FACETO, A. D.; TEREZO, A. J.; OLIVEIRA, A. J. A.; LONGO, E.;
FREITAS, R. G. & PEREIRA, E. C. “The effect of TiO
2nanotube morphological
engineering and ZnS quantum dots on the water splitting reaction: A theoretical and
experimental study”. Int. J. Hydrogen Energy,
43
: 6838, 2018.
6. TRENCH, A. B.; MACHADO, T. R.; GOUVEIA, A. F.; ASSIS, M.; DA TRINDADE,
“Connecting structural, optical, and electronic properties and photocatalytic activity of
Ag
3PO
4:Mo complemented by DFT calculations”. Appl. Catal., B,
238
: 198, 2018.
7. PEREIRA, P. F. S.; SANTOS, C. C.; GOUVEIA, A. F.; FERRER, M. M.; PINATTI,
I. M.; BOTELHO, G.; SAMBRANO, J. R.; ROSA, I. L. V.; ANDRÉS, J. & LONGO, E.
“
α
-Ag
2-2xZn
xWO
4(0
≤
x
≤
0.25) solid solutions: Structure, morphology, and optical
properties”. Inorg. Chem.,
56
: 7360, 2017.
8. ROCA, R. A.; GOUVEIA, A. F.; LEMOS, P. S.; GRACIA, L.; ANDRÉS, J. &
LONGO, E. “Formation of Ag nanoparticles on
β
-Ag
2WO
4through electron beam
irradiation: A synergetic computational and experimental study”. Inorg. Chem.,
55
:
8661, 2016.
9. GOUVEIA, A. F.; SCZANCOSKI, J. C.; FERRER, M. M.; LIMA, A. S.; SANTOS, M.
R. M. C.; LI, M. SIU; SANTOS, R. S.; LONGO, E. & CAVALCANTE, L. S.
“Experimental
and
theoretical
investigations
of
electronic
structure
and
photoluminescence properties of
α
-Ag
2MoO
4microcrystals”. Inorg. Chem.,
53
: 5589,
2014.
10. ASSIS, M.; CORDONCILLO, E.; TORRES-MENDIETA, R.; BELTRAN, H.;
MINGUEZ-VEGA, G.; GOUVEIA, A. F.; LEITE, E. R.; ANDRÉS, J. & LONGO, E.
“Laser-induced formation of bismuth nanoparticles”. Phys. Chem. Chem. Phys.,
Accepted Manuscript, 2018.
11. ANDRÉS, J.; GOUVEIA, A. F.; GRACIA, L.; LONGO, E.; MANZEPPI FACCIN,
G.; DA SILVA, E. Z.; PEREIRA, D. H. & SAN-MIGUEL, M. A. “Formation of Ag
nanoparticles under electron beam irradiation: Atomistic origins from first-principles
calculations”. Int. J. Quantum Chem.,
118
: e25551, 2017.
12. BYZYNSKI, G.; MELO, C.; VOLANTI, D. P.; FERRER, M. M.; GOUVEIA, A. F.;
RIBEIRO, C.; ANDRÉS, J. & LONGO, E. “The interplay between morphology and
13. FERRER, M. M.; GOUVEIA, A. F.; GRACIA, L.; LONGO, E. & ANDRÉS, J. “A
3D platform for the morphology modulation of materials: first principles calculations
on the thermodynamic stability and surface structure of metal oxides: Co
3O
4,
α
-Fe
2O
3, and In
2O
3”. Modell. Simul. Mater. Sci. Eng.,
24
: 025007, 2016.
14. LEMOS, P. S.; ALTOMARE, A.; GOUVEIA, A. F.; NOGUEIRA, I. C.; GRACIA, L.;
LLUSAR, R.; ANDRÉS, J.; LONGO, ELSON & CAVALCANTE, L. S. “Synthesis and
characterization of metastable
β
-Ag
2WO
4: An experimental and theoretical
approach”. Dalton Trans.,
45
: 1185, 2016.
15. FERRER, M. M.; DE SANTANA, Y. V. B.; RAUBACH, C. W.; LA PORTA, F. A.;
GOUVEIA, A. F.; LONGO, E. & SAMBRANO, J. R. “Europium doped zinc sulfide: a
correlation between experimental and theoretical calculations”. J. Mol. Model.,
20
:
2375, 2014.
16. LONGO, V. M.; DE FOGGI, C. C.; FERRER, M. M.; GOUVEIA, A. F.; ANDRÉ, R.
S.; AVANSI, W.; VERGANI, C. E.; MACHADO, A. L.; ANDRÉS, J.; CAVALCANTE, L.
S.; HERNANDES, A. & LONGO, E. “Potentiated electron transference in
α
-Ag
2WO
4“A fé nos mantêm vivos e confiantes na certeza de que o Senhor cuida de nós
AGRADECIMENTOS
Quero agradecer primeiramente a
Deus
, pelo dom da sabedoria e inteligência, pois
sem os quais não seria possível finalizar mais uma etapa da minha vida.
Ao meu orientador,
Prof. Dr. Elson Longo
por ter acreditado no meu trabalho,
auxiliando-me em todos os momentos e, principalmente, por todo conhecimento
transmitido.
Ao Laboratório Interdisciplinar de Eletroquímica & Cerâmica (LIEC) e ao Centro de
Desenvolvimento de Materiais Funcionais (CDMF), em especial:
Andressa
,
Aline
,
Daniela
,
Camila
,
Luma
,
Marcelo
,
Marisa
,
Mateus
,
Paula
,
Renan
e
Thiago
.
Ao
Prof. Dr. Juan Andrés
por ter aceitado ser o meu orientador no período do
doutorado sanduíche e também pelos seus ensinamentos.
A
Profª. Drª. Lourdes Gracia
por estar sempre disponível a esclarecer minhas
dúvidas ao longo do desenvolvimento do projeto.
Ao apoio financeiro concedido pela
FAPESP
(N° do Processo: 2013/26671-9) e
FAPESP/BEPE
(N° do Processo: 2017/07240-8);
Ao apoio financeiro concedido pelo
CNPq
(N° do Processo: 140830/2014-6);
Ao
apoio
financeiro
concedido
pela
CAPES/PDSE
(N°
do
Processo:
99999.002998/2014-9);
Ao Programa de
Pós-Graduação em Química
da UFSCar, por ter me aceitado
como aluna.
A todos da minha
família
que sempre incentivaram e apoiaram meus estudos,
principalmente
meus pais
,
Walter
e
Amália
.
LIST OF TABLES
2.1 – ZnWO
4nanocrystals: synthesis, morphology, photoluminescence and
photocatalytic properties...5
TABLE 1 – Lattice parameters, unit cell volume and statistical parameters of quality
obtained by Rietveld refinement for the ZnWO
4nanoparticles synthesized by MH
method at 140, 150 and 160 ºC for 1 hour...10
TABLE 2 – Atomic coordinates of the ZnWO
4nanoparticles synthesized by MH
method at 140, 150, and 160 ºC for 1 hour...10
TABLE 3 – Optical band gap energy (
E
gap) values to ZnWO
4nanoparticles obtained
by MH method at 140, 150, and 160 ºC for 1 hour...14
2.3 – Modeling the atomic-scale structure, stability, and morphological
transformations in the tetragonal phase of LaVO
4...33
TABLE 1 – Values of
E
suf, number of broken bonds, area, and broken bondingdensity (
D
b) calculated for
t
-LaVO
4...36
2.4 – Surfactant-mediated morphology and photocatalytic activity of
α
-Ag
2WO
4material...40
TABLE 1 – Rietveld refinement results for
α
-Ag
2WO
4crystals synthesized by the CP
method at 90 ºC without (A) and with (B) the presence of anionic surfactant SDS....44
TABLE 2 – Surface Energy Values (
E
surf, eV), Contribution of the Surface Area by the
Total Area (
𝐶
!, %) and the Polyhedron Energy (
E
polyhedron, eV) for Each Morphology of
LIST OF FIGURES
1 – INTRODUCTION...1
FIGURE 1 – Schematic representation of the study of materials...2
2.1 – ZnWO
4nanocrystals: synthesis, morphology, photoluminescence and
photocatalytic properties...5
FIGURE 1 – XRD patterns of the ZnWO
4nanoparticles obtained by the MH method
at: (a) 140, (b) 150, and (c) 160
oC...9
FIGURE 2 – (a) Unit cell of ZnWO
4, and (b) bond distances of the theoretical
calculations and experimental results for the [ZnO
6] and [WO
6] clusters...9
FIGURE 3 – (A) Raman spectra of the ZnWO
4nanocrystals obtained by the MH
method at (a) 140, (b) 150 and (c) 160 °C for 1 h. (B) Comparison between the
relative positions of theoretical and experimental Raman-active modes of ZnWO
4nanocrystals...11
FIGURE 4 – (A) FT-IR spectra of the ZnWO
4nanocrystals obtained by the MH
method at (a) 140, (b) 150 and (c) 160 °C for 1 h. (B). Comparison between the
relative positions of the theoretical and experimental FT-IR modes of the ZnWO
4nanocrystals...11
FIGURE 5 – FE-SEM images of ZnWO
4nanocrystals, obtained by the MH method at
(A and B) 140, (C and D) 150 and (E and F) 160 °C for 1 h...12
FIGURE 6 – TEM images of ZnWO
4nanocrystals obtained by the MH method at 140
°C (A), 150 °C (E) and 160 °C (I, and M) for 1 h; HR-TEM images of ZnWO
4nanocrystals prepared at 140 °C (B and C), 150 °C (F and G) and 160 °C (J, K and
N, O); surface models involved in each morphology of the ZnWO
4nanocrystals, (D)
(100) surface for 140 °C, (H) (111) surface for 150 °C and (L and P) ((011), (010),
respectively) surfaces for 160 °C. Surface energy (
E
surf) in eV...13
FIGURE 7 – Surface representation of the ZnWO
4structure...13
FIGURE 8 – Map of morphologies of ZnWO
4with (010), (110), (011), (001), (111),
(101) and (100) surfaces. Surface energy is expressed in J m
-2...14
FIGURE 9 – (A) Band structure of the ZnWO
4model. (B) Density of states projected
in the ZnWO4 structure...15
FIGURE 10
–
Emission spectra of the ZnWO
4nanocrystals obtained by the MH
FIGURE 11 – (A) UV-vis absorption spectra of the RhB aqueous solution in the
presence of ZnWO
4nanocrystals, obtained by the MH method at 140, 150 and 160
°C for 1 h and in the presence of pure RhB. (B) Relative concentration of RhB dye
(C/C
0)
versus
time (min) of ZnWO
4nanocrystals, prepared at different temperatures.
(C) Reaction kinetics of RhB degradation
−
ln(C
0/C)
versus
time (min) for the ZnWO
4nanocrystals prepared at different temperatures...17
FIGURE 12
–
Percentage of degradation (%) of RhB dye under exposure to UV-vis
radiation, in the presence of ZnWO
4nanocrystals and different scavengers...18
2.2 – Effects of surface stability on the morphological transformation of metals
and metal oxides as investigated by first-principles calculations...21
FIGURE 1 – TEM image of Ag NC formed under electron beam irradiation...25
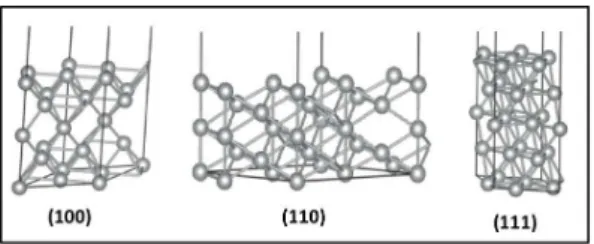
FIGURE 2 – Surface models of (100), (110), and (111) for Ag...25
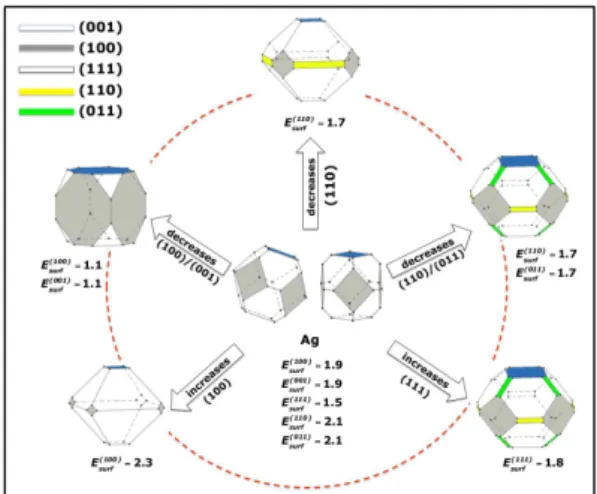
FIGURE 3 – Crystallographic structure and map of morphologies of Ag NC with
(100), (001), (111), (110), and (011) crystal planes. Surface energy is in joule per
square meter. Theoretical (experimental) [102] lattice parameter, a = 4.188 Å (4.086
Å) ...26
FIGURE 4 – Surface models of (001), (101), (100), and (110) for anatase TiO
2. The
red and gray atoms represent O and Ti atoms, respectively...26
FIGURE 5 – Crystallographic structure and map of morphologies of anatase TiO
2with crystal planes (001), (101), (011), (100), (010), and (110). Surface energy is in
joule per square meter. Theoretical (experimental) [120] lattice parameters, a = 3.806
Å (3.78 Å), c = 9.722 Å (9.51 Å) ...27
FIGURE 6 – SEM image of cubic anatase TiO
2particle and its Wulff crystal
representation. Surface energy is in joule per square meter...27
FIGURE 7 – Surface models of (001), (011), and (111) surfaces for BaZrO
3. The Ba,
Zr, and O atoms are shown in yellow, blue, and red, respectively...28
FIGURE 8
–
Crystallographic structure and map of morphologies of BaZrO
3with
(001), (011), and (111) crystal planes. Surface energy is in joule per square meter.
Theoretical (experimental) [130] lattice parameter, a = 4.251 Å (4.18 Å)...28
FIGURE 9
–
SEM image of deca-octahedral BaZrO
3crystals and its Wulff crystal
representation. Surface energy is in joule per
⋅
square meter...28
FIGURE 10
–
Surface models of (010), (100), (001), (110), (101), and (011) for
α
-Ag
2WO
4. The Ag, W, and O atoms appear in grey, blue, and red, respectively...29
FIGURE 11
–
Crystallographic structure and map of morphologies of
α
-Ag
2WO
4with
FIGURE 12 – SEM image of
α
-Ag
2WO
4crystals and its Wulff crystal representation.
Surface energy is in joule per square meter...29
2.3 – Modeling the atomic-scale structure, stability, and morphological
transformations in the tetragonal phase of LaVO
4...33
FIGURE 1
–
Surface models of (110), (100), (111), (001) and (101) for
t
-LaVO
4. The
green, blue and red represent La, V and O atoms, respectively...35
FIGURE 2
–
Ideal morphology (in the center) and map of a few morphologies of
t
-LaVO
4. Surface energy is in Jm
-2...36
FIGURE 3
–
Morphologies of
t
-LaVO
4when the values of
E
surf decrease for (a) the(001) surface; (b) the (111) surface; (c) the (110) surface; (d) the (101) surface and
(e) the (100) surface. Surface energy is in J m
-2...37
2.4 – Surfactant-mediated morphology and photocatalytic activity of
α
-Ag
2WO
4material...40
FIGURE 1 – (A) The crystal structure of orthorhombic
α
-Ag
2WO
4with the space
group
Pn
2
n
and (B) the different clusters of Ag and W atoms that compose the
structure...41
FIGURE 2 – Normalized XRD patterns of the
α
-Ag
2WO
4crystals synthesized by the
CP method at 90 ºC without (black line color) and with (red line color) the presence of
anionic surfactant SDS...44
FIGURE 3
–
Rietveld refinement plots of
α
-Ag
2WO
4crystals synthesized by the CP
method at 90 ºC without (A) and with (B) the presence of anionic surfactant SDS....44
FIGURE 4 – FE-SEM images of
α
-Ag
2WO
4obtained by the CP method: (A) and (B)
α
-Ag
2WO
4-R crystals, and (C) and (D)
α
-Ag
2WO
4-C crystals...44
FIGURE 5 – Average height and width distribution of
α
-Ag
2WO
4-R
crystals (A) and
(B) and
α
-Ag
2WO
4-C crystals (C) and (D) ...45
FIGURE 6 – TEM images for (A)
α
-Ag
2WO
4-R and (B)
α
-Ag
2WO
4-C samples. SAED
analysis for (C)
α
-Ag
2WO
4-R and (D)
α
-Ag
2WO
4-C samples. HR-TEM images: (E)
α
-Ag
2WO
4-R and (G)
α
-Ag
2WO
4-C. EDS local elementary analysis: (F)
α
-Ag
2WO
4-R
and (H)
α
-Ag
2WO
4-C. The inset in (E) and (G) present the calculated interplanar
distance corresponding to cubic Ag metal at the
α
-Ag
2WO
4-R, and
α
-Ag
2WO
4-C
samples, respectively...45
FIGURE 7
–
(A): FT-IR spectra of
α
-Ag
2WO
4microcrystals prepared by the CP
method at 90 ºC without (black line color) and with (red line color) the presence of
SDS. The vertical dashed lines indicate the position of the IR peaks and IR-active
modes. (B): Raman spectroscopy of
α
-Ag
2WO
4microcrystals prepared by the CP
SDS. The vertical dashed lines indicate the position of the Raman peaks and active
modes...46
FIGURE 8
–
UV-vis spectra of
α
-Ag
2WO
4-R (black line color) and
α
-Ag
2WO
4-C (red
line color)...46
FIGURE 9
–
PL spectra of
α
-Ag
2WO
4-R (black line color) and
α
-Ag
2WO
4-C (red line
color)...47
FIGURE 10
–
Under-coordinated Ag and W clusters at the (010), (001), (100), (101),
(110) and (011) surfaces of the
α
-Ag
2WO
4...48
FIGURE 11
–
Schematic representation of the energy profile to obtain the (A)
α
-Ag
2WO
4-R and (B)
α
-Ag
2WO
4-C
morphologies. The intermediate morphologies are
indicated as A, B, C, D, E, F and G, obtained by decreasing/increasing the
E
surfvalues involved in the process. Experimental FE-SEM images of
α
-Ag
2WO
4-R and
α
-Ag
2WO
4-C
morphologies of the studied samples are included for comparison...50
FIGURE 12
–
Evolution of UV-vis absorption spectra after 120 min of illumination for
the degradation of Rh(B) by the (A)
α
-Ag
2WO
4-R and (B)
α
-Ag
2WO
4-C
crystals. (C)
Photocatalysis degradation profiles of RhB with
α
-Ag
2WO
4crystals. (D) First-order
LIST OF SCHEME
2.1 – ZnWO
4nanocrystals: synthesis, morphology, photoluminescence and
photocatalytic properties...5
SCHEME 1 – Formation of oxygen vacancy from clusters interactions...16
SHEME 2 – Proposed mechanism of photodegradation of RhB dye in CCO, CO
2and
RESUMO
MÉTODO
EXPERIMENTAL/TEÓRICO
PARA
INTERPRETAÇÃO
DE
SEMICONDUTORES
INORGÂNICOS.
Sabe-se
que
a
morfologia,
a
dimensionalidade e a estrutura cristalina dos materiais desempenham papéis
importantes nas propriedades eletrônicas, ópticas, catalíticas, dentre outras.
Compreender o papel dessas superfícies e encontrar a sua relação com sua física e
química são de extrema importância. Os cálculos teóricos das superfícies fornecem
um conhecimento profundo sobre os tipos de defeitos superficiais, isto é, vacâncias
de oxigênio e distorções locais, e como elas estão ligadas com as propriedades dos
semicondutores, tais como diminuição do valor do
band gap
, melhora da fotocatálise
dentre outras. Um dos objetivos deste projeto foi associar os resultados
experimentais e teóricos, a fim de proporcionar uma melhor compreensão das
estruturas e propriedades eletrônicas de ambos nanocristais de tungstato de zinco
(ZnWO
4) e dos cristais de tungstato de prata (
α
-Ag
2WO
4) como semicondutores
inorgânicos representativos. Por meio dos cálculos de primeiro princípios, baseados
na construção de Wulff, foi possível prever a morfologia desses materiais e, em
particular explicar como ocorre o processo fotocatalítico dos nanocristais de ZnWO
4,
assim como o efeito da utilização de surfactante na síntese e na atividade
fotocatalítica dos cristais de
α
-Ag
2WO
4.
ABSTRACT
EXPERIMENTAL/THEORETICAL METHOD FOR INTERPRETING INORGANIC
SEMICONDUCTORS. It is known that the morphology, dimensionality and crystalline
structure of materials play important roles in electronic, optical, catalytic properties,
among others. Understanding the role of these surfaces and find a relationship with
their physical and chemical are of extreme importance. The theoretical calculations of
the surfaces provide a deep knowledge about the kind of superficial defect, i.e.
oxygen vacancies and local distortions, and how they are linked with the
semiconductor properties, such as decrease of the band gap value, improve in the
photocatalysis among others. One of the objectives of this project was to associate
experimental and theoretical results in order to provide a better understanding of the
structural and electronic properties of both zinc tungstate (ZnWO
4) nanocrystals and
silver tungstate (
α
-Ag
2WO
4) crystals, as representative inorganic semiconductors. By
means of the first-principle calculations, based on the Wulff construction, it was
possible to predict the morphology of these materials and, in particular, explaining
how the photocatalytic process of the ZnWO
4nanocrystals occurs, as well as the
effect of the surfactant on the photocatalytic activity of the as-synthetized
α
-Ag
2WO
4.
SUMÁRIO
1 – INTRODUCTION ... 1
2 – PUBLISHED ARTICLES ... 4
2.1 – ZnWO
4nanocrystals: synthesis, morphology, photoluminescence and
photocatalytic properties ... 5
2.2 – Effects of surface stability on the morphological transformation of metals and
metal oxides as investigated by first-principles calculations ... 21
2.3 – Modeling the atomic-scale structure, stability, and morphological
transformations in the tetragonal phase of LaVO
4... 33
2.4 – Surfactant-mediated morphology and photocatalytic activity of
α
-Ag
2WO
4material ... 40
3 – CONCLUSIONS ... 54
1 – INTRODUCTION
The word “material” includes the kinds of substances, pure or mixed,
that are used to construct a device with a desirable property.
1,2The importance of the
materials in human life is so significant that different periods of civilization have been
defined according to the material used at the moment, for example: the age of stone,
bronze, and iron.
1In this context, the society always aims to improve the properties
of the materials in order to develop new technological devices, generating
breakthroughs in all areas of the industry and technology.
3A good example of the
synergy between scientific discovery and technological development, according to
Cushing and co-authors,
3is the electronics industry, where it has led to the
development of ever smaller electronic devices with higher capacities and processing
speeds.
A class of material that has great interest is the inorganic
semiconductors that are defined as inorganic solids capable of changing their
conductivity, passing from an insulator to a conductor. This increase in the electrical
conductivity is directly related to the presence of a forbidden region separating the
valence band (VB) and the conduction band (CB), called band gap region. As a
result, when some energy is supplied to the solid, electrons are excited from the VB
to the CB gaining some mobility in the system. The strong point of the inorganic
semiconductors is the fact that electrical conductivity can be altered by external and
internal stimuli,
4which encourages many research groups to study these materials.
5-8In the field of materials research it is very common find papers in which
the experimental and theoretical works are combined. These two lines of research,
when applied together, provoke a favorable synergism, being a powerful tool to study
and to explain the structural and electronic properties of the materials, responsible of
the subsequent technological applications. Therefore, there are two research fronts:
(1) the experimental line in which the aim is the development of new syntheses
methodology to find a material with desirable properties and (2) the theoretical line in
which the first-principles calculations complement experimental results, being a
fundamental guide to a rational design of innovative materials.
Figure 1 illustrates a schematic representation of the study of the
materials. Depending on the syntheses applied and the materials in question, the as-
the structural parameters obtained by the experimental results, it is possible to
construct the adequate theoretical model and by means of first-principles calculations
find the nature of the mechanism to explain the materials properties in order to apply
in certain applications.
FIGURE 1 – Schematic representation of the study of materials.
The control of crystal morphology is a complex and difficult process,
which depends both on the crystal internal structures process and external factors.
There are important factors involved in a synthesis process that affect the final
morphology of the end product, including the precursor, solvent, temperature, organic
and inorganic additives, reducing agent, ligand agent, capping agent, and so on.
It is known that the morphology, dimensionality and crystalline structure
of materials play important roles in electronic, optical, catalytic properties, among
others.
9,10Understanding the role of theses surfaces and find a relationship with their
physical and chemical are of extreme importance. The crystal morphology is
composed of different exposed surfaces in which the metal clusters (the local
coordination of the metal), as the constituent building blocks of the materials, present
under-coordinated positions. From the surface energy calculations it is possible to
obtain the crystals shape applying the Wulff construction.
11,12This simple method
offers a methodology to determine the equilibrium crystal shape, i.e. the morphology.
By a proper adjustment of the ratio of the values for the surface energy of different
surfaces it was possible to find a given morphology and to construct a map of
The inorganic semiconductors investigated by an experimental and
theoretical approach in this thesis were the ZnWO
4and the
α
-Ag
2WO
4. In the case of
ZnWO
4nanocrystals study, the principal aim it was to find the effect of the
temperature on their morphology, photoluminescence properties and photocatalytic
activity and to investigate the role of the each surface. In the
α
-Ag
2WO
4study, the
morphology was manipulated by a simple controlled-precipitation method with and
without the presence of the anionic surfactant sodium dodecyl sulfate along with the
synthesis method and an energy profile was built from the polyhedron energy
associating the surface energy and the Wulff construction.
The focus of this thesis was the achievement of an interdisciplinary
research, from fundamental to applications, in inorganic semiconductors with
different sizes. In some results were used the theoretical and experimental approach
to better discuss the materials properties and demonstrated how the methods and
techniques of the theoretical and computational chemistry can be used for an
understanding of physical and chemical properties of semiconductors for searching a
2 – PUBLISHED ARTICLES
The published articles that compose this doctoral thesis with the
2.1
–
ZnWO
4nanocrystals:
synthesis,
morphology,
ZnWO
4nanocrystals:
Synthesis,
morphology,
and
photoluminescence
and
photocatalytic properties
P. F. S. Pereira,a A. F. Gouveia,a M. Assis,a R. C. de Oliveira,a I. M. Pinatti,a M. Penha,a R. F. Gonçalves,b L.
Gracia,c J. Andrésd,* and E. Longoa a
CDMF, LIEC, Chemistry Department of the Federal University of São Carlos (UFSCar), P.O. Box 676, 13565-905 São Carlos, SP, Brazil. b
Federal University of São Paulo (UNIFESP), 09972-270 Diadema, SP, Brazil c
Department of Physical Chemistry, University of Valencia (UV), Burjassot 46100, Spain. d
Department of Analytical and Physical Chemistry, University Jaume I (UJI), Castelló 12071, Spain.
The present joint experimental and theoretical work provides in-depth understanding on the morphology, structural, electronic, and optical properties of ZnWO4 nanocrystals. Monoclinic ZnWO4 nanocrystals were prepared at three different
temperatures (140, 150, and 160 °C) by a microwave hydrothermal method. Then, the samples were investigated by X-ray diffraction with Rietveld refinement analysis, field-emission scanning electron microscopy, transmission electronic microscopy, micro-Raman and Fourier transform infrared spectroscopy, ultraviolet-visible spectroscopy, and photoluminescence measurements. First-principles theoretical calculations within the framework of the density functional theory were employed to provide information at the atomic level. The band structure diagram, density of states, Raman and infrared spectra were calculated to understand the effect of structural order–disorder on the properties of ZnWO4. The effects of the synthesis
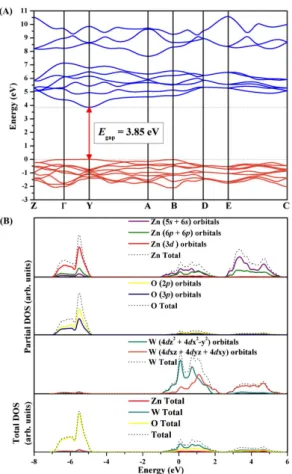
temperature on the above properties were rationalized. The band structure revealed direct allowed transitions between the VB and CB and the experimental results in the ultraviolet-visible were consistent with the theoretical results. Moreover, the surface calculations allowed the association of the surface energy stabilization with the temperature used in the synthesis of the ZnWO4
nanocrystals. The photoluminescence properties of the ZnWO4 nanocrystals prepared at 140, 150, and 160 °C were attributed
to oxygen vacancies in the [WO6] and [ZnO6] clusters, causing a red shift of the spectra. The ZnWO4 nanocrystals obtained at
160 °C exhibited excellent photodegradation of Rhodamine under ultraviolet light irradiation, which was found to be related to the surface energy and the types of clusters formed on the surface of the catalyst.
Introduction
Water pollution by industrial effluents is a major source of concern for environmentalists worldwide.1 The agriculture and textile industries are among the largest polluters of water globally. About 10000 tons of synthetic dyes are produced per year.2 Inevitably, losses exist during dye manufacturing and processing operations, accounting for approximately 12% of the dye production. The effluents from these operations are usually highly colored, toxic, carcinogenic, or mutagenic waste. The color of dyes makes the effluents aesthetically unpleasant, and the dyes may also undergo degradation to form byproducts that are carcinogenic and toxic. Moreover, they also reduce the photosynthetic activity of water streams and disturb the aquatic equilibrium.3, 4
Many of these chemicals released by different industries cannot be removed by filtration or other simple processes. Owing to the complexity of their structure and their low biodegradability, the removal of these dyes from water poses a challenging problem.5–7 The removal of such materials to safe levels through green routes and within reasonable costs is a current interest in pollutant management.8–13 All these considerations have drawn attention towards the crucial need for nanomaterials for environmental remediation owing to their ability to induce photocatalytic oxidation (complete mineralization) of pollutants over their surface under UV/visible/solar light irradiation.14–19 Nanomaterials are very promising materials as they possess high surface area, sorption
sites, short intraparticle diffusion distances, and interesting surface chemistry; hence, they readily
adsorb dye molecules.20–22 Consequently, the
development of semiconductor nanostructures as photocatalysts for sunlight utilization is increasingly becoming an important research topic owing to the current global energy shortage. Solar energy conversion through photocatalysis needs to maximize the utilization of visible light; dye-sensitized semiconductors have been widely studied for this purpose.23–26
ZnWO4 is characterized by its high light yield, average refractive index, as well as X-ray absorption coefficient and short decay time, and it is considered a promising material for photocatalysts for organic pollution degradation.27–29 In this context, vast research efforts have been dedicated in the last few years to the synthesis of ZnWO4 nanostructures as promising visible light photocatalysts for organic pollutant degradation due to their high photosensitivity, excellent chemical stability, non-toxicity, several unique characteristics,27, 28 and their potential applications in optical fibers, scintillation materials, luminescence devices, solid-state laser hosts, optical and acoustic fibers, humidity and gas sensors,28, 30–37 electronic devices, anode materials for lithium-ion batteries,38 stimulated Raman scattering (SRS),39 and heavy material treatments through electro-assisted photocatalytic systems.40
solid-state reactions, co-precipitation, mechanochemical, the Czochralski technique, ultrasonic irradiation,
self-propagating combustion, sol–gel, hydrothermal
microwave-assisted methods,28, 31, 42–62
electrosynthesis,29 and solvothermal synthesis.38 However, comprehensive understanding of how different synthetic methods can affect the morphology, photoluminescence properties, as well as the photocatalytic activity (PCA) of the final materials has been rarely discussed in the literature. In this work,
ZnWO4 nanocrystals were synthesized by a
hydrothermal microwave-assisted method as a fast, simple, and efficient method to prepare nanosized inorganic materials.63–65 Microwave irradiation has been widely applied for the rapid synthesis of inorganic solids. Since this type of radiation affords internal heating of the material, lower temperatures and shorter times can be used compared to those applying conventional heating.66–68 Microwave heating is an inexpensive, facile, and relatively fast method for the preparation of nanocrystalline samples with unique or enhanced properties.
Inspired by the above considerations, in this paper we report the synthesis of ZnWO4 nanocrystals via a microwave hydrothermal (MH) method at three different temperatures (140, 150, and 160 °C). Our principal aim was to understand the fine effects of the synthesis temperature on the morphology and photoluminescence properties of the as-synthesized ZnWO4 nanocrystals and to investigate the role of the electronic structure on their photocatalytic activity. Herein, we clarify these points by performing a detailed theoretical and experimental study on the PCA of ZnWO4 nanocrystals. The evaluation was carried out by decomposing rhodamine B (RhB) under visible
irradiation. The synthesized materials were
characterized by X-ray diffraction (XRD) with Rietveld
refinement, field-emission scanning electron
microscopy (FE-SEM), transmission electronic
microscopy (TEM and HR-TEM), and micro-Raman
(MR) and Fourier transform infrared (FT-IR)
spectroscopy. Moreover, their optical properties were investigated by ultraviolet-visible (UV-vis) spectroscopy and photoluminescence (PL) measurements at room temperature. First-principles theoretical calculations within the framework of the density functional theory (DFT) were employed to obtain information at the atomic level. The band structure diagram, density of states (DOS), and Raman and Infrared spectra were calculated to understand the effects of structural order-disorder on the properties of ZnWO4.
Experimental and Theoretical Methods
Synthesis of ZnWO4 nanocrystals. The ZnWO4 nanocrystals were prepared by the MH method at 140, 150 and 160 oC for 1 hour. The corresponding procedure is described below: 2 x 10⁻³ mol of tungstate (VI) sodium dihydradrate (Na2WO4.2H2O; 99.5% purity, Sigma-Aldrich) and 2 x 10⁻³ mol of zinc nitrate (Zn(NO3)2; 99.9% purity, Sigma-Aldrich) were dissolved separately in 50 mL of deionised water at room temperature in beaker under magnetic stirring. The solution with 𝑍𝑛!! and 𝑁𝑂
!! was added to the
glass beaker of solution containing the 𝑊𝑂
!!! ions and this solution remained at room temperature under magnetic stirring for some minutes until complete precipitation. Thus, a white suspension appeared and 100 mL of these solutions were inverted into a Teflon autoclave vessel without magnetic stirring. This suspension was processed at 140, 150 and 160 oC for 1 hour. The resulting suspensions were washed several times with deionized water to remove the residual 𝑁𝑎! ions. The crystalline ZnWO
4 nanocrystals were collected and dried in an oven at 70 oC for some hours. Previously, Tan and co-workers59 investigated the formation of ZnWO4 phase by microwave-assisted hydrothermal synthesis and only obtained the pure phase at 220 °C for 1 h. In the present study, we also obtain pure phase at lower temperatures.
Characterization. The ZnWO4 nanocrystals were structurally characterized by XRD patterns using a D/Max-2000PC diffractometer Rigaku (Japan) with Cu
Ka radiation (λ = 1.5406 Å) in the 2θ range from 10° to 70° in the normal routine with a scanning velocity of 2°/min and from 10° to 110° with a scanning velocity of 1°/min in the Rietveld routine. MR spectroscopy was
conducted on a Horiba Jobin-Yvon (Japan)
diffuse-reflectance mode. PL measurements were performed through a Monospec 27 monochromator (Thermal Jarrel Ash) coupled to a R446 photomultiplier (Hamamatsu Photonics, Japan). A krypton-ion laser (Coherent Innova 90K; λ = 350.7 nm) was used as the excitation source; its maximum output power was maintained at 500 mW. The laser beam was passed through an optical chopper, and its maximum power on the sample was maintained at 40 mW. PL measurements were performed at room temperature.
Photocatalytic tests of ZnWO4. Photocatalytic
activities (PCA) of the prepared ZnWO4 nanocrystals were evaluated by photocatalytic degradation of 100 mL of the Rhodamine B (RhB) in aqueous solution under UV light. In a typical process, 50 mg ZnWO4 nanocrystals synthesized by MH method at 140, 150 and 160 oC for 1 hour were dispersed in 50 mL of the RhB solution (1 x 10⁻⁵ mol). The above mixture was transferred into a 100 mL Pyrex glass bottle and stirred for 30 min to make the catalyst blend evenly in the solution. The suspensions were irradiated by six lamps (PHILIPS TL-D, 15 W). After the reaction, the mixture was centrifuged at 13.000 rpm for 10 min to completely remove the catalyst particles. The remaining solution was analyzed with by UV-Vis absorption spectroscopy on a V-660 spectrophotometer (JASCO). Variations in the absorption band (maximum λ = 554 nm) were monitored.
Computational Method. Theoretical calculations for ZnWO4 were performed using DFT as implemented in the VASP program.69, 70 The Kohn-Sham equations were solved using the functional proposed by Perdew, Purke, and Ernzerhof (PBE),71 and the electron-ion interaction was described using projector augmented
wave pseudopotentials.69, 72 The plane-wave
expansion was truncated at a cutoff energy of 460 eV, and the Brillouin zones were sampled through 6 × 6 × 1 Monkhorst−Pack special k-points grids that ensure geometrical and energetic convergence for the ZnWO4 structure. A vacuum spacing of 15 Å was introduced in the z-direction such that the surfaces did not interact with each other. Each surface was modeled using stoichiometric systems. The surface energy (Esurf) was defined as:
𝐸!"#$=!!"#$!!!!"#$
!! (1)
where Eslab is the total energy per repeating cell of the slab, Ebulk is the total energy of the perfect crystal per molecular unit, n is the number of molecular units of the surface, and A is the surface area per repeating cell of the 2 sides of the slab. The procedure to obtain the complete set of morphologies, based on the Wulff
construction and the surface energy, has been previously presented by Andrés et al.73
The screened hybrid functional HSE06 was used in order to obtain the band structure diagram, the density of states (DOS) as well as Raman/IR vibrational modes using numerical second derivatives of the total energies.
Results and discussion
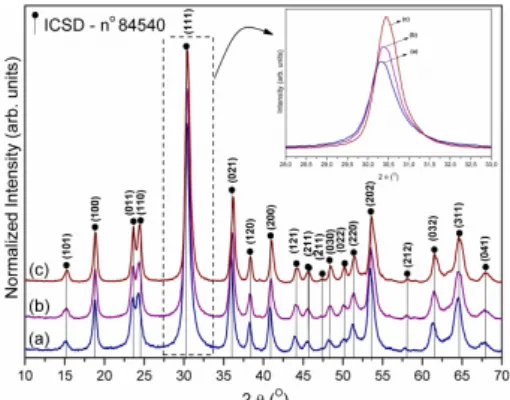
XRD analysis. The XRD technique allows ascertaining the degree of structural order–disorder at long-range distances or the periodicity of ZnWO4 nanocrystals. Fig. 1 (a–c) shows the influence of the
reaction temperature on ZnWO4 nanocrystals
synthesized at 140, 150, and 160 °C for 1 h via an MH method. Fig. 1 (a–c) shows that the diffraction peaks for all ZnWO4 nanocrystals can be successfully indexed to the pure monoclinic sanmartinite phase74, 75 with a wolframite structure and a space group of P2/c41, 46, 74–76 with 𝐶!"! symmetry52, 77 and two
molecules per unit cell (Z = 2).
These crystals present sharp and well-defined diffraction peaks, indicating a good degree of structural order at long-range distances.61, 78–82 The strong diffraction peaks for the (111) plane observed in Fig. 1 (a–c) suggest that all the prepared ZnWO4 samples are highly crystalline.74 All diffraction peaks are consistent with the Inorganic Crystal Structure Database (ICSD) pattern No. 84540.83 As can be observed from Fig. 1, the intensity of the diffraction peaks increased with the increasing temperature, from 140 to 160 °C during the MH procedure. This behavior confirms structural organization at long distances and indicates the high crystallinity of the materials. In addition, the diffraction peaks were slightly shifted to higher 2θ values with the increasing synthesis temperature, consequently resulting in smaller interplanar distances and causing a slight reduction of the unit cell volume.
The average crystallite size was estimated by Scherrer’s equation using the full width at half maximum (FWHM) of the most intense peak of the (111) plane. As reported in the literature,74 Scherrer’s equation (Equation (2)) is described as follows:
𝐷=!"#$%!.!! (2)
FIGURE 1 – XRD of the ZnWO4 nanoparticles obtained by the MH method at: (a) 140, (b) 150, and (c) 160 °C.
Rietveld refinement analysis. Fig. ESI-1 (Electronic Supplementary Information) shows the Rietveld refinement plot for the ZnWO4 nanocrystals prepared by the MH method at 140, 150, and 160 °C for 1 h.
Structural analysis via Rietveld refinement85 was employed to confirm the wolframite structure of the ZnWO4 nanocrystals. Such a structural refinement was performed using the general structure analysis (GSAS) program.86 The calculated patterns were adjusted to fit the observed patterns and thus provide the structural parameters of the material and the diffraction profile. As such, the experimental lattice parameters, unit cell
volume, and atomic positions of the ZnWO4
nanocrystals were calculated using the Rietveld refinement method. The refined parameters were discussed in a previous work.87
The analysis of Fig. ESI-1 (a–c) shows good agreement between the observed XRD patterns and the theoretical fit, indicating the successful application of the Rietveld refinement method. Therefore, all the structural refinement results obtained using this method85 were consistent with the ICSD Nº 84540 pattern, confirming the presence of a single phase in all the ZnWO4 nanocrystals corresponding to a wolframite structure with a symmetry space group P2/c and two molecules per unit cell (Z = 2). These results confirmed the effectiveness of our synthetic method.
The success of the Rietveld refinement method was verified by the small differences (nearly zero) in the intensity scale, as illustrated by the line YObs - YCalc. The experimental and calculated data from the DFT and Rietveld refinement methods are summarized in Table 1, including the lattice parameters, cell volume, and statistical parameters (RBragg, χ2, Rwp, and Rp). The statistical R-values presented in this table suggest that the refinement results are reliable.
From the results reported in Table 1, it is possible to verify slight variations in the lattice parameters and
cell volume values (all consistent with the ICSD card Nº 84540). These results indicate that the octahedral [ZnO6] and [WO6] clusters (the building blocks of the structure) are distorted, thus generating structural defects in the ZnWO4 lattice.
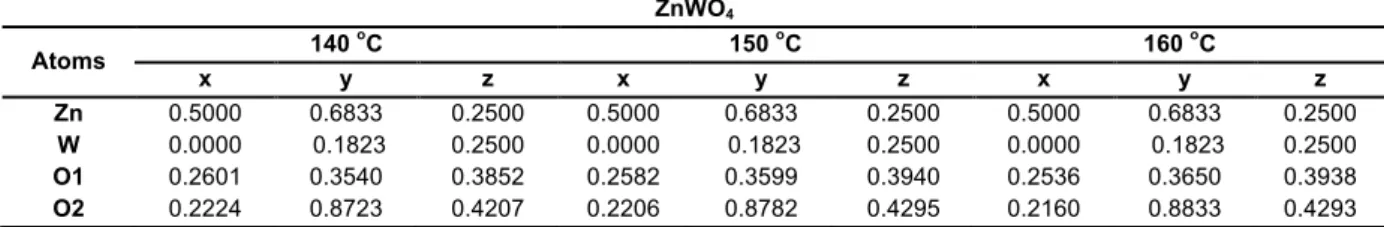
Table 2 shows the atomic coordinates for the Zn, W, and O atoms obtained from the Rietveld refinement. Upon analyzing these data, it is possible to note a considerable variation in the atomic positions of the oxygen atoms, as these atoms do not occupy fixed positions in such a structure, while the Zn and W cations practically maintain their positions fixed throughout the structure. Fig. 2 illustrates the unit cell of ZnWO4 prepared by the MH method at 160 °C for 1 h with a P2/c space group and 𝐶!"! point-group
symmetry,88, 89 and also the experimental and calculated clusters present in the ZnWO4 wolframite, modeled using the Visualization for Electronic and Structural Analysis (VESTA) program.90
FIGURE 2 – (a) Unit cell of ZnWO4, and (b) bond distances of
theoretical calculations and experimental results for the [ZnO6] and
[WO6] clusters.
The structural parameters and atomic coordinates obtained from the Rietveld refinement were employed to model the unit cell of ZnWO4, whose values are listed in Tables 1 and 2.
Analysis of the results reported in Tables 1 and 2 confirmed that the ZnWO4 lattice is composed of Zn and W cations coordinated with six oxygen atoms forming distorted [ZnO6] and [WO6] clusters (6 vertices and faces, respectively, and 12 edges) in an octahedral configuration. These results are consistent with those reported in the literature.88, 89, 91 Therefore, both crystals have clusters of the symmetry group Oh
Micro-Raman spectroscopy analysis. Fig. 3
(a) displays the MR spectra of ZnWO4
nanocrystals synthesized by the MH method at 140, 150, and 160 °C for 1 h. A comparison of the experimental and calculated Raman vibrational modes of ZnWO4 nanocrystals is presented in Fig. 3 (b), and their values are listed in Table ESI-1 in comparison with relevant data from the literature.94, 95
As shown in Table ESI-1, both experimental and theoretical results are in good agreement with the results found in the literature. The slight variations in the positions of the typical vibrational modes of our samples relative to those reported in the literature can be attributed to the different syntheses, crystal sizes, distortions on the bonds and angles of the [O–Zn– O]/[O–W–O] moieties at short-range distances, and/or intermolecular forces between the [ZnO6]–[WO6] clusters.89
The ZnWO4 nanocrystals present a wolframite structure within the monoclinic space group P2/c96 and 36 lattice modes in accordance with group theory calculations; however, only 18 vibrational modes (8Ag + 10Bg) are Raman active.97 These vibrational modes are classified in two types: internal and external modes. The internal vibrational modes are assigned to distorted octahedral [WO6] clusters, while the external vibrational modes are associated with the distorted octahedral [ZnO6] clusters in the lattice.89, 98
The phonon frequencies of the internal vibration modes associated with the W–O bonds of [WO6] are higher than those of the external modes associated with Zn–O bonds. This occurs because the internal covalent bonding in the [WO6] octahedrons is stronger than the external lattice binding in [ZnO6].98, 99 In general, internal vibrations are expected to occur at higher wavenumbers than external vibrations;99 this behavior arises from the strong covalent nature of the W–O bonds.
TABLE 1 – Lattice parameters, unit cell volume and statistical parameters of quality obtained by Rietveld refinement for the ZnWO4 nanoparticles
synthesized by MH method at 140, 150 and 160 oC for 1 hour.
TABLE 2 – Atomic coordinates of the ZnWO4 nanoparticles synthesized by MH method at 140, 150, and 160 °C for 1 hour.
ZnWO4
Atoms 140
o
C 150 oC 160 oC
x y z x y z x y z
Zn 0.5000 0.6833 0.2500 0.5000 0.6833 0.2500 0.5000 0.6833 0.2500
W 0.0000 0.1823 0.2500 0.0000 0.1823 0.2500 0.0000 0.1823 0.2500
O1 0.2601 0.3540 0.3852 0.2582 0.3599 0.3940 0.2536 0.3650 0.3938
O2 0.2224 0.8723 0.4207 0.2206 0.8782 0.4295 0.2160 0.8833 0.4293
Analysis of Fig. 3 (a) revealed the presence of 18 well-defined Raman active vibrational modes between 50 and 1000 cm-1. Higher symmetric and anti-symmetric stretching modes are associated with internal vibrations inside the [WO6] clusters, showing several peaks corresponding to Raman-active internal Ag and Bg modes with their vibrations composed of six internal modes (four Ag and two Bg).89, 99
The main mode (Ag) is associated to the intense peak located at around 903.3 cm-1 ascribed to the symmetric stretching of (←O←W→O→), see inset in Fig. 3 (a). The Raman Bg and Ag modes at 781.6 and 705.2 cm-1, respectively, are assigned to asymmetric stretching of (→O→W→O→), see inset in Fig. 3 (a).89, 99
The Raman Ag and Bg modes at 672.9 (Bg), 543.8
(Ag), 513.0 (Bg), and 403.5 (Ag) cm-1 are attributed to stretching modes of the long W–O bonds. The Raman modes of low intensity at around 120.1 (Ag), 145.7 (Bg), 161.5 (Bg), 188.5 (Bg), and 194.1 (Ag) are assigned to the symmetric stretch of (←O←Zn→O→) bonds, while the modes at 309.9 (Bg), 269.9 (Ag), and 277.3 (Ag) are attributed to the vibrations of cationic sublattices (see inset in Fig. 3 (a)).76, 89, 99–101 Therefore, all the vibration modes presented in Fig. 3 (a) are intense and well-defined, suggesting that the ZnWO4 nanocrystals are structurally ordered in the short range and correspond to a wolframite-type monoclinic structure.
Table ESI-2 shows the FWHM, and the Raman
peak position and intensity for the ZnWO4
ZnWO4
Lattice Parameters Cell volume (Å3)
RBrag
g (%)
χ2 (%) Rwp (%) Rp (%) a (Å) b (Å) c (Å) β
140 oC
4.6883(7) 5.7600(8) 4.9732(6) 90.498 134.30(1) 1.25 1.79 6.69 5.05
150 oC 4.6868(1) 5.7545(7) 4.9568(3) 90.566 133.68(2) 1.11 1.50 5.61 4.14
160 oC 4.6861(2) 5.7500(5) 4.99495(6) 90.582 133.36(2) 1.30 1.49 5.63 4.12
Theo. 4.6823 5.8076 4.8214 89.979 131.108 - - - -
nanocrystals. The linewidth of the main mode (Ag) for the intense peak located at around 903.3 cm-1 was obtained by assuming a deconvolution of Lorentzian curves. Table ESI-2 illustrates the temperature dependence of the linewidth, showing narrow and more intense peaks and a moderate wavenumber shift is also observed with the increasing temperature. This reveals a temperature dependence of the structural order in the short range. These results corroborate the XRD and Rietveld refinement data.
FIGURE 3 – (A) Raman spectra of the ZnWO4 nanocrystals obtained
by the MH method at (a) 140, (b) 150 and (c) 160 °C for 1 h. (B) Comparative between the relative positions of theoretical and
experimental Raman-active modes of ZnWO4 nanocrystals.
FT-IR spectroscopy analysis. Molybdate and tungstate crystals with a wolframite-type monoclinic structure exhibit 36 different vibrational modes according to group theory calculations. Among these vibrational modes, 18 modes (8Au and 10Bu) are expected to appear in the infrared spectra; however, three modes (1Au and 2Bu) correspond to acoustic vibrations and thus, only 15 modes (7Au and 8Bu) are IR active.76, 89
In this work, IR spectroscopy was used in transmittance mode to characterize the structure in the metal–oxygen bond region. The stretching absorption bands (symmetric, asymmetric, and anti-symmetric) associated with metal–oxygen bonds can be observed between 200 and 1000 cm-1.
Fig. 4 (A and B) shows the normalized FT-IR spectra of the experimental and theoretical infrared modes of the ZnWO4 nanocrystals prepared at 140, 150, and 160 °C, respectively. Fig. 4 (a) displays 10 IR active vibrational modes. The Bu mode at around 256
cm-1 is attributed to the asymmetric stretching of bonds in the [ZnO6]–[ZnO6] clusters. The Au mode at 321 and 368 cm-1 are assigned to the symmetric stretch (O←Zn←O→Zn→O) of distorted octahedral [ZnO6]– [ZnO6] clusters, and the Au mode at around 428 cm-1 is
ascribed to the asymmetric stretch
(O→Zn→O→Zn→O) of the distorted octahedral [ZnO6] clusters.
FIGURE 4 – (A) FT-IR spectra of the ZnWO4 nanocrystals obtained by
the MH method at (a) 140, (b) 150 and (c) 160 °C for 1 h. (B). Comparative between the relative positions of theoretical and
experimental FT-IR modes of ZnWO4 nanocrystals.
The Bu and Au modes at approximately 465 and 529 cm-1 are associated with asymmetric stretching (O←W←O←W←O) of distorted octahedral [WO6]– [WO6] clusters.
The broad absorption band at 600 cm-1
corresponds to a Bu mode attributed to asymmetrical vibrations of the bridging oxygen atoms of the O–W–O groups of distorted octahedral [WO6] clusters (see inset in Fig. 4 (a)).
The absorption band at around 712 cm-1 is assigned to the Au mode and the absorption bands at around 822 and 878 cm-1 are related to Bu and Au modes, respectively, which are assigned to the symmetric stretching (←O←W→O→) of distorted octahedral [WO6] clusters.46, 47, 76, 89, 100, 102 The FT-IR results confirm the formation of ZnWO4 nanocrystals in all the samples.100
FT-IR modes of the experimental and theoretical calculations; however, the theoretical results illustrated more Bu and Au modes at 96, 134, 176, and 231 cm-1, which were not experimentally detected due to the low detection limit of the FT-IR spectrophotometer used. In addition, Table ESI-3 shows that both experimental and theoretical results are in good agreement with the results found in the literature. The same conclusion was reached for the FT-IR and Raman modes, in which a small variation in the positions of FT-IR active modes of ZnWO4 nanocrystals was observed. This behavior is probably due to variations in the bonds lengths and angles of the O–Zn–O, O–W–O, and Zn– O–W moieties.89
FE-SEM, TEM, and HRTEM images and Wulff construction analysis. The detailed morphology of the materials was examined by FE-SEM, TEM, and HR-TEM. As shown in Fig. 5, different morphologies
were obtained upon changing the synthesis
temperature.
Fig. 5 (a–c) shows the FE-SEM images, where the presence of ZnWO4 nanocrystals of agglomerated nature can be discerned in all samples. However, it was not possible to correctly define the shape and size of the nanocrystals. Thus, the TEM technique was used to better define the morphological characteristics of the nanostructures and the surface morphology of the ZnWO4 nanocrystals, as well as to confirm the wolframite monoclinic structure.
Fig. 6 (a, e, i, and m) shows the TEM images of
the ZnWO4 nanocrystals as function of the
temperature. An analysis of these images point out that the temperature has a large effect on the morphology and size of ZnWO4 nanocrystals. At 140 °C, the nanocrystals exhibit undefined morphology (see Fig. 6 (a)). However, deformed polyhedrons were observed when the temperature was increased to 150 °C, revealing the formation of nanorods of rectangular form with different sizes (see Fig. 6 (e)). At 160 °C, ZnWO4 nanocrystals were obtained as fully defined
polyhedral (e.g., nanorods), rectangular, and
hexagonal plates (see Fig. 6 (i), (m)).
The crystalline planes and morphologies are also shown in Fig. 6 (b, c, f, g, j, k, n, and o). These images confirm the high crystallinity of the materials and prove that these nanocrystals have the monoclinic structure of wolframite.
Growth is observed in the (100) direction for the sample processed at 140 °C, in the (111) direction for the sample prepared at 150 °C, and growth of the
sample synthesized at 160 °C occurs in the (011) and (010) faces.
FIGURE 5 – FE-SEM images of ZnWO4 nanocrystals, obtained by the
MH method at (A, B) 140, (C, D) 150 and (E, F) 160 °C for 1 h.
Therefore, it is possible to conclude that these nanocrystals do not present a predominant growth mechanism; however, the increase in the temperature changes the growth process from the (100) and (111) directions to the (010) and (011) ones. Both (010) and (011) surfaces present lower Esurf values than the (100) and (111) surfaces, as demonstrated below by theoretical calculations.
The size distributions are shown in Fig. ESI-2, and analysis of the results indicates that the length and
thickness of the samples increase with the
temperature.
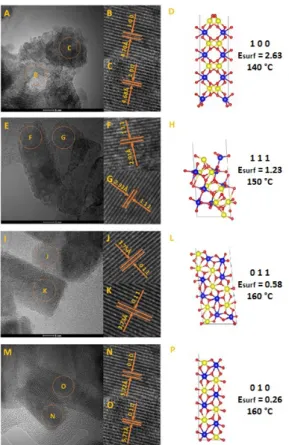
FIGURE 6 – TEM images of ZnWO4 nanocrystals obtained by the MH method at 140 °C (A), 150 °C (E) and 160 °C (I, and M) for 1 h;
HR-TEM images of ZnWO4 nanocrystals prepared at 140 °C (B, C), 150
°C (F, G) and 160 °C (J, K and N, O); Surface models involves in each
morphology of the ZnWO4 nanocrystals, (D) (100) surface for 140 °C,
(H) (111) surface for 150 °C and (L, P) ((011), (010), respectively)
surfaces for 160 °C. Surface energy (Esurf) in eV.
Based on the Esurf values for all the facets and the Wulff construction implemented in the VESTA program,90 it was possible to determine the crystal shape of the ZnWO4 nanocrystals in vacuum. The present equilibrium morphology was derived from the calculated Esurf values under the assumption that the crystal faces with the lowest surface energies control the crystal morphology, as illustrated in Fig. 8.
The ideal morphology of ZnWO4 is depicted in the center of Fig. 8, where a map of the available morphologies of ZnWO4 is also presented. Different crystal morphologies can be achieved by tuning the surface energy values of some facets using the Wulff construction method.73, 105, 106 Based on these results, it is possible to modulate the morphology, which is dependent on the relative values of the surface energy as well as the percentage of the area in the structure.73, 105, 106 Thus, the material properties are linked with the type of clusters in the surface.
In the case of ZnWO4 nanocrystals, it is not possible to associate the FE-SEM images to the Wulff construction. However, we can associate the surface energy stabilization with the temperature. At 140 °C,
the only surface found is the interplanar distal 4.69 Å, corresponding to the (100) plane; at 150 °C, the interplanar distance of 2.93 Å corresponds to the (111) plane; while, at 160 °C, the 5.72 and 3.73 Å distances correspond to the (010) and (011) surfaces, respectively. The surface energy decreases as follows:
𝐸!"#$
(!"")
= 2.63 > 𝐸!"#$
(!!!)
= 1.23 > 𝐸!"#$(!"") = 0.58 > 𝐸!"#$
(!"!)
= 0.26,
as shown in Fig. 8. Thus, the increasing temperature enhances the growth path in the direction of surfaces with lower energy values.
FIGURE 7 – Surface representation of the ZnWO4 structure.
UV-vis absorption spectroscopy analysis. The optical band gap energy (Egap) of the ZnWO4 nanocrystals was calculated by the Wood–Tauc107 method and the Kubelka–Munk108 function. This methodology is based on the transformation of diffuse reflectance measurements to estimate the Egap values with high accuracy within the limits of certain assumptions when modeled in three dimensions. Assuming that ZnWO4 presents direct transitions between the valence (VB) and conduction (CB) bands,74, 89, 109-111 the Egap values for all the samples were calculated using n = 1.112, 113 The Egap was obtained by extrapolating the linear portion of the (αhʋ)2 versus hʋ plots of the UV-vis curves, according to [αhʋ = A(hʋ−Egap)n/2]112, 113 equation, where α is the absorption coefficient and hʋ is the photon energy.74, 89, 112, 113
Fig. ESI-3 shows the UV-vis spectra for the ZnWO4 nanocrystals obtained by the MH method at 140, 150, and 160 °C and the corresponding Egap values are listed in Table 3.