Water storage in a Plinthaqualf cultivated
with sugarcane under straw levels
João Carlos Rocha dos Anjos(1),Aderson Soares de Andrade Júnior(2),Edson Alves Bastos(2), Donavan Holanda Noleto(3), Francisco de Brito Melo(2) and Raimundo Rodrigues de Brito(4)
(1)Universidade Federal do Piauí (UFPI), Campus Professora Cinobelina Elvas, Rodovia Municipal Bom Jesus-Viana, Km 01, Planalto
Horizonte, CEP 64900-000 Bom Jesus, PI, Brazil. E-mail: agrojoaocarlos@gmail.com (2)Embrapa Meio-Norte, Avenida Duque
de Caxias, no 5.650, CEP 64006-220 Teresina, PI, Brazil. E-mail: aderson.andrade@embrapa.br, edson.bastos@embrapa.br,
francisco.brito@embrapa.br (3)Companhia Nacional de Abastecimento, Superintendência Regional do Maranhão, Rua dos Sabiás
no 04, Quadra 05, Lotes 04 e 05, Jardim Renascença, CEP 65075-360 São Luís, MA, Brazil. E-mail: donavan.noleto@conab.gov.br (4)UFPI, Programa de Pós-graduação em Agronomia, Campus Universitário Ministro Petrônio Portella, s/no, Ininga, CEP 64049-550
Teresina, PI, Brazil. E-mail: raimundope10@yahoo.com.br
Abstract – The objective of this work was to evaluate water storage in a Plinthaqualf under different straw levels during the fourth ratoon season of a sugarcane (Saccharum officinarum) crop. The study was conducted in the 2013/2014 crop season, with the cultivar SP-813250, at two soil depths (0.0–0.3 and 0.3–0.6 m), in a randomized complete block design, with five straw levels (0.0, 4.2, 9.5, 13.0, and 18.4 Mg ha-1) and four replicates. Soil moisture content was monitored with a time-domain reflectometer. The straw provided gains of up to 20 Mg ha-1 stems and kept increased water storage in the soil, in comparison with the soil without straw, in all evaluated periods. Maintenance of up to 50% (9.5 Mg ha-1) of sugarcane straw on soil surface promotes better water retention in the soil per Mg of straw added and delays the reach of critical water storage in the soil by up to 11 days, when compared with soil without straw cover.
Index terms: Saccharum officinarum, no-tillage, soil mulch, water balance.
Armazenamento de água em Plintossolo Argilúvico cultivado
com cana-de-açúcar sob níveis de palhada
Resumo – O objetivo deste trabalho foi avaliar o armazenamento de água em um Plintossolo Argilúvico sob diferentes níveis de palhada durante o ciclo de quarta soca da cana-de-açúcar (Saccharum officinarum). O estudo foi conduzido na safra 2013/2014, com a cultivar SP-813250, em duas profundidades (0,0‒0,3 e 0,3‒0,6 m), em delineamento de blocos ao acaso, com cinco níveis de palhada (0,0, 4,2, 9,5, 13,0, e 18,4 Mg ha-1) e quatro repetições. A umidade do solo foi monitorada com reflectômetro de domínio de tempo. A palhada proporcionou ganho de até 20 Mg ha-1 de colmos e manteve o solo com maior armazenamento de água do que o sem palhada, em todos os períodos avaliados. A manutenção de até 50% (9,5 Mg ha-1) de palhada de cana-de-açúcar sobre a superfície do solo promove melhor conservação de água no solo por Mg de palha adicionada e retarda em até 11 dias o alcance do armazenamento crítico de água no solo, em comparação ao solo sem cobertura de palha.
Termos para indexação: Saccharum officinarum, plantio direto, cobertura do solo, balanço hídrico.
Introduction
The no-tillage system, which has as principle maintaining crop residues as soil cover, has positive effects, provided by straw cover, on the reduction of water loss through evaporation, on water storage in the soil, and on soil organic matter content (Galdos et al., 2009; Santana et al., 2011). Water kept in the soil for a longer time favors the growth and development of agricultural crops, especially of those with a
semi-perennial cycle such as sugarcane (Saccharum
officinarum L.), which is subjected to periods of water
deficiency during its growing cycle.
The amount of straw from sugarcane harvested
without burning is estimated in 10 to 30 Mg ha-1,
alcohol. However, the straw kept on soil surface has primary functions in sugarcane cultivation without burning, related to, for example, soil water dynamics (Peres et al., 2010), soil organic matter (Souza et al., 2005), root system dynamics (Aquino et al., 2015),
plant biometry and physiology (Aquino & Medina,
2014), and stalk yield and broth quality (Souza et al., 2005). Therefore, it is necessary to know the proportion of straw that must be removed from the
field for energy purposes, without affecting
long-term soil sustainability.
Studies on soil water dynamics in response to the maintenance of different straw levels on its surface have been carried out with common bean (Chieppe Júnior et al., 2007; Pereira et al., 2015), corn, millet,
and soybean (Silva et al., 2006). In the specific case of
sugarcane, stand out the works performed by Timm et al. (2002) and Peres et al. (2010) on clay soils, such as a Latossolo Vermelho-Escuro (Oxisol) and structured purple soil. However, there are no known studies with this purpose for sugarcane, especially in crops on soils of medium-sandy texture, typical of the regions where this crop is expanding in Northeastern Brazil, mainly in the state of Piauí.
The objective of this work was to evaluate water storage in a Plinthaqualf under different straw levels during the fourth ratoon season of a sugarcane crop.
Materials and Methods
The experiment was carried out at the Comvap Açúcar e Álcool Ltda. mill (04°35'09"S, 42°51'51"W, at 52 m of altitude) in the municipality of Teresina, in the state of Piauí, Brazil, from July 2013 to July
2014. According to Thornthwaite & Mather (1957), the climate of the region is classified as C1sA’a’,
subhumid dry, megathermal, with moderate water excess during the summer and mean annual rainfall
of 1,343 mm. The soil is classified as a Plintossolo
Argilúvico (Santos et al., 2006), i.e., a Plinthaqualf. The following chemical, physical, and hydraulic characteristics were found in the 0.0–0.3-m layer: 778 g kg-1 sand; 131 g kg-1 silt; 91 g kg-1 clay; field
capacity (FC) of 24% in volume; permanent wilting point (PWP) of 4% in volume; soil bulk density (Db) of 1.5 Mg m-3; loamy sand texture class; 7.6 g kg-1 soil
organic matter (SOM); base saturation percentage (V) of 55.4%; cation exchange capacity (CEC) of
6.1 cmolc dm-3; and potential acidity (H+Al) of 2.7
cmolc dm-3. In the 0.3–0.6-m layer: 709 g kg-1 sand;
137 g kg-1 silt; 154 g kg-1 clay; FC of 25% in volume;
PWP of 5% in volume; Db of 1.48 Mg m-3; sandy loam
texture class; 3.4 g kg-1 SOM; V of 42.3%; CEC of 4.3
cmolc dm-3; and 3.3 cmolc dm-3 H+Al.
The treatments consisted of five sugarcane straw
levels of the SP-813250 cultivar, in the fourth ratoon cycle, which were produced in the studied area and distributed on soil surface in the proportions of
0, 25, 50, 75, and 100% of total straw yield, which
corresponded to the following levels of soil cover: 0.0,
4.2, 9.5, 13.0, and 18.4 Mg ha-1 dry straw, respectively.
In the three previous crop cycles, in the plots, the same proportions of straw were maintained on soil surface, whose quantities varied due to total straw yield. The uncrushed straw was distributed on soil surface in successive layers, containing all the straw mass for each treatment. The experimental plots presented the dimensions of 10 m of width x 15 m of length. A randomized complete block design was used, with
five treatments and four replicates. Soil water storage
variation was measured at two depths, in the layers of 0.0–0.3 and 0.3–0.6 m. Sugarcane was cultivated at a spacing of 1.4 m between rows, with 15 gems per linear meter.
Soil water content monitoring was performed using
the TDR100 time-domain reflectometer (Campbell Scientific Brasil, São Paulo, SP, Brazil), consisting
of 40 probes with 0.3 m of length, interconnected by
50Ω coaxial cables, seven SDMX50 multiplexers, and
one CR10X datalogger. The probes were installed in the 0.0–0.3 and 0.3–0.6-m layers, about 0.2 m from the central row of the plants of each plot. For the installation of the deepest probe, it was necessary to excavate the soil to a depth of 0.3 m, which allowed maintaining the original structure and density of the layer. Soil moisture was recorded every 30 min. The values of humidity, at a daily scale, were obtained by the average of the 48 records for each day.
For the calibration of TDR100 in the experimental area, soil moisture measurements were obtained at each studied depth, by collecting three samples weekly in each point, with four replicates. The equation of Ledieu et al. (1986), from which the dielectric constant (Ka) was obtained, which was
correlated with the standard moisture (θ) (oven) – θ versus Ka – was used, resulting in the following
layers, respectively: θ = -0.1996 + 0.1188 (Ka)0.5 and
θ = -0.1936 + 0.1176 (Ka)0.5.
Daily soil water storage (WS) was calculated by multiplying the daily volumetric water content (cm3 cm-3) by the layer thickness of each evaluated soil
profile (300 mm). The upper (FC = 25% in volume) and lower (PWP = 5% in volume) limits of soil water
availability in the experimental area equivalent to the voltage points of -10 and -1,500 kPa, respectively,
were determined in the laboratory using Richard’s
membrane method. For the determination of the critical soil water storage (CS) for sugarcane, the p fraction adopted was equal to 0.5, as recommended
by the FAO-56 Manual (Allen et al., 1998).
Despite the continuous monitoring of soil water
storage, it was decided to evaluate specific periods,
mainly between rainfall and/or irrigation events, during the crop cycle. The following periods were evaluated: 1, from 107 to 129 days after cane cut (DAC), i.e., tillering stage; 2, from 132 to 150 DAC,
rapid growth phase; 3, from 310 to 332 DAC, final
growth stage and beginning of maturation; and 4, from 335 to 361 DAC, maturation stage. The TableCurve software (Systat Software Inc., Chicago, IL, USA) was used to adjust the daily water storage curves in the soil as a function of the accumulated crop evapotranspiration (ETcac) in each evaluated period. ETcac was used instead of the time of each drying period (in days) as a way of including the
effect of water extraction by the crop, since different stages of crop development were evaluated. Daily ETc values were obtained by multiplying the daily reference evapotranspiration (ETo) values by the crop
coefficient (Kc) values, in each evaluated period of
development, which were obtained from the FAO-56
Manual (Allen et al., 1998).
In order to evaluate the contribution of straw to WS,
the WS variation (∆WS, in mm) was divided in each
evaluation period by the respective straw mass added
to soil surface (Mg). The term ∆WS was obtained by the equation: ∆WS (mm Mg-1) = WSi - WSf,
in which WSi is the WS at the beginning of the evaluation period (mm) and WSf is the WS at the end of the evaluation period (mm).
The meteorological monitoring was carried out by an automatic agrometeorological station, distant about 500 m from the experimental area, where the meteorological data used to estimate the daily ETo, by
the Penman Monteith method, was collected (Allen et
al., 1998). Rainfall was determined, and the irrigation blade was applied using a sprinkler irrigation system during crop establishment (Figure 1). The Comvap Açúcar e Álcool Ltda. mill uses the rescue irrigation method, which consists of the application of 30 mm of water every 15 days, from regrowth to full vegetative development.
The leaf area index (LAI) was used as an indicator of the variation in sugarcane development in response
Figure 1. Rainfall and irrigation registered during the fourth-ratoon sugarcane (Saccharum officinarum) cycle, from
to soil water storage levels. The LAI was quantified
monthly in the period between 107 and 361 DAC, based on the plant leaf area (LA), divided by the area
occupied by a linear meter of the crop (1.4 m2). To
calculate the LA, the method described by Hermann & Câmara (1999) was followed, by counting the number of green leaves and measuring the length and width of the 3+ leaf, using a measuring tape and a ruler,
according to Kuijper’s numbering system (Dillewijn,
1952). Stalk yield, measured in tons of stalks per hectare (TSH), was obtained by weighing the stalks and dividing the value by the plot area, extrapolating the result to an area of 1 ha, which was expressed in
Mg ha-1. The LAI and TSH data were subjected to
the analysis of variance, at 5% probability, by Tukey’s
test, using the Assistat software (Silva, 2013).
Results and Discussion
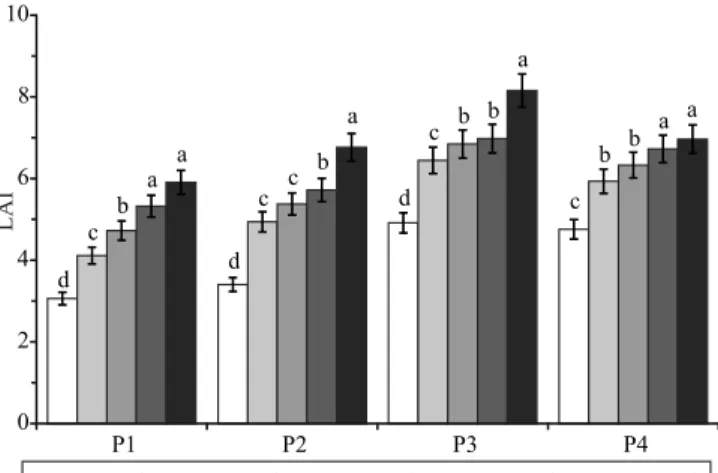
The straw level significantly affected the LAI in
all evaluated periods. The greatest values of the LAI
were obtained with the application of 18 Mg ha-1 straw
on the soil, when compared with uncovered soil, for which the lowest values were observed (Figure 2). The differences in crop development, measured as LAI, resulted from the variation of soil water storage promoted by the reduction of water loss by evaporation in each straw level (Farias et al., 2008). The LAI has a direct effect on soil moisture dynamics, either by the direct effect of soil shading between plant rows, or even by the higher or lower water extraction from the soil to meet the plant water requirements (Ritchie & Basso, 2008). Soil cover with straw provides better water use and helps the soil-water-plant-atmosphere relationship by decreasing water temperature and evaporation and increasing moisture maintenance in
the soil profile (Pereira et al., 2015).
There was no significant difference in the LAI between the levels of 4.2 and 9.5 Mg ha-1 straw in
periods 2 and 4, which is an indicative that small amounts of straw kept on the soil promote sugarcane development. The LAI does not present a linear response to the increase in the level of soil cover and, therefore, does not alter, in the same proportion, soil moisture dynamics and sugarcane stalk yield. Aquino
& Medina (2014) associated the increase in the LAI
to the increase in soil water storage, provided by the presence of straw. Tavares et al. (2010) observed a positive correlation between the LAI and stalk yield,
and associated productivity gain to the reduction in soil water loss due to the straw kept on soil surface. Peres et al. (2010) reported that the presence of sugarcane straw on soil surface reduced water losses to half of the one found under uncovered soil conditions.
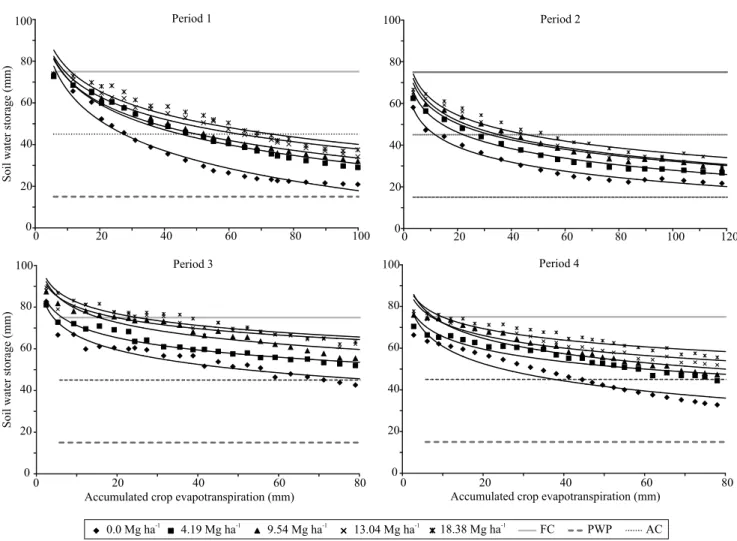
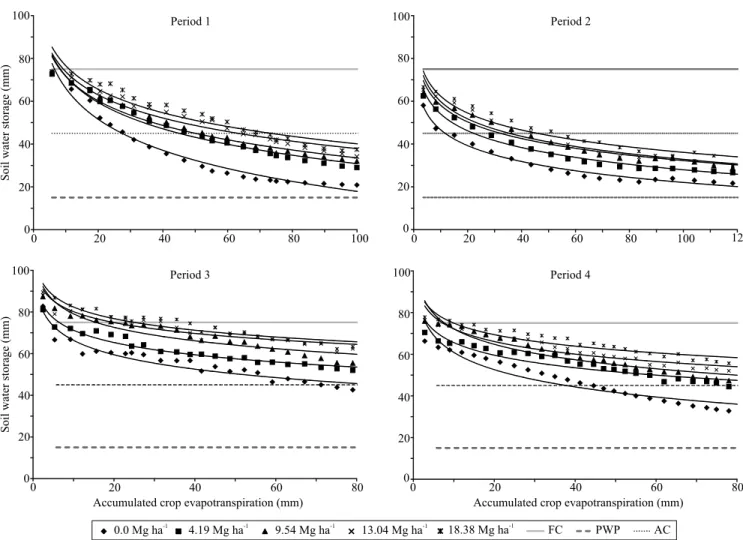
For all evaluated periods, the values of WS in the treatment without straw cover were lower than those of WS with straw (Figure 3), which can be explained by the greater water losses by direct evaporation in this treatment and by the lower shading in between plant lines, evidenced by the reduced LAI values in this crop development stage (Figure 2). Given the proximity of the WS trend lines, in the treatments with 9.5, 13.0, and
18.4 Mg ha-1, there was a small variation in WS,
especially in the first three periods of evaluation, which coincided with the phases of greater water demand, in which there is a higher extraction of soil water by roots (Allen et al., 1998).
The cover level that allowed the lowest ∆WS per Mg of straw added to the soil was 18.4 Mg ha-1 (mean
of 1.7 mm Mg-1), but it did not differ significantly
Figure 2. Leaf area index (LAI) of sugarcane (Saccharum
from the levels of 13.0 (mean of 2.6 mm Mg-1) and
9.5 Mg ha-1 (mean of 3.7 mm Mg-1). The greatest
∆WS was obtained when the level of 4.2 Mg ha-1 was
applied, ranging from 11.0 mm Mg-1, during period 1,
to 7.0 mm Mg-1, during period 4. This result can be
explained by the way the straw was arranged on soil surface. Since the straw was not crushed, but left on
soil surface, the first layers of straw, closer to the soil,
blocked more solar radiation, which avoided heating and the consequent loss of soil water, when compared with the upper layers (Silva et al., 2006). The
maintenance of 9.5 Mg ha-1 straw, although it did not
result in the lowest ∆WS per Mg of straw, relatively allowed a better efficiency in the conservation of WS,
since the straw additions of 13.0 and 18.4 Mg ha-1 did
not provide significant gains in WS.
In the treatments with straw application, there was a gradual reduction in WS, which followed an inverse order to the amount of straw left on soil surface. However, in periods 3 and 4, when the crop completely covers soil surface, which is evidenced by the high LAI values (Figure 2), evaporation loses importance in soil water extraction, while transpiration prevails (Dalmago et al., 2010). In these periods, the decomposition process of the added straw
on soil surface has already been practically finished
(Santana et al., 2011). Therefore, in this phase of the
cycle, soil water dynamics is also altered by the SOM
Figure 3. Soil water storage (WS), at the 0.0 to 0.3-m depth, as a function of accumulated crop evapotranspiration (ETcac),
content resulting from straw decomposition (Galdos et al., 2009).
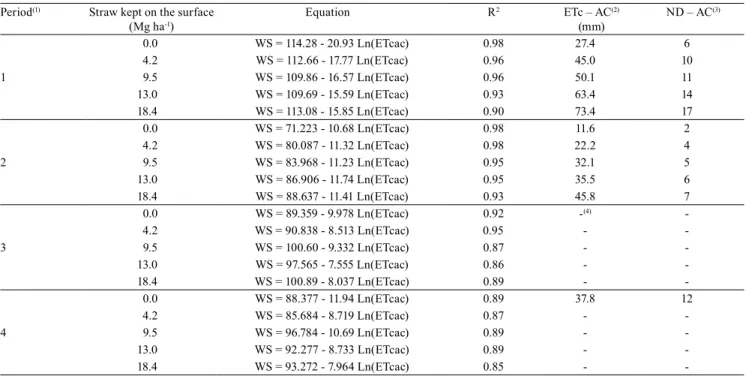
The WS data followed a logarithmic (nonlinear) model in relation to the ETcac data, with good
determination coefficients, for all evaluated periods
(Table 1). The analysis of the regression equations
allows measuring the benefits of straw for WS
maintenance, after rainfall and/or irrigation events, represented by ND-CS and/or ETc-CS.
The straw level of 18.4 Mg ha-1, in period 1, allowed
a ND-CS gain of up to 11 days and 46 mm of ETc-CS, when compared with the soil without cover. However,
with 9.5 Mg ha-1 straw, there was a ND-CS gain of
only five days and 22.7 mm of ETc-CS (Table 1), showing the benefits of soil cover at the beginning
of the growth cycle. In period 2, with maximum
demand for water (Kc = 1.25), the values of ETc-CS
and ND-CS were lower, which is an indication of a rapid reduction in WS by water extraction by the crop
roots (Figure 3). In this phase, if the soil is maintained without straw cover, CS will be reached two days after rain and/or irrigation, but, in soil covered with straw,
this time will be increased to four (4.2 Mg ha-1), five
(9.5 Mg ha-1), and seven days (18.4 Mg ha-1), which is
very important in a region with irregular rainfall and prolonged drought (Bastos & Andrade Júnior, 2014).
In periods 3 and 4, with the exception of the treatment without straw in period 4, the WS curves were always above the CS line during all the evaluated periods (Figure 3). In period 3, for all straw levels, WS remained favorable and above the recommended CS for sugarcane. In the middle of period 4, only in the soil without straw did the WS reduce to lower levels than the CS recommended for sugarcane. This
is explained by the fact that, in the final phase of crop
development, there is a reduction in the direct water evaporation from soil surface (Peres et al., 2010), due to the shading between planting lines (Dalmago
Table 1. Regression equations for soil water storage (WS), at the 0.0 to 0.3-m depth, as a function of accumulated crop
evapotranspiration (ETcac), for each level of sugarcane (Saccharum officinarum) straw kept on the surface of a Plinthaqualf, during the evaluated periods.
Period(1) Straw kept on the surface (Mg ha-1)
Equation R2 ETc – AC(2)
(mm)
ND – AC(3)
0.0 WS = 114.28 - 20.93 Ln(ETcac) 0.98 27.4 6
4.2 WS = 112.66 - 17.77 Ln(ETcac) 0.96 45.0 10
1 9.5 WS = 109.86 - 16.57 Ln(ETcac) 0.96 50.1 11
13.0 WS = 109.69 - 15.59 Ln(ETcac) 0.93 63.4 14
18.4 WS = 113.08 - 15.85 Ln(ETcac) 0.90 73.4 17
0.0 WS = 71.223 - 10.68 Ln(ETcac) 0.98 11.6 2
4.2 WS = 80.087 - 11.32 Ln(ETcac) 0.98 22.2 4
2 9.5 WS = 83.968 - 11.23 Ln(ETcac) 0.95 32.1 5
13.0 WS = 86.906 - 11.74 Ln(ETcac) 0.95 35.5 6
18.4 WS = 88.637 - 11.41 Ln(ETcac) 0.93 45.8 7
0.0 WS = 89.359 - 9.978 Ln(ETcac) 0.92 -(4)
4.2 WS = 90.838 - 8.513 Ln(ETcac) 0.95 -
-3 9.5 WS = 100.60 - 9.332 Ln(ETcac) 0.87 -
-13.0 WS = 97.565 - 7.555 Ln(ETcac) 0.86 -
-18.4 WS = 100.89 - 8.037 Ln(ETcac) 0.89 -
0.0 WS = 88.377 - 11.94 Ln(ETcac) 0.89 37.8 12
4.2 WS = 85.684 - 8.719 Ln(ETcac) 0.87 -
-4 9.5 WS = 96.784 - 10.69 Ln(ETcac) 0.89 -
-13.0 WS = 92.277 - 8.733 Ln(ETcac) 0.89 -
-18.4 WS = 93.272 - 7.964 Ln(ETcac) 0.85 -
-(1)1, from 107 to 129 days after sugarcane cut (DAC), i.e., tillering stage; 2, from 132 to 150 DAC, fast growth phase; 3, from 310 to 332 DAC, final
growth phase and beginning of maturation; and 4, from 335 to 361 DAC, maturation phase. (2)ETc-CS, crop evapotranspiration needed to achieve
critical storage (mm). (3)ND-CS, number of days for critical storage. (4)-, estimated ETc-CS values greater than the experimental values. R2, coefficient
et al., 2010) and the crop’s water requirement (Allen
et al., 1998). Indeed, the higher retention of water in
the soil is attributed to the increase in SOM content
because of straw decomposition.
In the surface layer of 0.0–0.3 m, in all evaluation periods, the level of coverage that allowed the
lowest ∆WS per Mg of straw added to the soil was 18.4 Mg ha-1 (mean of 1.3 mm Mg-1), but did it not
differ significantly from the levels of 13.0 (mean of 1.9 mm Mg-1) and 9.5 Mg ha-1 (mean of 2.9 mm Mg-1).
The greatest ∆WS was obtained with the level of 4.2 Mg ha-1, ranging from 8.0 mm Mg-1, in period
1, to 5.0 mm Mg-1, in period 4. Although with lower
intensity, soil cover with 9.5 Mg ha-1 straw also
allowed a better efficiency in maintaining WS, in
comparison with the other evaluated straw levels. In all evaluated periods, in the 0.3–0.6-m layer, the values of WS in the uncovered soil, during the whole monitoring period, were lower than those of WS in the straw cover (Figure 4), but with a lower intensity due to the lower contribution of the water evaporation component (Dalmago et al., 2010) and to the lower water loss in this depth. Peres et al. (2010), evaluating the coverage of sugarcane straw in the volumetric
moisture (θ) of a Latossolo Vermelho-Escuro (Oxisol)
with clayey texture, concluded that the effect of straw
Figure 4. Soil water storage (WS) at the 0.3 to 0.6-m depth, as a function of accumulated crop evapotranspiration (ETcac),
cover on soil volumetric moisture decreases with the increase of depth and that water loss in uncovered soils occurred mainly by evaporation. According to Aquino et al. (2015), there is also a lower contribution of the component water extraction by the crop roots because of the lower concentration of roots in the 0.3–0.6-m layer. In this layer, WS is more affected by soil granulometry, especially the clay fraction,
which presents a higher content (112.0 g kg-1) than the
0.0–0.3-m layer (81.2 g kg-1).
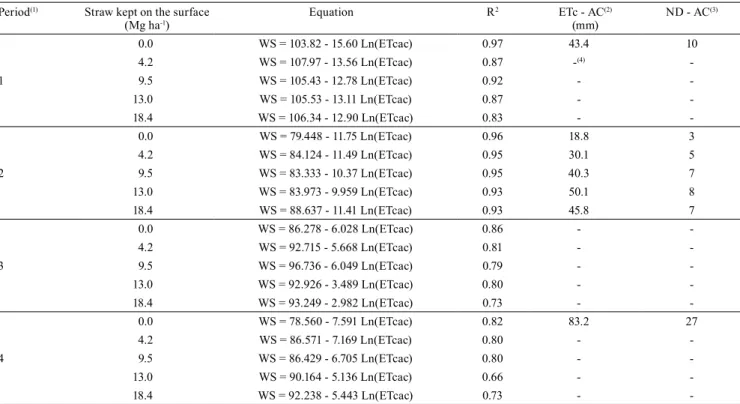
As in the 0.0–0.3-m layer, in the 0.3–0.6-m one, WS also followed a logarithmic (nonlinear) model in relation to the ETcac estimates (Table 2). However, the ETc-CS and ND-CS values were reduced in relation to the surface layer, which is an indication that there was a reduction in water losses attributed to root extraction (Figures 4). In fact, under high water demand, as in period 2, if the soil is maintained without straw, the
CS will be reached in three days, after rainfall and/ or irrigation, while, in the soil covered with straw,
this time varies from five (4.2 Mg ha-1) to eight days
(13.0 Mg ha-1). According to Aquino et al. (2015), it
is a characteristic of sugarcane to have greater root development in the 0.0–0.2-m layer.
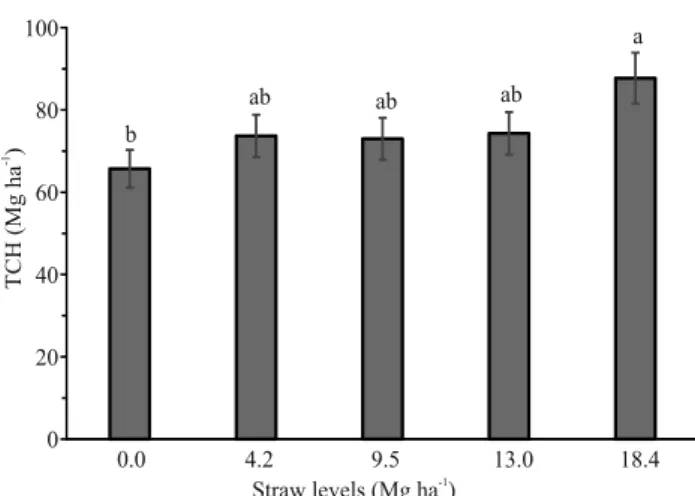
Significant differences were observed between
the means for TCH of fourth-ratoon sugarcane cultivated on soil covered with the different straw levels (Figure 5), mainly between the soil without and
with 100% straw; however, there was no significant
difference between the other straw levels. The greatest differences in TCH were obtained when
the treatments without cover (65.7 Mg ha-1) and with
total soil cover (87.7 Mg ha-1) were compared, with a
gain of 20 Mg ha-1, which shows that the increase in
WS provided by straw maintenance on soil surface, mainly on the 0.0–0.3-m layer (Figure 3), allowed
Table 2. Regression equations for soil water storage (WS), at the 0.3 to 0.6-m depth, as a function of accumulated crop
evapotranspiration (ETcac), for each level of sugarcane (Saccharum officinarum) straw kept on the surface of a Plintha-qualf, during the evaluated periods.
Period(1) Straw kept on the surface (Mg ha-1)
Equation R2 ETc - AC(2)
(mm)
ND - AC(3)
0.0 WS = 103.82 - 15.60 Ln(ETcac) 0.97 43.4 10
4.2 WS = 107.97 - 13.56 Ln(ETcac) 0.87 -(4)
-1 9.5 WS = 105.43 - 12.78 Ln(ETcac) 0.92 -
-13.0 WS = 105.53 - 13.11 Ln(ETcac) 0.87 -
-18.4 WS = 106.34 - 12.90 Ln(ETcac) 0.83 -
0.0 WS = 79.448 - 11.75 Ln(ETcac) 0.96 18.8 3
4.2 WS = 84.124 - 11.49 Ln(ETcac) 0.95 30.1 5
2 9.5 WS = 83.333 - 10.37 Ln(ETcac) 0.95 40.3 7
13.0 WS = 83.973 - 9.959 Ln(ETcac) 0.93 50.1 8
18.4 WS = 88.637 - 11.41 Ln(ETcac) 0.93 45.8 7
0.0 WS = 86.278 - 6.028 Ln(ETcac) 0.86 -
4.2 WS = 92.715 - 5.668 Ln(ETcac) 0.81 -
-3 9.5 WS = 96.736 - 6.049 Ln(ETcac) 0.79 -
-13.0 WS = 92.926 - 3.489 Ln(ETcac) 0.80 -
-18.4 WS = 93.249 - 2.982 Ln(ETcac) 0.73 -
0.0 WS = 78.560 - 7.591 Ln(ETcac) 0.82 83.2 27
4.2 WS = 86.571 - 7.169 Ln(ETcac) 0.80 -
-4 9.5 WS = 86.429 - 6.705 Ln(ETcac) 0.80 -
-13.0 WS = 90.164 - 5.136 Ln(ETcac) 0.66 -
-18.4 WS = 92.238 - 5.443 Ln(ETcac) 0.73 -
-(1)1, from 107 to 129 days after sugarcane cut (DAC), i.e., tillering stage; 2, from 132 to 150 DAC, fast growth phase; 3, from 310 to 332 DAC, final growth
phase and beginning of maturation; and 4, from 335 to 361 DAC, maturation phase. (2)ETc-CS, crop evapotranspiration needed to achieve critical storage
significant gains in TCH, since the main limiting
factor for TCH is the water availability for the crop, especially in the period of greater water requirement.
However, in the 4.2 Mg ha-1 straw level, a gain of
8.0 Mg ha-1 TCH was observed, when compared with
the treatment without soil cover, with a better TCH
response per level of straw kept on the soil (1.9 Mg ha-1
straw), not differing from the levels of 9.5 and 13.0
Mg ha-1. The level of 18.4 Mg ha-1 straw resulted in
TCH of 87 Mg ha-1, with a gain of 20 Mg ha-1 TCH;
however, a ratio of 1.1 and 0.8 Mg ha-1 TCH was
observed when compared with uncovered soil and
with 4.2 Mg ha-1 straw, respectively. This result is
related to the effect of the straw layers arranged on
soil surface. Aquino & Medina (2014) observed gains of 28 Mg ha-1 on cane plant yield while evaluating
different straw levels. Aquino et al. (2015) concluded
that the deposition of 10 Mg ha-1 (50%) straw on the
soil was enough to increase sugarcane crop yield. Tavares et al. (2010) found a productivity gain with successive sugarcane cultivation without burning, which was associated with the increase in WS.
In the present study, the maintenance of 25% (4.2 Mg ha-1) of soil cover was sufficient to preserve
WS for sugarcane, extending in up to ten days the period for CS, mainly for the 0.0–0.3-m layer
(Table 1). However, due to the fact that cover with 50% of straw (9.5 Mg ha-1) promoted better conservation
of WS per Mg of added straw (mean of 3.7 mm Mg-1)
and improved other soil attributes, it is adequate to
maintain 50% of straw cover (9.5 Mg ha-1), since the
higher coverage levels did not promote a substantial gain in soil water storage. In this way, the excess of straw produced can be used for other purposes, such as the cogeneration of clean and renewable energy by the sugar and alcohol industries.
Conclusion
The maintenance of up to 50% (9.5 Mg ha-1) of
sugarcane (Saccharum officinarum) straw on soil
surface promotes better conservation of soil water
by Mg of added straw (3.7 mm Mg-1), delays in up
to 11 days the reach of critical water storage in the
soil, and increases stalk yield by 8.0 Mg ha-1, when
compared with uncovered soils.
Acknowledgments
To Embrapa Meio-Norte, to the Comvap
Açúcar e Álcool Ltda. mill, to Petrobras, and to
Conselho Nacional de Desenvolvimento Científico e Tecnológico (CNPq), for finnancial support; and
to Coordenação de Aperfeiçoamento de Pessoal de Nível Superior (Capes), for the scholarship granted.
References
ALLEN, R.G.; PEREIRA, L.S.; RAES, D.; SMITH, M. Crop
evapotranspiration: guidelines for computing crop water requirements. Rome: FAO, 1998. 297p. (FAO. Irrigation and drainage paper, 56).
AQUINO, G.S. de; MEDINA, C. de C. Produtividade e índices biométricos e fisiológicos de cana-de-açúcar cultivada sob
diferentes quantidades de palhada. Pesquisa Agropecuária Brasileira, v.49, p.173-180, 2014. DOI: 10.1590/S0100-204X2014000300003.
AQUINO, G.S. de; MEDINA, C. de C.; PORTEIRA JUNIOR,
A.L.; SANTOS, L.O.; CUNHA, A.C.B.; KUSSABA, D.A.O.;
SANTOS JUNIOR, J.H. dos; ALMEIDA, L.F.; SANTIAGO,
A.D. Sistema radicular e produtividade de soqueiras de cana-de-açúcar sob diferentes quantidades de palhada. Pesquisa Agropecuária Brasileira, v.50, p.1150-1159, 2015. DOI: 10.1590/S0100-204X2015001200004.
BASTOS, E.A.; ANDRADE JÚNIOR, A.S. de. Boletim agrometeorológico de 2013 para o Município de Teresina, Piauí. Teresina: Embrapa Meio-Norte, 2014. 38p. (Embrapa
Meio-Norte. Documentos, 228).
Figure 5. Sugarcane (Saccharum officinarum) stalk yield
CHIEPPE JÚNIOR, J.B.; PEREIRA, A.L.; STONE, L.F.;
MOREIRA, A.E.K. Efeitos de níveis de cobertura do solo sobre
a produtividade e crescimento da cultura do feijoeiro irrigado, em sistema plantio direto. Irriga, v.12, p.177-184, 2007.
CHRISTOFFOLETI, P.J.; CARVALHO, S.J.P. de;
LÓPEZ-OVEJERO, R.F.; NICOLAI, M.; HIDALGO, E.; SILVA, J.E.
da. Conservation of natural resources in Brazilian agriculture: implications on weed biology and management. Crop Protection, v.26, p.383-389, 2007. DOI: 10.1016/j.cropro.2005.06.013.
DALMAGO, G.A.; BERGAMASCHI, H.; KRÜGER, C.A.M.B.; BERGONCI, J.I.; COMIRAN, F.; HECKLER, B.M.M.
Evaporação da água na superfície do solo em sistemas de plantio direto e preparo convencional. Pesquisa Agropecuária Brasileira, v.45, p.780-790, 2010. DOI: 10.1590/S0100-204X2010000800002.
DILLEWIJN, C.V. Botany of sugarcane. Walthham: Chronica Botanica, 1952. 371p.
FARIAS, C.H. de A.; FERNANDES, P.D.; AZEVEDO, H.M.;
DANTAS NETO, J. Índices de crescimento da cana-de-açúcar irrigada e de sequeiro no Estado da Paraíba. Revista Brasileira de Engenharia Agrícola e Ambiental, v.12, p.356-362, 2008. DOI: 10.1590/S1415-43662008000400004.
GALDOS, M.V.; CERRI, C.C.; CERRI, C.E.P. Soil carbon stocks
under burned and unburned sugarcane in Brazil. Geoderma, v.153, p.347-352, 2009. DOI: 10.1016/j.geoderma.2009.08.025.
HERMANN, E.R.; CÂMARA; G.M.S. Um método simples para
estimar a área foliar da cana-de-açúcar. STAB, Açúcar, Álcool e Subprodutos, v.17, p.32-34, 1999.
LEDIEU, J.; DE RIDDER, P.; DE CLERCK, P.; DAUTREBANDE, S. A method of measuring soil moisture by
time-domain reflectometry. Journal of Hydrology,v.88,
p.319-328, 1986. DOI: 10.1016/0022-1694(86)90097-1.
PEREIRA, F.F.S.; MATSURA, E.E.; MOUSINHO, F.E.P.;
BIZARI, D.R. Retenção de água em níveis de cobertura morta no feijoeiro irrigado em sistema de plantio direto. Irriga, v.20, p.557-569, 2015. DOI: 10.15809/irriga.2015v20n3p557.
PERES, J.G.; SOUZA, C.F.; LAVORENTI, N.A. Avaliação dos efeitos da cobertura de palha de cana-de-açúcar na umidade e na perda de água do solo. Engenharia Agrícola, v.30, p.875-876, 2010. DOI: 10.1590/s0100-69162010000500010.
RITCHIE, J.T.; BASSO, B. Water use efficiency is not constant when crop water supply is adequate or fixed: the role of
agronomic management. European Journal of Agronomy, v.28, p.273-281, 2008. DOI: 10.1016/j.eja.2007.08.003.
SANTANA, J.A. da S.; VIEIRA, F. de A.; SOUTO, J. da S.;
GONDIM, S.C.; FONSECA, F. das C.E. da. Decomposição da
biomassa foliar de cana-de-açúcar em um Neossolo na região de Areia-PB. Revista Caatinga, v.24, p.28-32, 2011.
SANTOS, H.G. dos; JACOMINE, P.K.T.; ANJOS, L.H.C. dos; OLIVEIRA, V.A. de; OLIVEIRA, J.B. de; COELHO, M.R.;
LUMBRERAS, J.F.; CUNHA, T.J.F. (Ed.). Sistema brasileiro
de classificação de solos. 2.ed. Rio de Janeiro: Embrapa Solos, 2006. 306p.
SILVA, F.A.M. da; PINTO, H.S.; SCOPEL, E.; CORBEELS, M.; AFFHOLDER, F. Dinâmica da água nas palhadas de
milho, milheto e soja utilizadas em plantio direto. Pesquisa Agropecuária Brasileira,v.41, p.717-724, 2006. DOI: 10.1590/ S0100-204X2006000500001.
SILVA, F. de A.S. e. ASSISTAT: versão 7.6 beta. 2013. Available at: <http://www.assistat.com/>. Accessed on: Feb. 25 2016.
SOUZA, Z.M. de; PRADO, R. de M.; PAIXÃO, A.C.S.;
CESARIN, L.G. Sistemas de colheita e manejo da palhada de cana-de-açúcar. Pesquisa Agropecuária Brasileira, v.40, p.271-278, 2005. DOI: 10.1590/S0100-204X2005000300011.
TAVARES, O.C.H.; LIMA, E.; ZONTA, E. Crescimento e
produtividade da cana planta cultivada em diferentes sistemas de preparo do solo e de colheita. Acta Scientiarum. Agronomy, v.32, p.61-68, 2010. DOI: 10.4025/actasciagron.v32i1.2051.
THORNTHWAITE, C.W.; MATHER, J.R. Instructions and
tables for computing potential evapotranspiration and the water balance. Centerton: Laboratory of Climatology, 1957. 311p. (Publication in climatology,v.10, n.3).
TIMM, L.C.; OLIVEIRA, J.C.M. de; TOMINAGA, T.T.; CÁSSARO, F.A.M.; REICHARDT, K.; BACCHI, O.O.S.
Water balance of a sugarcane crop: quantitative and qualitative aspects of its measurement. Revista Brasileira de Engenharia Agrícola e Ambiental, v.6, p.57-62, 2002. DOI: 10.1590/S1415-43662002000100011.