Revista Brasileira de
Engenharia Agrícola e Ambiental
Campina Grande, PB, UAEA/UFCG – http://www.agriambi.com.br
v.19, n.6, p.567–573, 2015
Defoliation percentage in two soybean cultivars at different growth stages
Cláudio A. da S. Glier
1, José B. Duarte Júnior
2, Gabriel M. Fachin
3, Antonio C. T. da Costa
2,
Vandeir F. Guimarães
2& Chrismam R. Mrozinski
4DOI: http://dx.doi.org/10.1590/1807-1929/agriambi.v19n6p567-573
A B S T R A C T
The objective of this study was to evaluate the agronomic variables due to the effects of different levels of defoliation in the phenological phases of two soybean cultivars. The experiment was conducted during the 2011/2012 season, in a randomized block design with three replicates, in a 2 x 4 x 5 factorial scheme. Two cultivars were exposed to defoliations of 0, 25, 50, 75 and 100% at the stages of V4, V9, R3 and R5. The cultivar ‘NK 7059RR’ showed less sensitivity to defoliation than the cultivar ‘IN 4990RG’. 25% defoliation levels reduced the yield of the cultivar ‘IN 4990RG’, while levels of 75 and 100% reduce the number of grains per pod in both cultivars. The defoliation performed in the V4 stage lead to lower grain yield than defoliation in V9. The most sensitive stages to defoliation are R3 and R5, where there is a greater reduction in the production potential of soybeans.
Percentual de desfolha em duas cultivares
de soja em diferentes estádios fenológicos
R E S U M O
Objetivou-se, com este trabalho, avaliar as variáveis agronômicas em função dos efeitos de diferentes níveis de desfolha nas fases fenológicas de duas cultivares de soja. O experimento foi conduzido durante a safra 2011/12 e o delineamento experimental utilizado foi o de blocos casualizados, com três repetições, em esquema fatorial 2 x 4 x 5, ou seja, duas cultivares foram submetidas à desfolha nos estádios V4, V9, R3 e R5 com porcentagens de 0, 25, 50, 75 e 100%. A cultivar ‘NK 7059RR’ apresentou menor sensibilidade à desfolha do que a cultivar ‘NA 4990RG’. Níveis de 25% de desfolha reduziram a produtividade da cultivar ‘NA 4990RG’ enquanto que níveis de 75 e 100% reduzem o número de grãos por vagem nas duas cultivares. As desfolhas realizadas no estádio V4 acarretam em menor produtividade do que quando realizadas no estádio V9; os estádios mais sensíveis à desfolha são R3 e R5, ocorrendo maior redução no potencial produtivo da soja.
Key words: Glycine max L. yield
leaf area indices
Palavras-chave: Glycine max L. produtividade índice de área foliar
1 COAMO Agroindustrial Cooperativa. Nova Santa Rosa, PR. E-mail: claudiogli@yahoo.com.br (Autor correspondente)
2 Centro de Ciências Agrárias/Universidade Estadual do Oeste do Paraná. Marechal Cândido Rondon, PR. E-mail: jose.junior6@unioeste.br;
antonio.costa2@unioeste.br; vandeirfg@yahoo.com.br
3 Faculdade Educacional de Dois Vizinhos/União de Ensino do Sudoeste do Paraná. Dois Vizinhos, PR. E-mail: gabrielm_fachin@hotmail.com 4 Syngenta Seeds - Marketing e Vendas. Campos de Júlio, MT. E-mail: chrisrovani@hotmail.com
Introduction
Soybean (Glycine max) stood out as the main crop in Brazil in the 2011/12 harvest season, with a production of 66 million tons, occupying an area of approximately 25 million hectares with a mean yield of 2.6 t ha-1. The state of Paraná is among the greatest soybean producers in the country. However, in this same harvest season the crops were severely damaged by the water deficit, caused by the phenomenon “La Niña”. Thus, the state had a yield below the national average, with decrease of 30% in comparison with previous harvests, producing 11 million tons and cultivating approximately 5 million hectares, which led to a yield of 2.4 t ha-1 (CONAB, 2012; SEAB, 2012). The agronomic development of the crop is influenced by abiotic and biotic factors, of which pest insects and especially defoliators stand out (Galon et al., 2010). The attack of defoliating insects can cause a substantial decrease in grain yield for acting directly in the reduction of leaf area, limiting plant photosynthetic rate as a consequence (Câmpelo et al., 1999). Therefore, with the reduction in leaf area, there is a decrease of the yield components, number of pods per plant, number of grains per pod and grain weight (Pratissoli et al., 2001).
In order to simulate the effect of insects, field studies were conducted using artificial removal of leaves, as well as laboratory studies using the pest insects themselves for the defoliation. Authors like Diogo et al. (1997) and Costa et al. (2003) performed the defoliation by removing the leaflets from the trifoliate leaves of soybean, showing that the reaction caused by artificial defoliation is very close to one caused by defoliating insects, and the agronomic variables can be affected according to the intensity and the period of defoliation.
With the beginning of grain formation in the pods, plant demands for water, nutrients and photoassimilates increase. These components are especially directed to grains in formation, to meet the increasing accumulation of dry matter and the biosynthesis of oil and protein in the seeds (Heiffig et al., 2006).
In other crops, such as maize, when all leaves above the ear were removed, the roots became debilitated; however, it was not possible to determine whether this fact occurred because of the reduction in translocation of photoassimilates from the roots to the shoots, due to the stress caused by the total defoliation, or simply because roots stopped being constantly supplied, with the reduction in the production of metabolites (Brito et al., 2011). In tomato plants, defoliation did not reduce the number of fruits; however, they decreased their size and this effect can have been favored by the higher energetic expenditure in cell growth processes of stem and leaves, and by the lower translocation of sugar to fruits (Radin et al., 2008).
Studies have shown the importance of performing Integrated Pest Management (IPM) for the monitoring of pests in many crops, and the introduction of technological innovations can contribute to the elaboration of protocols and to a more efficient and local control, minimizing production costs and the amount of agrochemicals in the environment (Riffel et al., 2012). However, in the soybean cultivation, insecticides have not been used based on the infestation of pest populations, which disrespects the level of control for
the crop. Instead, they are being used based on subjective criteria of perception by the farmer, who uses, in general, pre-programmed calendar-based applications, which are often intended for other agricultural operations, like the application of herbicides and/or fungicides (Bueno et al., 2010).
In western Paraná, short-cycle cultivars have been preferred, unlike the beginning of soybean cultivation in the state, when long-cycle cultivars were used. Thus, soybean cultivars have different behaviors with respect to their agronomic characteristics in response to different levels of defoliation and the period in which it occurs.
Therefore, this study aimed to evaluate the different defoliation levels in vegetative and reproductive stages of two soybean cultivars.
Material and Methods
The experiment was conducted under field conditions during the 2011/12 harvest season, in two locations: the municipality of Marechal Cândido Rondon-PR (24° 31’ 59.80” S; 54° 01’ 02.82” W; 400 m) and the municipality of Toledo-PR (24° 42’ 43.36” S; 53° 45’ 43.56” W; 567 m). The predominant soil in these areas is eutroferric Red Latosol. Before soybean, oatmeal and wheat were cultivated in the experimental areas of Marechal Cândido Rondon and Toledo, respectively.
Soil samples were collected in the layer of 0-20 cm, in July 2011, for the chemical analysis. For the area in Marechal Cândido Rondon, the results were: P = 17.3 mg dm-3, K = 0.9 cmolc dm-3, Al = 0.3 cmol
c dm
-3, H+Al = 5.9 cmol c dm
-3, Ca = 4.5 cmolc dm-3 and Mg = 1.8 cmol
c dm
-3, pH in CaCl 2 = 5.0 and Base saturation (V%) = 55.1. For the area in Toledo, the results were: P = 16.3 mg dm-3, K = 1.5 cmol
c dm
-3, Al = 0 cmol c dm-3, H+Al = 4.0 cmol
c dm
-3, Ca = 6.3 cmol c dm
-3 and Mg = 2.2 cmolc dm-3, pH in CaCl
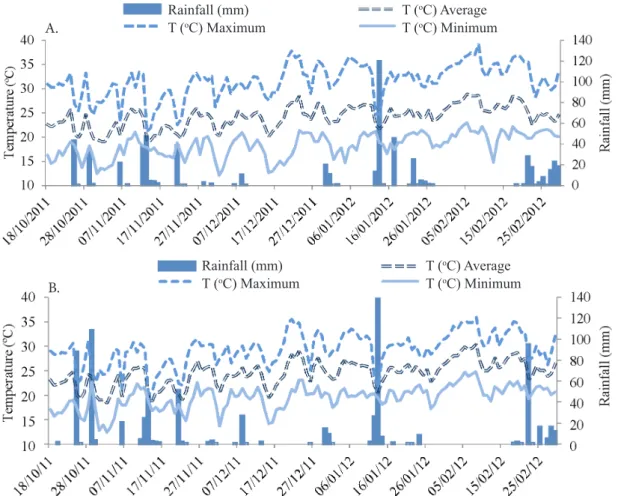
2 = 6.0 and Base saturation (V%) = 71. The meteorological data in the period of the experiments (Figure 1) were obtained from the Weather Stations of the State University of West Paraná – UNIOESTE, in Marechal Cândido Rondon-PR, and from the Pontifical Catholic University – PUCPR, in Toledo-PR.
The experiment was set in a randomized block design, with three replicates, in a 2 x 4 x 5 factorial scheme, using two soybean cultivars (Vmax RR ‘NK 7059RR’ and Nidera ‘NA 4990RG’) subjected to the defoliation levels of 0, 25, 50, 75 and 100%, in the stages V4, V9, R3 and R5, according to the classification of the soybean development stages proposed by Fehr & Caviness (1977).
A pair of scissors was used for the defoliation and the respective percentages of the soybean trifoliate leaf were removed in each treatment, according to Figure 2.
Each experiment had a total area of 1,178 m2 (76.0 x 15.5 m), with blocks of 180 m2 and plots of 4.5 m2 (2.5 x 1.80 m), composed of four rows. The experimental area of each plot constituted of the two central rows, which were 1.0 m long and 0.9 m wide, totaling 0.90 m2.
Figure 1. Rainfall (mm), maximum, minimum and mean temperatures (ºC) at each ten days, from October/2011 to February/2012, UNIOESTE/PPGA/Weather Station of the State University of West Paraná, in the municipality of Marechal Cândido Rondon-PR (A) and UNIOESTE/PPGA/Weather Station of the Pontifical Catholic University, in the municipality of Toledo-PR (B)
Rainfall (mm) T (oC) Maximum
T (oC) Average T (oC) Minimum
Rainfall (mm) T (oC) Maximum
T (oC) Average T (oC) Minimum
A.
B.
Figure 2. Photograph illustrating the cuts in all the leaflets constituting the soybean trifoliate leaf, in the 2011/12 harvest season
During the seeding, the furrows were opened and 250 kg ha-1 of the commercial formulation 2-20-20 were deposited in the row, for the two areas. However, for a better distribution, the seeds were manually placed on a wooden board with equidistant holes at 7 cm and distributed in the seeding furrow.
The cultivars used in the experiment had the following characteristics: Vmax RR ‘NK7059RR’ is within the early maturity group (5.9), with determinate growth habit, average height of 90 cm and 2 to 3 grains per pod; while Nidera ‘NA4990RG’ is within the very-early maturity group (4.9), with indeterminate growth habit, mean height of 63 cm and 2 to 3 grains per pod.
The seeding was performed on October 10, 2011, in Marechal Cândido Rondon, and on October 25, 2011, in Toledo, using the spacing of 0.45 m between rows, with a
density of 31 plants m-2, 14 plants m-1 and at depth of 3-5 cm. The fungicide Carboxin and the insecticide Fipronil were used for seed treatment.
Phytosanitary products were applied using a CO2 -pressurized backpack sprayer. The spray volume used for all applications was 200 L ha-1. Weeds were controlled using glyphosate (1.44 kg a.i. ha-1). Fungal diseases were preventively controlled using a fungicide based on pyraclostrobin and epoxiconazole (66.5 + 25 g a.i. ha-1) (MAPA, 2011).
Pest insects in the experimental area were controlled by monitoring every four days and their occurrence was assessed using a beating-cloth. The control was performed as soon as any pest insect was detected in the experiments, in order to avoid interference in the effects of the studied treatments. Therefore, the velvetbean caterpillar was controlled using the insecticide flubendiamide (9.6 g a.i. ha-1) and the stink bug using thiamethoxam and lambda-cyhalothrin (35.25 + 26.50 g a.i. ha-1). The harvest was performed on February 2, 2012, in Marechal Cândido Rondon, and on February 29, 2012, in Toledo.
the R8 stage. The number of grains per pod was obtained by counting the number of cavities filled with grains, considering twenty pods of ten plants in the lower, medium and upper third part, in the R8 stage. For the mass of 1000 grains, samples collected in the experimental areas of each plot were used. Four samples of 1000 grains, randomly collected, were weighed in a precision scale and corrected to the humidity of 13%.
Yield was evaluated by manually harvesting the experimental area of each plot in the R8 phenological stage. Grain threshing and the removal of impurities were performed using sieves. Then, the humidity was determined, later corrected to 13%, and the grains of each plot were weighed.
Soybean yield components were subjected to analysis of variance through the F test at 0.05 probability level and, when significant, qualitative variables were subjected to Tukey test, also at 0.05 probability level, and quantitative variables to regression analysis. The statistical procedures were performed using the software SAEG (Ribeiro Júnior, 2001).
Results and Discussion
There was no significant difference (p > 0.05) in the number of plants per area for the interaction of Cultivars X Defoliation levels X Period of defoliation. The mean plant population was 310,000 plants ha-1 in Toledo, and 288,888 plants ha-1 in Marechal Cândido Rondon.
There was a significant difference of 25% between the cultivars of the two areas, which can be explained by the genotypic difference of the materials. Peluzio et al. (2004) report that the treatments subjected to 100% of defoliation had significant reduction in plant height in all phenological stages, except for V2 and V3. Peluzio et al. (2002) did not observe significant variations in plant height when 33 and 66% of leaves were removed, regardless of the phenological stage. In the treatments with 100% of defoliation, significant reductions in plant height were observed from the V4 phenological stage on.
The number of pods plant-1 varied for both cultivars, and the ‘NK 7059RR’ had 7.5 pods more than ‘NA 4990RG’. Studies like Ribeiro & Costa (2000) suggest that the number of pods decreased 63.5% for a defoliation of 100% in the R4 stage, compared with the control without defoliation.
There was a significant difference in the number of grains pod-1 between the two cultivars, 2.3 for ‘NK 7059RR’ and 2.2 for ‘NA 4990RG’, which confirms a superiority of the former. However, the number of grains pod-1 in the vegetative stages was similar for both cultivars. On the other hand, in the reproductive stages (R3 and R5), the cultivar ‘NA 4990RG’ had a lower number of grains (0.2).
Since there was a lower rainfall during the experiment in Marechal Cândido Rondon (Figure 1A), the mean yields for both cultivars were considered low compared with the region. Even with an expected yield reduction due to the treatments, the drought contributed to the decrease of yield in this experiment.
In Marechal Cândido Rondon, defoliation levels of up to 50% did not affect the number of grains pod-1, even in reproductive stages, but levels of 75 and 100% caused significant differences and led to 2.47 and 2.35 grains pod-1, respectively. As the cycle progressed, the number of grains decreased to 1.8 and 1.84, since the low number of leaves hampered the formation of grains. Likewise, Ribeiro & Costa (2000) verified significant differences in the treatments with 66% of defoliation in the R5 stage (1.66 grains pod-1) and with 100% in the R6 stage (1.63 grains pod-1), when compared with the control, with 0% of defoliation (2.17 grains pod-1).
For the cultivar ‘NA 4990RG’, the mass of a thousand grains was equal to 145 g with no defoliation. With 100% of defoliation, this number decreased to 136 g, regardless of the stage in which defoliation occurred. The most affected stages were R3 and R5, corresponding to the stages of grain formation and grain filling, which shows that the crop is more compromised in the final development stages. These results agree with Peluzio et al. (2002), who found that soybean plants were more affected in the reproductive stages, producing grains with lower mass in the more advanced crop stages (R5 and R6). Considering the yield data in the V4 and V9 stages (Figures 3 and 4), except for the 25% defoliation level in Toledo, the most critical stage for soybean in the vegetative phase is V4, with the lowest number of leaves, when defoliation was more damaging than in V9. In V9, the grain yield increased, showing a lower capacity of recovery of the crop in the initial stages, compared with the final ones, when plants already have a higher number of leaves.
The results show a decrease in yield from the stage V9 on, in all defoliation levels, with the most critical periods represented by R3 (grain formation) and R5 (grain filling), and the most critical defoliation level corresponding to 100%.
For the 25% defoliation level in Marechal Cândido Rondon, the lowest grain yield occurred in R5 (1590 kg ha-1) and the highest one in V9 (1769 kg ha-1). In agreement with these data, Parcianello et al. (2004) also report grain yield increase of 21% for the defoliation level of 33% in V9, until the reduction of 82% for the defoliation level of 100% in R5. However, in Toledo, for the same defoliation level, V9 showed the lowest grain yield (1859 kg ha-1) and R5 the highest grain yield (1946 kg ha-1).
Grain yield also varied for 50 and 75% of defoliation, in both municipalities; in the vegetative phase, V4 was more affected than V9 and, in the reproductive phase, R5 was more affected than R3. Peterson et al. (1998) verified that defoliation lower than 50%, before flowering, usually does not decrease grain yield, while in the reproductive stages, it has caused higher reductions in the production. Also, Fontoura et al. (2006) report that defoliations lower than 67% did not affect the grain yield of the cultivar ‘BR 16’, regardless of the stage.
For the level of 100%, as the soybean cycle progressed, defoliations caused more damages to grain yield, since the most affected stage was R5. With this defoliation level, Costa
* Means followed by different letters in the column are statistically different by F test at 0.05 probability level
Figure 3. Grain yield (kg ha-1) of soybean as a function of the phenological stages for the defoliation levels of 25% (A),
50% (B), 75% (C) and 100% (D), in the 2011/12 harvest season, in Marechal Cândido Rondon-PR
Figure 4. Grain yield (kg ha-1) of soybean as a function of the phenological stages for the defoliation levels of 25% (A),
50% (B), 75% (C) and 100% (D), in the 2011/12 harvest season, in Toledo-PR
et al. (2003) also observed the highest decreases in R4 and R5. For Rezende et al. (1980), the removal of 100% of the leaves led to significant differences in the stages R3, R4, R5 and R6, with decreases in grain yield of approximately 52, 75, 54 and 23%, respectively.
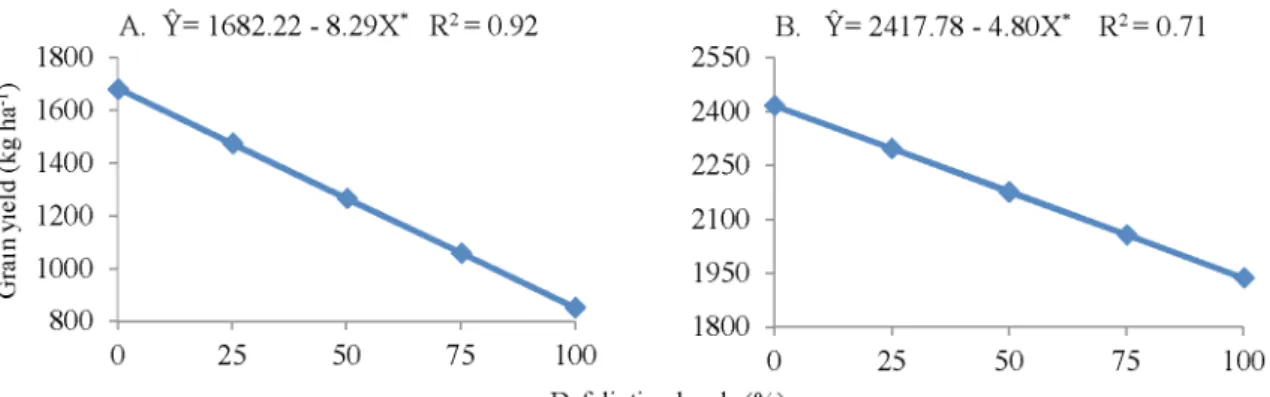
The study proved that the soybean crop is sensitive to leaf loss, decreasing grain yield with defoliation levels considered as low (25%). It is also observed (Figure 5) that grain yield decreases as the defoliation level increases, regardless of the studied cultivar. Considering 0 and 100% of defoliation, it was
4990RG’, in all the phenological stages. Therefore, different control strategies must be adopted for each cultivar.
Conclusions
1. The cultivar ‘NK 7059RR’ showed higher plant height, number of leaves per plant, number of grains per pod, mass of a thousand grains and grain yield, when compared with the cultivar ‘NA 4990RG’. Thus, ‘NK7059RR’ was less sensitive to defoliation than ‘NA 4990RG’.
2. The number of grains per pod was significantly reduced for the defoliation treatment of 75 and 100%. The mass of a thousand grains decreased significantly when defoliation was performed in the stages R3 and R5, regardless of the defoliation levels.
3. Defoliation treatment of 25% affected the grain yield of the cultivar ‘NA 4990RG’. Defoliations in the stage V4 affected more grain yield than the ones in V9, for the environmental conditions of this study.
4. Defoliations performed in the stage R5 are the most harmful ones to the crop, reducing the productive potential of soybean.
Literature Cited
Brito, C. H. de; Silveira, D. L.; Brandão A. M.; Gomes, L. S.; Lopes, M. T. G. Redução de área foliar em milho em região tropical no Brasil e os efeitos em caracteres agronômicos. Interciencia, v.36, p.291-295, 2011.
Bueno, A. de F.; Ferreira, B. S. C.; Bueno, R. C. O. de F. Controle de pragas apenas com o MIP. A Granja, v.1, p.76-79, 2010.
Campelo, J. E. G.; Sediyama, T. Efeitos de desfolhas sobre o início do florescimento da soja cultivada no inverno. Revista Ceres, v.46, p.652-666, 1999.
CONAB. Companhia Nacional de Abastecimento. Acompanhamento de safra brasileira: Grãos: Décimo segundo levantamento, 2012. Brasília: CONAB, 2012. 30p.
Costa, M. A. G,; Balardin, R. S.; Costa, E. C.; Grützmacher, A. D.; Silva, M. T. B. da. Níveis de desfolha na fase reprodutiva da soja, cv. Ocepar 14, sobre dois sistemas de cultivo. Ciência Rural, v.33, p.813-819, 2003. http://dx.doi.org/10.1590/S0103-84782003000500004
Diogo, A. M.; Sediyama, T.; Rocha, V. S.; Sediyama, C. S. Influência da remoção de folhas, em vários estádios de desenvolvimento, na produção de grãos e em outras características agronômicas da soja (Glycine max (L.) Merrill). Revista Ceres, v.44, p.272-285, 1997.
Fehr, W. R.; Caviness, C. E. Stages of soybean development. Ames: State University of Science and Technology, 1977. 11p.
Fehr, W. R .; L awrence, B. K.; Thompson, T. A. Critical stages of development for defoliation of soybean. Crop Science, v.21, p.259-262, 1981. http://dx.doi.org/10.2135/ cropsci1981.0011183X002100020014x
Fontoura, T. B.; Costa, J. A.; Daros, E. Efeitos de níveis e épocas de desfolhamento sobre o rendimento e os componentes do rendimento de grãos da soja. Scientia Agraria, v.7, p.49-54, 2006. http://dx.doi.org/10.5380/rsa.v7i1.7271
Galon. L.; Tironi, S. P.; Rocha, A. A. da; Soares, E. R.; Concenço, G.; Alberto, C. M. Influência dos fatores abióticos na produtividade da cultura do milho. Revista Trópica, v.4, p.18-38, 2010. Heiffig, L. S.; Câmara, G. M. de S.; Marques, L. A.; Pedroso, D. B.;
Piedade, S. M. de S.Fechamento e índice de área foliar da cultura da soja em diferentes arranjos espaciais. Bragantia, v.65, p.285-295, 2006. http://dx.doi.org/10.1590/S0006-87052006000200010 MAPA - Ministério da Agricultura, Pecuária e Abastecimento.
AGROFIT – Sistema de Agrotóxicos Fitossanitários. 2011. <http:// www.agricultura.gov.br/Agrofit> 20 Mai. 2011.
Parcianello, G.; Costa, J. A.; Pires, J. L. F.; Rambo, L.; Saggin, K. Tolerância da soja ao desfolhamento afetada pala redução do espaçamento entre fileiras. Ciência Rural, v. 34, p. 357-364, 2004. http://dx.doi.org/10.1590/S0103-84782004000200004
Peluzio, J. M.; Barros, H. B.; Brito, E. L.; Santos, M. M. dos; Silva, R. R. da. Efeitos sobre a soja do desfolhamento em diferentes estádios fenológicos. Revista Ceres, v.51, p.575-585, 2004.
Peluzio, J. M.; Barros, H. B.; Rocha, R. N. C.; Silva, R. R. da; Nascimento, I. R. do. Influência do desfolhamento artificial no rendimento de grãos e componentes de produção da soja [Glycine max (l.) Merrill]. Ciência e Agrotecnologia, v.26, p.1197-1203, 2002.
Peterson, R. K. D.; Higley, L. G.; Haile, L. G.; Barrigossi, A. F. Mexican bean beetle (Coleoptera: Coccinellidae) injury affects photosynthesis of Glycine max and Phaseolus vulgaris. Environmental Entomology, v.27, p.373-381, 1998. http://dx.doi. org/10.1093/ee/27.2.373
Pratissoli, D.; Schmildt E. R.; Amaral, J. A. T.; Schmildt, O. Níveis de desfolha artificial para similar perdas na produtividade do feijoeiro comum. Scientia Agraria Paranensis, v.11, p.68-76, 2012.
Pratissoli, D.; Schimldt, E. R.; Reis, E. F. dos; Thuler, R. T. Influência de desfolhas simuladas na produtividade e em outras características agronômicas do feijoeiro. Revista Ceres, v.48, p.17- 24, 2001.
Figure 5. Grain yield (kg ha-1) of soybean as a function of the defoliation levels for the cultivars ‘NA 4990RG’ (A) and
Radin, B.; Lisboa, B. B.; Matzenauer, R.; Barni, N. A. Avaliação da desfolha na produtividade do tomateiro. Pesquisa Agropecuária Gaúcha, v.14, p.27-31, 2008.
Rezende, J. A. M.; Miranda, M. A. C. de; Mascarenhas, H. A. A. Comportamento de cultivares de soja em relação à área foliar comida por lagartas das folhas. Bragantia, v.39, p.161-165, 1980. http://dx.doi.org/10.1590/S0006-87051980000100016
Ribeiro, A. L. de P.; Costa, E. C. Desfolhamento em estádios de desenvolvimento da soja, cultivar BR 16, no rendimento de grãos. Ciência Rural, v.30, p.767-771, 2000. http://dx.doi.org/10.1590/ S0103-84782000000500004
Ribeiro Júnior, J. I. Análises estatísticas no SAEG. Viçosa: Universidade Federal de Viçosa, 2001. 301p.
Riffel, C, T.; Garcia, M. S.; Santi, A. L.; Basso, C. J.; Flora, L. P. D.; Cherubin, M. R.; Eitelwein, M. T. Densidade amostral aplicada ao monitoramento georreferenciado de lagartas desfolhadoras na cultura da soja. Ciência Rural, v.42, p.2112-2119, 2012. http:// dx.doi.org/10.1590/S0103-84782012005000116