PROTOCOL OF FACTORS ASSESSMENT INFLUENTIAL IN SUSCEPTIBILITY
TO EROSION OF RIVER SLOPES
1Josita Soares Monteiro2*, Damáris Gonçalves Padilha3 and Jussara Cabral Cruz4
1 Received on 15.09.2015 accepted for publication on 16.09.2016.
2 Universidade Federal de Santa Maria, Doutorado em Engenharia Florestal, Santa Maria, RS - Brasil. E-mail: <jositamonteiro@gmail.com>.
³ Universidade Federal de Santa Maria, Departamento de Engenharia Rural, Santa Maria, RS - Brasil. E-mail: <damarispadilha@gmail.com>.
4 Universidade Federal de Santa Maria, Departamento de Engenharia Sanitária e Ambiental, Santa Maria, RS - Brasil. E-mail: <jussaracruz@gmail.com>.
*Corresponding author.
ABSTRACT – Actions to conserve rivers must be preceded by an environmental diagnosis, however, beyond the body of water, the adjacent atmosphere must also be characterized by ability of recognizing the human impacts and differentiate them of the natural variation of these ecosystems. This study aimed to develop a rapid assessment protocol (PAR), composed of seven parameters - vegetation, soil texture, part of the river,
slope inclination slope gradient, soil depth in slope, stroke width of water course, use and land cover -, assigning them weights 0-4, in order to assess the influence of their categories in susceptibility to erosion of the river slope. The PAR was applied in 40 sampling unities (UA) in the watershed of Arroio Val de Buia in Silveira Martins, RS. From the final result of the PAR it was created erosion susceptibility classes, "stable", "susceptible" and "instable". The t test showed significant differences between the evaluated units and the Hierarchical Cluster Analysis (AHA) distinguished two classes of UA, according to the categories of susceptibility to erosion resulting from PAR. The basic parameters that determined the groupings were: soil, soil depth in slope, vegetation, the stretch of water course and, land use and land cover. We conclude that the PAR is presented as a good rapid assessment tool river, similar to the studied stream, being useful to the environmental planning considering the regional characteristics.
Keywords: Water course; Stability of riverbanks; Environmental diagnosis.
PROTOCOLO DE AVALIAÇÃO DE FATORES INFLUENTES NA
SUSCETIBILIDADEÀ EROSÃO DE TALUDES FLUVIAIS
RESUMO – Ações voltadas à conservação de rios devem ser antecedidas por um diagnóstico ambiental, no entanto, além do corpo d'água, o ambiente adjacente também deve ser caracterizado, através de ferramentas capazes de reconhecer os impactos antropogênicos e diferenciá-los das variações naturais destes ecossistemas. Neste estudo objetivou-se desenvolver um Protocolo de Avaliação Rápida (PAR), composto por 7 parâmetros - vegetação, textura do solo, trecho do rio, inclinação do talude, profundidade do solo no talude, largura do curso d'água e, uso e cobertura da terra -, atribuindo a eles pesos de 0 a 4, no intuito de avaliar a influência de suas categorias na suscetibilidade à erosão de taludes fluviais. O PAR foi aplicado em 40 unidades amostrais (UAs) na microbacia do Arroio Val de Buia, em Silveira Martins, RS. A partir do resultado final do PAR criaram-se classes de suscetibilidade à erosão: "estável", "suscetível" e "instável". O teste t evidenciou diferenças significativas entre as unidades avaliadas e a Análise Hierárquica de Agrupamentos (AHA) distinguiu 2 classes de UAs, de acordo com as categorias de suscetibilidade à erosão resultantes do PAR. Os parâmetros fundamentais que determinaram os agrupamentos foram: solo, profundidade do solo no talude, vegetação, trecho do rio e uso e cobertura da terra. Conclui-se que o PAR se apresentou como uma boa ferramenta de avaliação rápida de rios semelhantes ao arroio estudado, sendo útil ao planejamento ambiental considerando às características regionais.
1. INTRODUCTION
In the search of environmental sustainability, several researchers have evaluated numerous methods for ordering the human activities. For this, it is necessary the institution of rules, which encompasses the rights and duties of the citizens.
However, this regulation should happen in a way that permits its practical application; one example is the demarcation of the areas of permanent protection, which, according to Ribeiro et al. (2005), is a complex process, which makes difficult its inspection and, consequently, the true fulfillment of legislation.
Besides that, the actions aimed to conservation and recovery of ecosystems must be preceded by environmental diagnosis, which characterizes and evaluates the conditions and peculiarities of the environment. In the case of rivers and streams ecosystems, Minatti-Ferreira; Beaumord (2004), emphasize that, besides the body of water, the adjacent environment must be characterized, through methodological tools capable to recognize the anthropogenic impacts and differentiate them from the natural variations of these ecosystems. Among these methodologies, the protocols of rapid assessment (PARs) are used because of their low cost and of the reduced loss of information quality (TELES, 2012).
The focus given to the rapid assessment of quality of habitats, according to Plafkin et al. (1989), in its majority, aims at a general description of the physical environment. These techniques, according to Hannaford; Barbour; Resh (1997), evaluate qualitatively several attributes of the habitats that are pointed out throughout a gradient from great to poor (or terrible). According to Cionek; Beaumord; Benedito (2011), the PARs consider the whole analysis of the lotic ecosystems, through an easy methodology and of rapid application that, by means of a visual inspection, catch the characteristics of the habitat to evaluate the environmental quality.
The use of a protocol to evaluate the habitat diversity in fragments of watersheds, according to Callisto et al. (2002), contributes to the preservation of natural resources and to evaluation of environmental impact of degraded areas, once that this demonstrates the influence that the human occupation causes in diversity and in quality of the natural environment.
The protocols are instruments of viable and effective environmental monitoring that can be adopted in environmental management, mainly by the public entities, once that it is known that the financial resources target to monitoring and environmental assessment are scarce (RODRIGUES, 2008). The author still highlights that, “to make it possible the application of certain PAR in different regions adaptations are necessary in the composition of the same, because the characteristics of the bodies of water change in function of factors like the climate, relief, geology and vegetation”.
Nevertheless, in Brazil it is still incipient the use of PARs and, when applied, it is more related to the study of biological quality of the aquatic environment, thus the studies focused in the understanding and in conservation of physical environment properly said are scarce, as for example, the investigation of the influential factors in the instability of fluvial slopes. Therefore, this study aims to develop a protocol of rapid assessment (PAR) to the analysis of susceptibility to the erosion of fluvial slopes, having as basis the observation of biotic, abiotic and anthropic parameters, from the reality found in Arroio Val de Buia – Silveira Martins – RS.
2. MATERIALS AND METHODS 2.1 Study Area
The watershed of Arroio Val de Buia is located between the geographical coordinates 29°38’00" and 29°40’37" of South latitude and 53°34’16"and 53º34’00" of West longitude, with total area of 1377.72 ha, in the municipality of Silveira Martins - RS. This place was chosen because it has different characteristics of the environment along the watercourse, which allowed the identification of distinct physiognomy as, covered areas of vegetation since the adjacent slope until the bank of the course in areas without any kind of protection; besides the facility of access to the places of analysis.
2.2 Elaboration of PAR of susceptibility to erosion of fluvial slopes
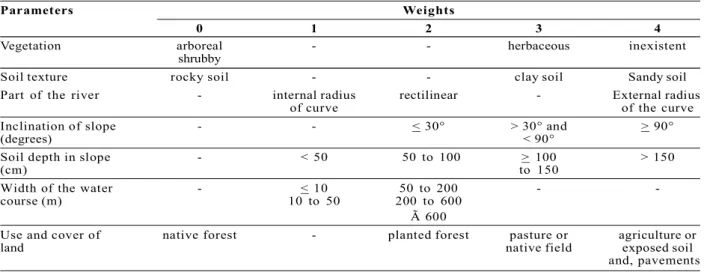
which were selected within the ones that were judged influential upon the susceptibility of interfering in erodibility of a fluvial slope, according to what is described as the following: a) vegetation: inexistent, arboreal (height > 3 m), shrubby (between 3 e 1 m) and, herbaceous (under of 1 m); soil texture in slope: rocky soil, clay soil and sandy soil; c) part of the river: rectilinear, in the external radius or in the internal radius of a curve; d) inclination of the slope (degrees): < 30°, > 30° and < 90°, and, > 90° (the slopes “undermined” were included); e) soil depth in slope: < 50cm, 50 to 100 cm, > 100 to 150 cm and, > 150 cm, defined from the table elaborated by Kampf et al. (2008); f) width of water course (m): obtained in straight line between the slopes, which has as reference the width of the regular river bed, according to Federal Law number 12.651/2012 (BRASIL, 2012); g) use and cover of the land: agriculture and exposed soil, pasture and native field, planted forest and pavements (constructed area in the country side area and urban area), and this parameter was observed in the surrounding areas to the sampling units (UAs) and, always when it was necessary, in the own unit, when the “vegetation” parameter was “inexistent”.
For the parameters “vegetation”, “texture of soil”, “part of the river”, “inclination of the slope” and “soil depth in slope” had their categories defined, we used as criteria that 50% or more of the UA should present a given category. When we did not find more than 50% of a category for a given parameter, we observed that the occupied percentage for all the present categories, we multiplied the value of the weight of each category by the respective percentage occupied in the UA and we performed the sum, which corresponded to the weight of the parameter analyzed in that unit.
To help in this definition of weights, we developed a questionnaire described by
Monteiro (2014), which was applied to 48 researchers, whose answers (weights) related themselves to the influence in the susceptibility to erosion of fluvial slopes of each category of the listed parameters, according to the following:
Weight 0 – not influential: the category evaluated does not increase and does not decrease the susceptibility to erosion;
Weight 1 – weak influence: the category turned weak the susceptibility to erosion;
Weight 2 – moderate influence: the category turns moderate the susceptibility to erosion;
Weight 3 – strong influence: the category turns strong the susceptibility to erosion;
Weight 4 - preponderant influence: the category is the main one to be observed, that is, in any situation it will influence on the erosion.
The PAR with its individual weights of each category of its 7 parameters is showed in Table 1. 2.3 Application of PAR
The application of PAR was done in UA, with dimensions of 30 x 30 m, and 30 meters were measured from the bank of the water course in direction to the slope and 30 meters along the bank of the course. We adopted this dimension based on the minimum width of permanent preserved area (APP) as seen in Federal Law number 12.651/2012 for water courses. In a same sampling point (PA) two UAs were placed, one unit on the left bank (E) and the other on the right bank (D), distributed in a way for observing distinct characteristics along the water course. We observed 20 PAs, totalizing 40 UAs, which received denomination in function of the PA and of the bank where they were. The UAs 1 to 20 refer to the ones located in the right bank of the river, and they are denominated, for example, P1D, which corresponds to UA 1, located in the Pont 1 of the right bank of the water course and, the UAs 21 to 40 refer to the ones located in the left bank of the river, where the UA 21, for example, was denominated P1E, since it corresponds to the unit located in the Point 1 located in the left bank of the water course.
2.4 Statistical analysis of data
We verified the differences and/or similarities among the UAs studied with the application of the Student
t Test, in the software ASSISTAT 7.7 beta and from the multivariate analysis using the Hierarchical Cluster Analysis (AHA), through the similarity calculation among the UAs, from the Euclidean distance between them, through the software SPSS Statistics® 17.0.
3. RESULTS
The sampling points (PAs) distributed themselves in three distinct portions of watershed, a reason why it was possible to attribute for the parameters vegetation, soil, soil depth in slope, width of water course and use of the soil, identical weights for the units classified as “stable”, presenting, however, small variations for the parameters part of the course and inclination of slope, which are not statistically significant.
The general view of the watershed physiognomy and the distribution of the PAs along Arroio Val de Buia can be observed in Figure 1.
The points 1 to 8 are located next to the headwaters of the watershed, characterized by presenting areas with agricultural and livestock activities, banks of water courses occupied by narrow strips of arboreal/shrubby vegetation and, in great part, by herbaceous vegetation. The points 9 to 14 were found in the intermediate portion of watershed, characterized by the occurrence of native forest beyond the limits of the APPs, especially
in the area of rough relief, because of the difficulty of substitution of the native vegetation by silvicultural and pastoral activities.
Meanwhile, the points 15 to 20 were situated in the downstream portion, with condition of mild relief, which propitiates the agricultural cultivation and the pastoral activities, with predominance of herbaceous vegetation since the adjacent slope until the fluvial slope. The units located in the superior portion of the watershed, with exception of the UAs P4D and P4E considered “instable”, in function of presenting the parameter “use and cover of land” in the category “agriculture”, were found in “stable” or “susceptible”
Parameters Weights
0 1 2 3 4
Vegetation arboreal - - herbaceous inexistent
shrubby
Soil texture rocky soil - - clay soil Sandy soil
Part of the river - internal radius rectilinear - External radius
of curve of the curve
Inclination of slope - - < 30° > 30° and > 90°
(degrees) < 90°
Soil depth in slope - < 50 50 to 100 > 100 > 150
(cm) to 150
Width of the water - < 10 50 to 200 -
-course (m) 10 to 50 200 to 600
à 600
Use and cover of native forest - planted forest pasture or agriculture or
land native field exposed soil
and, pavements
Table 1 – Categories of the parameters of PAR, and their individual weights.
Tabela 1 – Categorias dos parâmetros do PAR, e seus pesos individuais.
Figure 1 – Chart image of the watershed of study with of the points of application of the rapid assessment protocol.
conditions. Also in the intermediate part of the water course we observe the almost totality of UA in “stable” condition.
From the results of the t test, applied to the level of 5% of error probability, we could determine that there were significant differences among the averages
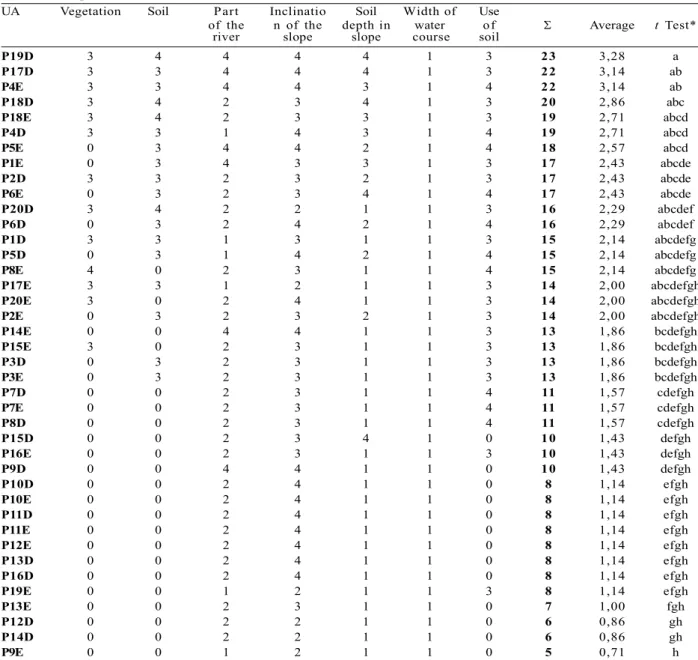
of the UAs. These differences were attributed to the categories of the evaluated parameters in each UA. In Table 2, we observed the weights of the categories of the parameters of each UAs, the sum of the weights, the class of susceptibility to erosion and, the Student
t test.
UA Vegetation Soil Part Inclinatio Soil Width of Use
of the n of the depth in water of Average t Test*
river slope slope course soil
P19D 3 4 4 4 4 1 3 23 3,28 a
P17D 3 3 4 4 4 1 3 22 3,14 ab
P4E 3 3 4 4 3 1 4 22 3,14 ab
P18D 3 4 2 3 4 1 3 20 2,86 abc
P18E 3 4 2 3 3 1 3 19 2,71 abcd
P4D 3 3 1 4 3 1 4 19 2,71 abcd
P5E 0 3 4 4 2 1 4 18 2,57 abcd
P1E 0 3 4 3 3 1 3 17 2,43 abcde
P2D 3 3 2 3 2 1 3 17 2,43 abcde
P6E 0 3 2 3 4 1 4 17 2,43 abcde
P20D 3 4 2 2 1 1 3 16 2,29 abcdef
P6D 0 3 2 4 2 1 4 16 2,29 abcdef
P1D 3 3 1 3 1 1 3 15 2,14 abcdefg
P5D 0 3 1 4 2 1 4 15 2,14 abcdefg
P8E 4 0 2 3 1 1 4 15 2,14 abcdefg
P17E 3 3 1 2 1 1 3 14 2,00 abcdefgh
P20E 3 0 2 4 1 1 3 14 2,00 abcdefgh
P2E 0 3 2 3 2 1 3 14 2,00 abcdefgh
P14E 0 0 4 4 1 1 3 13 1,86 bcdefgh
P15E 3 0 2 3 1 1 3 13 1,86 bcdefgh
P3D 0 3 2 3 1 1 3 13 1,86 bcdefgh
P3E 0 3 2 3 1 1 3 13 1,86 bcdefgh
P7D 0 0 2 3 1 1 4 11 1,57 cdefgh
P7E 0 0 2 3 1 1 4 11 1,57 cdefgh
P8D 0 0 2 3 1 1 4 11 1,57 cdefgh
P15D 0 0 2 3 4 1 0 10 1,43 defgh
P16E 0 0 2 3 1 1 3 10 1,43 defgh
P9D 0 0 4 4 1 1 0 10 1,43 defgh
P10D 0 0 2 4 1 1 0 8 1,14 efgh
P10E 0 0 2 4 1 1 0 8 1,14 efgh
P11D 0 0 2 4 1 1 0 8 1,14 efgh
P11E 0 0 2 4 1 1 0 8 1,14 efgh
P12E 0 0 2 4 1 1 0 8 1,14 efgh
P13D 0 0 2 4 1 1 0 8 1,14 efgh
P16D 0 0 2 4 1 1 0 8 1,14 efgh
P19E 0 0 1 2 1 1 3 8 1,14 efgh
P13E 0 0 2 3 1 1 0 7 1,00 fgh
P12D 0 0 2 2 1 1 0 6 0,86 gh
P14D 0 0 2 2 1 1 0 6 0,86 gh
P9E 0 0 1 2 1 1 0 5 0,71 h
*Averages followed by the same letter do not differ statistically among themselves, Test, t, 5% of probability. Class: instable; Class: susceptible; Class: stable.
Table 2 – Weights of the categories of parameters of sampling unities, and t Test t of rapid assessment protocol results.
The simultaneous observation of all the UAs in relation to the t test allowed us to verify that the ones classified as “instable” and with average above 3, differed statistically of all the UAs considered “stable”. Nevertheless, the averages of the UAs classified as “susceptible” do not evinced significant differences in relation to the averages of the units considered “instable” and to the ones classified as “stable” either. The t test analysis also allowed us to observe the occurrence of statistical differences inclusive among the UAs located in the same point of observation, however, in opposite banks, as the case of unit P19D, classified as “instable”, in relation to P19E, classified as “stable” (Figure 2 a, b). The fact is explained because P19E is located in the internal radius of a curve of water course and presents a predominance of shrubby vegetation, with deposition of the eroded material to the upstream of the course. Yet P19D is located in the external radius of the curve, with sandy soil, soil depth in slope greater than 1.50 m and, covered by herbaceous vegetation.
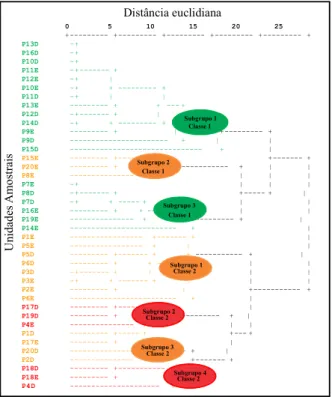
The degree of similarity among the UAs varied from 0 to 1 when the weights of the categories of the parameters presented in each unit were identical. When analyzing the results of AHA we can observe the cluster of two big classes, united by a greater Euclidean distance (or distance of combination) (Figure 3).
The first class gathered three sub-groups, and two were formed by UAs classified as “stable” and the other as “susceptible”, corresponding to 55% of the studied UAs. In the second class we observed
the cluster of four sub-groups, two formed by UAs classified as “susceptible” and two as “instable”, equivalent to 45% of the studied UAs (Figure 3)
Generally, the fundamental parameters that lead to the identification of two classes of UAs cluster,
Figure 2 – Sampling unities P19E (a) and P19D (b), located in the downstream portion of the watershed of Arroio Val Buia.
Figura 2 – Unidades amostrais P19E (a) e P19D (b), localizadas na porção jusante da microbacia do Arroio Val de Buia.
A
B
Figure 3 – Hierarchical Cluster Analysis, with the similarity between the sampling unities.
Figura 3 – Análise Hierárquica de Agrupamentos, com a similaridade entre as unidades amostrais.
0 5 10 15 20 25
+--- +--- +--- +--- +--- +
P13D -+
P16D -+
P10D -+
P11E -+--- +
P12E -+ |
P10E -+ + --- +
P11D -+ | |
P13E --- + + --- +
P12D -+--- + | |
P14D -+ + --- + + --- +
P9E --- + | +--- +
P9D --- + | |
P15D --- + |
P15E --- +--- + +--- +
P20E --- + +--- + | |
P8E --- + | | |
P7E -+ | | |
P8D -+--- + +--- + |
P7D -+ + --- + | |
P16E --- + + --- + | |
P19E --- + + --- + |
P14E --- + |
P1E --- +--- + |
P5E --- + | |
P5D --- +--- + +--- + |
P6D --- + + --- + | |
P3D -+--- + | | | |
P3E -+ + --- + | | |
P2E --- + | +--- +
P6E --- + |
P17D --- +--- + | P19D --- + +--- + | P4E --- + | |
P1D --- +--- + +--- +
P17E --- + | |
P20D --- +--- + |
P2D --- + +--- +
P18D --- +--- + | P18E --- + +--- +
P4D --- +
Distância euclidiana
Subgrupo 1 Classe 1
Subgrupo 4 Classe 2 Subgrupo 3
Classe 2 Subgrupo 2
Classe 2 Subgrupo 1
Classe 2 Subgrupo 3 Classe 1 Subgrupo 2
Classe 1
U
ni
da
de
s A
m
os
tra
through the AHA, in order of importance, were: soil, soil depth in slope, vegetation, part of the river and use of soil, according to what can be determined with the assessment of the categories (weights) of each parameter evaluated in all the UAs that compound each class (Table 2)
The parameters inclination of the slope and width of the water course did not show great variation of one UA to another. Thus, we cannot identify the contribution of these parameters in the UAs cluster. In relation to the width of the water course, although there was variation along the same, this cannot be distinguished, since all the widths lower than 10 m were included in the same category of the protocol, and in the field we observed widths of 1 m to 10 m. In short, the different UAs formed 2 distinct classes in AHA corresponding to 22 UAs in class 1 and 18 units in class 2, discriminated in function of the weights of the categories of the parameters.
4. DISCUSSION
The difficulty of segregation of the UAs averages of intermediate values did not favored statistically the distinction of “susceptible” class, through the t test, of the other classes of susceptibility to erosion. This fact can be explained by the small amplitude of the values of the weights attributed to the categories of the evaluated parameters (0 to 4).
A comparative analysis of the amplitude variation of the weights can be performed with the PAR proposed by Cionek; Beaumord; Benedito (2011), which contemplated nine parameters, in a weight scale that varied from 0 to 20. For each one, a gradient of conservation was established, to which were attributed grades, from 0 to 5 for the category “terrible”, from 6 to 10 to “regular”, from 11 to 15 to “good” and, finally, from 16 to 20 to the category “great”. At the end, the sum of all these grades indicated a condition of conservation of the studied environment, as: great (136 to 180), good (91 to 135), regular (46 to 90) and terrible (0 to 45), values in superior scale to the ones established for the present study.
In the observations in field, we determined in some PAs of the watershed the existence of conflicts of use and occupation of land in areas legally indicated as permanent preservation. These findings corroborate with Miola (2013), who mentions that in the region,
to downstream of the watersheds, the riparian forests were gradually suppressed for the cultivation of tobacco plantations and vegetables and irrigated rice in the flood plains. As a consequence of the lack of riparian forest, and the occurrence of extreme rains, there is the collapse of the banks of the arroyos and frequent overflow during flood seasons.
There were, however, UAs located in the intermediate portion of the watershed, area characterized by rough relief and formations of native forest. In these places the dense woods form the Decidual Seasonal Forest and Semidecidual of Hillside and they are composed by several species of trees of medium and great size, characteristics also described by Miola (2013).
Meanwhile, the great majority of UAs located in the downstream portion of watershed presented characteristics influenced by the anthropic use of this part. Pereira et al. (2012) highlights that, the inadequate use of soil for agricultural and livestock activities reduces the protection of riparian forest, which also brings the increasing of the erosive process of banks, provoking sedimentation and alterations in the vertical profile and in the river rail.
Therefore, the observation of the distribution of UAs along the longitudinal profile of the water course and the characteristics of its different parts favored the evidences of distinctions of classes of susceptibility to erosion of fluvial slopes in units located in superior, intermediate and downstream portions of the watershed. These conditions match with the study by Vargas; Ferreira Júnior (2012), who observed the preservation level of the parts of two hydrographic basins, determining that the points evaluated as natural were distributed in the headwaters, in intermediate parts or with waterfalls of the water courses. Standing out, also, the affirmation by Pereira et al. (2012) that the places with greater restriction in relation to the occupation and soil use presented a better quality of the water courses.
blocks of land that fall in the river canal, responsible for the sedimentation and by the loss of productive lands, associated to the lack of an attitude of preservation by the people living along the river, constituting in constant threat for biodiversity of riparian ecosystems. In relation to the use of AHA for differentiation among the UAs, this was considered adequated for the analysis of results of this study, according to the data by Pereira et al. (2012), who used physical, chemical, microbiologic results and the visual aspects of integrity of landscape to perform a cluster analysis, from which they could observe in the generated dendrogram the existence of a similarity of 60% between the studied areas – Conservation Zone of Wildlife and the Agricultural and Livestock Use Zone.
5. CONCLUSIONS
We can consider the relevance of the established parameters in the Rapid Assessment Protocol (PAR) and of its attributed weights, since the results of PAR allowed to identify distinction among the UAs, emphasizing the existence of differences among them in relation to the susceptibility to erosion of fluvial slopes.
As a general rule, we observe that the models of PAR do not constitute themselves as defined models, admitting adjustments that will be able to enrich them according to objectives, area size and diversity of the environment to be studied. Therefore, the PAR proposed in this study can be applied in another region since that adaptations are made in the composition of the same in function of peculiarities of the place to be evaluated. Thus, we can suggest, among the adequacies, the alteration of the amplitude of the weights in a way that we can better distinguish the intermediate values (“susceptible” category).
Besides that, the longitudinal profile analysis of the water course associated with the application of PAR, contributes to the comprehension of the parameters to be considered in the evaluation of susceptibility to erosion of fluvial slopes.
We highlight, thus, the importance of this methodology as a low cost tool, capable of providing good indicatives of the susceptibility to erosion of fluvial slopes. It can be useful to the environmental planning, because of the possibility of hierarchisation of priority parts for application of protective and mitigating
measures and, actions of recovery of degraded areas, considering the regional characteristics, furthermore, when it is applied throughout time, it can constitute itself as an indicator of qualitative changes in the local environment.
6. REFERENCES
BARBOUR, M.T.; GERRITSEN, J.; SNYDER, B. D.; STRIBLING, J. B. Rapid bioassessment protocols for use in streams and wadeable rivers: periphyton, benthic macroinvertebrates and fish. 2nd. ed.
Washington, DC: EPA 841-B-99-002. U.S. Environmental Protection Agency; Office of Water, 1999. 344p.
BRASIL (2012). Lei Federal Nº 12.651 (Código Florestal Brasileiro). Disponível em: http://
www.planalto.gov.br/ccivil_03/_ato2011-2014/2012/ lei/l12651.htm. Acesso em: 07/02/2014.
CALLISTO, M.; FERREIRA, W. R.; MORENO, P.; GOULART, M.; PETRUCIO, M. Aplicação de um protocolo de avaliação rápida da diversidade de habitats em atividades de ensino e pesquisa (MG-RJ). Acta Limnologica, Brasiliensis, v.14, n.1, 2002. p.91-98.
CIONEK, V.M.; BEAUMORD, A.C.; BENEDITO, E. Protocolo e avaliação rápida do
ambiente para riachos inseridos na região do Arenito Caiuá– Noroeste do Paraná. Maringá: EDUEM, 2011. 47p. (Coleção Fundamentum, 72)
HANNAFORD, M.J.; BARBOUR, M.T.; RESH, V.V.H. Training reduces observer variability in visual-based assessments of stream habitat. Journal North American Benthol. Society, v.16, n.4, p.853-860, 1997.
KÄMPF, N.; GIASSON, E.; INDA JUNIOR, A. V.; NASCIMENTO, P. C. DO; RODRIGUES, A. L. M.; ANGHINONI, M. DA C. M.; FERRARO, L. W.; BINOTTO, R. B.; SANBERG, J. R. D. Metodologia para classificação de solos quanto à resistência a impactos ambientais decorrentes da disposição final de resíduos. Fepam em Revista, v.2, n.1, p.11-17, 2008.
PEDROTTI, A.; RIBEIRO, G. T. Riparian
vegetation affected by bank erosion in the lower São Francisco river, Northeastern Brazil. Revista Árvore, v.29, n.2, p.327-336, 2005.
MINATTI-FERREIRA, D.D.; BEAUMORD, A.C. Avaliação rápida de integridade ambiental das sub-bacias do rio Itajaí-Mirim no Município de Brusque, SC. Health and Environmental Journal, v.5, n.2, p.21-27, 2004.
MIOLA, A.C. Planejamento para
comunidades rurais em situações de enchentes. 2013. 216f. Tese (Doutorado em Engenharia Agrícola) - Universidade Federal de Santa Maria, Santa Maria, 2013.
MONTEIRO, J.S. Indicadores de fragilidade à erosão no apoio à definição de áreas de preservação permanente em rios. 2014. 172f. Tese (Doutorado em Engenharia Florestal) -Universidade Federal de Santa Maria, Santa Maria, 2014.
PEREIRA, P. S.; FERNANDES, L. A. C.;
OLIVEIRA, J. L. M.; BAPTISTA, D. F. Avaliação da integridade ecológica de rios em áreas do zoneamento ecológico econômico do complexo hidrográfico Guapiaçu-Macacu, RJ, Brasil. Ambi-Agua, v.7, n.1, p.157-168, 2012.
PLAFKIN, J. L.; BARBOUR, M. T.; PORTER, K. D.; GROSS; S. K.; HUGHES, R. M.Rapid
bioassessment protocols for use in streams and rivers: benthic
macroinvertebrates and fish. EPA/440/4-89/001. Washington, DC.: Office of Water Regulations and Standards; US Environmental Protection Agency, 1989.
RIBEIRO, C. A. A. S.; SOARES, V. P.; OLIVEIRA, A. M. S.; GLERIANI, J. M. O desafio da
delimitação de áreas de preservação permanente. Revista Árvore, v.29, n.2, p.203-212, 2005.
RODRIGUES, A.S.L. Adequação de um protocolo de avaliação rápida para o monitoramento e avaliação ambiental de cursos d’água inseridos em campos rupestres. 2008. 118f. Dissertação (Mestrado em Evolução Crustal e Recursos Naturais) – Programa de Pós-graduação em Evolução Crustal e Recursos Naturais. Universidade Federal de Ouro Preto, 2008.
TELES, H.F. Bioindicadores e parâmetros abióticos dos recursos hídricos da Serra de Itabaiana – Sergipe. 2012. 107f. Dissertação (Mestrado em Desenvolvimento e Meio Ambiente) – Universidade Federal de Sergipe, 2012.
VARGAS, J.R.A.; FERREIRA JÚNIOR, P.D.
Aplicação de um protocolo de avaliação rápida na caracterização da qualidade ambiental de duas microbacias do Rio Guandu, Afonso Cláudio, ES. Revista Brasileira de Recursos