ABSTRACT: Banana is one of the most consumed fruits in Brazil and an important source of minerals, vitamins and carbohydrates for human diet. The characterization of banana superior genotypes allows identifying those with nutritional quality for cultivation and to integrate genetic improvement programs. However, identification and quantification of the provitamin carotenoids are hampered by the instruments and reagents cost for chemical analyzes, and it may become unworkable if the number of samples to be analyzed is high. Thus, the objective was to verify the potential of indirect phenotyping of the vitamin A content in banana through artificial neural networks (ANNs) using colorimetric data. Fifteen banana cultivars with four replications were evaluated, totaling 60 samples.
BASIC AREA -
Article
High-efficiency phenotyping for vitamin A in
banana using artificial neural networks and
colorimetric data
César Fernandes Aquino1*, Luiz Carlos Chamhum Salomão1, Alcinei Mistico Azevedo2
1. Universidade Federal de Viçosa - Departamento de Fitotecnia - Viçosa (MG), Brazil.
2. Universidade Federal de Minas Gerais - Instituto de Ciências Agrárias - Montes Claros (MG), Brazil.
*Corresponding author: cesarfernandesaquino@yahoo.com.br
Received: Oct. 2, 2015 – Accepted: Dec. 17, 2015
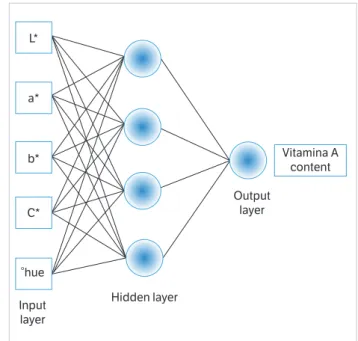
For each sample, colorimetric data were obtained and the vitamin A content was estimated in the ripe banana pulp. For the prediction of the vitamin A content by colorimetric data, multilayer perceptron ANNs were used. Ten network architectures were tested with a single hidden layer. The network selected by the best fit (least mean square error) had four neurons in the hidden layer, enabling high efficiency in prediction of vitamin A (r2 = 0.98). The colorimetric parameters a* and Hue angle were the most important in this study. High-scale indirect phenotyping of vitamin A by ANNs on banana pulp is possible and feasible.
INTRODUCTION
The banana tree (Musa spp.) is one of the most
cultivated fruit trees in tropical and subtropical countries. In Brazil, the production of bananas and plantains was 6.89 million tons in 485,000 hectares of harvested area in 2013 (FAO 2015). Due to its good organoleptic properties and low cost, bananas are consumed by people across the social spectrum, representing a good source of minerals, vitamins and carbohydrates, with a high potential as a functional and nutraceutical food (Amorim et al. 2011; Aquino et al. 2014). The carotenoid contents, such as lutein, β-carotene, and α-carotene, which play an important role in the operation of the human body, stand out among the functional and nutraceutical properties. Moreover, β-carotene and α-carotene are converted to vitamin A in the human body (Davey et al. 2009).
Vitamin A deficiency is considered a serious nutritional disease and is the most common cause of preventable blindness in the world (Santos et al. 2010). One of the sustainable ways to mitigate the problem of vitamin A deficiency is to encourage the consumption of natural foods rich in provitamin carotenoids, such as fruits and vegetables (Ekesa et al. 2012). Thus, the prospection of banana access into collections is important to breeding programs, focusing on the development of cultivars with better nutraceutical properties (Amorim et al. 2011). However, the quantification of vitamin A content is expensive and it may become unfeasible if the number of samples to be analyzed is high.
The indirect estimate of the carotenoid content and, consequently, the provitamin one is possible by using colorimetric data, which are easily measured in the pulp or peel of the fruit using the colorimeter. This analytical approach has been used in tomato (Carvalho et al. 2005; Fernandez-Ruiz et al. 2010), pumpkin (Seroczyńska et al. 2006; Itle and Kabelka 2009; Doka et al. 2013), and potato (Lu et al. 2001). The indirect estimate of the carotenoid content can reduce the time, labor and financial resources in the evaluation stages.
Because artificial neural networks (ANNs) are efficient to model complex problems (Barbosa et al. 2011; Nascimento et al. 2013; Azevedo et al. 2015; Brasileiro et al. 2015), they may also be effective in the indirect phenotyping of vitamin A content by using colorimetric data. The ANNs are computational models of the human
brain that can recognize patterns and regularities of the data, becoming an alternative as universal approximator of complex functions (Gianola et al. 2011). Consequently, they may perform better than conventional statistical models, with the advantage of being non-parametric, do not require detailed information about the physical processes of the system to be modeled, and tolerate data loss (Azevedo et al. 2015).
Thus, the objective of the present research was to verify the phenotyping potential of the vitamin A content in banana, using ANNs and colorimetric data.
MATERIAL AND METHODS
Banana bunches of the cultivars Ouro (AA), Nanica (AAA), Nanicão (AAA), Caru-Verde (AAA), Caru-Roxa (AAA), Caipira (AAA), Prata (AAB), Prata-Anã (AAB), Maçã (AAB), Mysore (AAB), Pacovan (AAB), Marmelo (ABB), Prata-Graúda (AAAB) and Caju (unidentified genomic group), as well as Terrinha plantain (AAB), were harvested from an experimental orchard in the Universidade Federal de Viçosa, Viçosa, Minas Gerais.
The banana bunches were harvested when the first signs of yellow color appeared in the fruits of each cultivar. The bananas were removed from the second, third and fourth tiers hands, and the damaged, diseased and malformed ones were discarded. Subsequently, they
were immersed in ethephon solution (1.2 g∙L–1) for 8 min
to even the ripening. After drying in air for 15 min, they
were dipped in Prochloraz fungicide solution (0.49 g∙L–1)
for 5 min. Then, the fruits remained at room temperature until the complete ripening.
Carotenoids were extracted according to the method proposed by Rodríguez-Amaya (2001) with modifications. A 5-g sample of plant material was weighed; 60 mL of 100% acetone (which was cooled) were added. Then, the material was processed in an Ultra-Turrax homogenizer (model T18 Basic) for 6 min. Subsequently, the extract was vacuum-filtered through Buchner funnel using filter paper; then it was transferred to a separatory funnel containing 20 mL of cooled petroleum ether and washed with distilled water to remove the acetone completely. Anhydrous sodium sulfate p.a. was added to remove the residual water contained in the extract.
The carotenoids were analyzed by high-performance liquid chromatography HPLC-DAD, following the chromatographic conditions adjusted by Pinheiro-Sant’ana et al. (1998). The Shimadzu chromatograph was equipped with a high-pressure pump, LC-10AT VP model, with SIL-10AF automatic injector, and UV-visible diode array detector, SPD-M10A model, controlled by the Multi System software, Class VP 6.12. We employed a chromatographic column Phenomenex Gemini RP-18, 250 × 4.6 mm, with 5 μm internal particle, equipped with Phenomenex ODS guard column (C18), 4 × 3 mm, and detection at 450 nm. The mobile phase consisted of methanol:ethyl acetate:acetonitrile (80:10:10, v/v/v),
HPLC grade, 2.0 mL∙min–1 flow rate, and 13 min run time.
The peaks of interest were identified by comparing the retention times of the standard and samples and, especially, through the absorption spectrum. The quantification was performed using the standard curves of concentration versus area, and the results are expressed in μg per 100 g
of each plant, on a wet basis. The vitamin A content was obtained according to the recommendations of the Institute of Medicine (2001). The carotenoids (β-carotene and α-carotene) were quantified, and the steps were performed, being protected from direct light to prevent degradation of the material.
Thus, the colorimetric parameters (L*, a*, b*, C* and °hue) and vitamin A content for 60 samples (four replicates of 15 cultivars) were obtained. These data were analyzed in the R software (R Development Core Team 2012) by ANNs. For the best efficiency in the training of networks, both input (color data) and output (vitamin A content) data were normalized to the range between 0 and 1 by the “normalize Data” function of the RSNNS package (Bergmeir and Benitez 2012).
The analysis by ANNs showed that 70% of the data (42 samples) were used to train the network and 30%, for validation (18 samples). The samples that formed the training and validation fractions were randomly selected. The Multi-Layer-Perceptron (MLP) networks were used for the analysis and developed using the “mlp” function of the RSNNS package with back propagation algorithm and learning rate of 0.1. The maximum number of training/epochs was 1,000, the activation function for the hidden layer was the logistics and the output layer was the linear. Ten network architectures were tested to determine a trained network with good fit, with 1, 2, 3, …, 9 and 10 neurons in the hidden layer. Considering that, at the beginning of the training, the free parameters were randomly generated and that these initial values can influence the final result of the training (Soares et al. 2014), each ANN architecture was trained 1,000 times. The network with the best fit was selected using the mean squared error (MSE) for the validation sample.
For the best-selected network, the diagram of the network topology was obtained using “plotnet” function (Neural Net Tools package). In addition, the relative importance of the input traits was obtained using the Garson method (1991) and the “garson” function (Neural Net Tools package). To determine the efficiency of network training, we performed the regression analysis of vitamin A levels predicted and observed for the training and validation samples. The multiple comparison test by bootstrapping (Ramos and Ferreira 2009) was used to compare the best network architectures, and the BCa bootstrap test, to obtain the 95% confidence intervals. The vitamin A level estimates, observed and predicted by the ANNs, were compared by the bootstrap paired test. In all analyses using the bootstrap technique, 10,000 simulations were used.
RESULTS AND DISCUSSION
variation (103.527%). The red/green opponent colors are represented on the a* axis, where the positive values are red; the negative ones are green; and 0 value is neutral (Trevisan et al. 2008). On the other hand, the L* parameter displayed the lowest variability, with coefficient of variation of 6.191%. This parameter relates to light, ranging from 0 (perfect black) to 100 (perfect white).
For the ten tested network architectures, the smallest MSEs were observed for the lower numbers of neurons in the hidden layer (Figure 1a). Small MSE estimates indicate that the values, actual and predicted by the ANN, are close, or, in other words, indicate great efficiency of the networks. The multiple comparison test by bootstrapping (Ramos and Ferreira 2009) showed that, when using only one neuron in the hidden layer, the average network efficiency was better. A similar conclusion was evident
when analyzing the coefficient of determination (r2)
in Figure 1b in which smaller numbers of neurons in the hidden layer also yielded better results. The use of non-parametric tests such as the bootstrap for multiple comparisons (Ramos and Ferreira 2009) is feasible in studies similar to this, when, in general, the MSE and
r2 do not follow a normal distribution.
Generally, the increased number of neurons per layer does not ensure the best network performance. Similar results were found by Soares et al. (2014) and Azevedo et al. (2015). An explanation for this is that the increased number of neurons in the network may lead to overfitting, which occurs when the network training process stores the data in the training sample and does not identify the associations between the data in the
input and output layers (Silva et al. 2010). In this case, a good fit is observed for the sample training while a very poor one is found for the validation sample. Therefore,
Parameters L* a* b* C* °hue Vitamin A
Maximum 82.470 12.600 43.250 42.450 95.620 141.968
Mean 71.029 3.512 33.443 33.630 84.295 21.457
Minimum 62.750 −2.080 21.200 21.300 70.300 1.330
CV (%) 6.191 103.527 13.028 13.117 6.995 149.144
Pearson correlation
L* 1.000 −0.456 −0.585 −0.550 0.492 −0.106
a* −0.456 1.000 0.677 0.711 −0.948 0.821
b* −0.585 0.677 1.000 0.971 −0.678 0.403
C* −0.550 0.711 0.971 1.000 −0.712 0.486
°hue 0.492 −0.948 −0.678 −0.712 1.000 −0.765
Vitamin A −0.106 0.821 0.403 0.486 −0.765 1.000
Table 1. Descriptive analysis and Pearson correlation between colorimetric parameters and vitamin A level in ripe banana pulp.
Figure 1. Mean square error (a) and coefficient of determination (b) for different numbers of neurons in the hidden layer.
*Bars followed by the same letter do not differ significantly by the multiple comparisons test with bootstrap at a significance level of 5% (Ramos and Ferreira 2009) with 10,000 simulations. The deviations refer to the 95% confidence intervals obtained by bootstrap BCa with 10,000 simulations.
e d
c c
b b
a a
a a
0.008 0.010 0.012 0.014 0.016
Mean square error
a
b
c c
d d d
e e e
0.86
1 2 3 4 5 6 7 8 9 10
0.88 0.89 0.91 0.92
Coefficient of determination
Number of neurons in the hidden layer
1 2 3 4 5 6 7 8 9 10
(a)
network efficiency should always be checked with a sample whose data were not used in the training process, which is the validation sample.
The evaluation of the relative importance of the explanatory variables by Garson method (1991) showed that the parameters a* and °hue were the most important (Figure 2), with relative contribution of 28.87 and 20.08%, respectively. This is important, especially when it becomes advantageous to exclude traits to reduce the computational effort (Paliwal and Kumar 2011). A major contribution is expected for these traits due to the highest correlation estimates with vitamin A (Table 1), 0.821 and −0.765 for a* and °hue, respectively.
Although there was on average a good fit with only one neuron in the hidden layer (Figure 1a,b), the best fit was observed when using four neurons in the hidden layer (Figure 3). This can be explained by the high number of trainings (1,000) for each network architecture. The use of a large number of trainings for each network architecture is suggested, since, at the beginning of the training, the synaptic weights are randomly generated (Soares et al. 2014) and, therefore, at each training, different results are found for the same architecture.
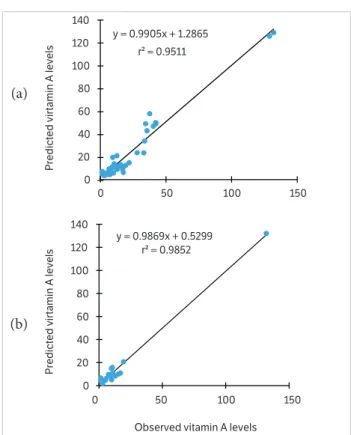
For the best-fitted network, optimum fittings were
found, with r2 = 95.11% for the training sample (Figure 4a)
and 98.50% for the validation sample (Figure 4b). The
high r2 value estimated for the validation sample indicates
Vitamina A content
Input layer
Hidden layer
Output layer L*
a*
b*
C*
°hue
Figure 2. Relative contribution, obtained by the method of Garson (1991), of the colorimetric parameters in the input layer to predict the vitamin A level using artificial neural networks. The deviations refer to the 95% confidence intervals obtained by bootstrap BCa with 10,000 simulations.
L* a* b* C* °hue 0.15
0.18 0.21 0.24 0.27 0.30
Relative importance (%)
Independent variables
Figure 3. Best-fit network topology trained to predict vitamin A level from colorimetric data of ripe banana pulp.
that the trained network is efficient and has the power of generalization. The prediction efficiency found in this study is higher than that observed by Carvalho
et al. (2005), r2 = 0.90% for lycopene prediction, using
the colorimetric data of tomatoes. On the other hand, Seroczyńska et al. (2006) and Doka et al. (2013) found
r2 of 0.92 and 0.96%, respectively, when predicting the
β-carotene content using the colorimetric data of pumpkin. The good results of this work can be explained by the good fit of neural networks for non-linear systems (Gionola et al. 2011). Also, this technique allows considering many explanatory variables simultaneously, which can become impractical for multiple linear regression.
Fernandez-Ruiz et al. (2010) also found high r2 (0.99%) estimates
to predict lycopene content in tomatoes by ANNs, using colorimetric data.
Amorim, E. P., Cohen, K. O., Amorim, V. B. O., Paes, N. S., Sousa H. N., Santos-Serejo J. A. and Silva, S. O. (2011). Caracterização de acessos de bananeira com base na concentração de compostos funcionais. Ciência Rural, 41, 592-598. http://dx.doi.org/10.1590/ S0103-84782011005000042.
Aquino, C. F., Salomão, L. C. C., Siqueira, D. L., Cecon, P. R. and Ribeiro, S. M. R. (2014). Teores de minerais em polpas e cascas de frutos de cultivares de bananeira. Pesquisa Agropecuária Brasileira, 49, 546-553. http://dx.doi.org/10.1590/S0100-204X2014000700007.
Azevedo, A. M., Andrade Júnior, V. C., Pedrosa, C. E., Oliveira, C. M., Dornas, M. F. S., Cruz, C. D. and Valadares, N. R. (2015). Application of artificial neural networks in indirect selection: a case study on the breeding of lettuce. Bragantia, 74, 1-7. http://dx.doi. org/10.1590/1678-4499.0088.
Barbosa, C. D., Viana, A. P., Quintal, S. S. R. and Pereira, M. G. (2011). Artificial neural network analysis of genetic diversity in
Carica papaya L. Crop Breeding and Applied Biotechnology, 11, 224-231. http://dx.doi.org/10.1590/S1984-70332011000300004.
REFERENCES
Figure 4. Regression of the predicted and estimated vitamin A (µg per 100 gof pulp) in the training (a) and validation (b) samples using artificial neural networks.
allows reducing evaluation time, labor and financial costs (Fernandez-Ruiz et al. 2010).
CONCLUSION
The colorimetric parameters a* and °hue were the
most important in predicting the level of vitamin A in ripe banana pulp. High-level phenotyping of vitamin A in banana pulp by colorimetric data and artificial neural networks is feasible, allowing reducing evaluation time, labor, and financial costs.
ACKNOWLEDGMENTS
T h a n k s a r e d u e t o C o n s e l h o N a c i o n a l d e Desenvolvimento Científico e Tecnológico (CNPq), Fundação de Amparo à Pesquisa do Estado de Minas Gerais (FAPEMIG) and Coordenação de Aperfeiçoamento de Pessoal de Nível Superior (CAPES) for the grants and financial support.
y = 0.9905x + 1.2865
r² = 0.9511
0
0 50 100 150
0 50 100 150
20 40 60 80 100 120 140
Predicted virtamin A levels
y = 0.9869x + 0.5299 r² = 0.9852
0 20 40 60 80 100 120 140
Predicted virtamin A levels
Observed vitamin A levels
Bergmeir, C. and Benítez, M. J. (2012). Neural networks in R using the Stuttgart Neural Network Simulator: RSNNS. Journal of Statistical Software, 46, 1-26.
Brasileiro, B. P., Marinho, C. D., Costa, P. M. A., Cruz, C. D., Peternelli, L. A. and Barbosa, M. H. P. (2015). Selection in sugarcane families with artificial neural networks. Crop Breeding and Applied Biotechnology, 15, 72-78. http://dx.doi. org/10.1590/1984-70332015v15n2a14.
Carvalho, W., Fonseca, M. E. N., Silva, H. R., Boiteux, L. S. and Giordano, L. B. (2005). Estimativa indireta de teores de licopeno em frutos de genótipos de tomateiro via análise colorimétrica. Horticultura Brasileira, 23, 819-825. http://dx.doi.org/10.1590/ S0102-05362005000300026.
Davey, M. W., Bergh, V. D., Markham, R., Swnnen, R. and Keulemans, J. (2009). Genetic variability in Musa fruit provitamin A carotenoids, lutein and mineral micronutrient contents. Food Chemistry, 115, 806-813. http://dx.doi.org/10.1016/j. foodchem.2008.12.088.
(a)
Dóka, O., Ficzek, G., Luterotti, S., Bicanic, D., Spruijt, R., Buijnsters, J. G., Szalay, L. and Végvári, G. (2013). Simple and rapid quantification of total carotenoids in lyophilized apricots (Prunus armeniaca L.) by means of reflectance colorimetry and photoacoustic spectroscopy. Food Technology and Biotechnology, 51, 453-459.
Ekesa, B., Poulaert, M., Davey, M.W., Kimiywe, J. Van Den Bergh, I., Blomm, G. and Dhuique-Mayer, C. (2012). Bioaccessibility of provitamin A carotenoids in bananas (Musa spp.) and derived dishes in African countries. Food Chemistry, 133, 1471-1477. http:// dx.doi.org/10.1016/j.foodchem.2012.02.036.
Fernández-Ruiz, A. V., Torrecilla, J. S., Cámara, M., Mata, M. C. and Shoemaker, C. (2010). Radial basis network analysis of color parameters to estimate lycopene content on tomato fruits. Talanta, 83, 9-13. http://dx.doi.org/10.1016/j.talanta.2010.08.020.
Food and Agriculture Organization of the United Nations (2015). [accessed 2015 Aug 12]. http://faostat.fao.org/site/339;defaut.aspx
Garson, G. D. (1991). Interpreting neural-network connection weights. Journal AI Expert, 6, 47-51.
Gianola, D., Okut, H., Weigel, K. A. and Rosa, G. J. (2011). Predicting complex quantitative traits with Bayesian neural networks: a case study with Jersey cows and wheat. BMC Genetics, 12, 87-101. http:// dx.doi.org/10.1186/1471-2156-12-87.
Institute of Medicine (2001). Dietary Reference Intakes (DRIs): vitamin A, vitamin K, arsenic, boron, chromium, copper, iodine, iron, manganese, molybdenum, nickel, silicon, vanadium and zinc. Washington: National Academy Press.
Itle, R. A. and Kabelka, E. A. (2009). Correlation between L* a*
b* color space values and carotenoid content in pumpkins and squash (Cucurbita spp.). HortScience, 44, 633-637.
Lu, W., Haynes, K., Wiley, E. and Clevidence, B. (2001). Carotenoid content and color in diploid potatoes. Journal of the American Society for Horticultural Science, 126, 722-726.
McGuire, R. G. (1992). Reporting of objective color measurements. HortScience, 27, 1254-1260.
Nascimento, M., Peternelli, L. A., Cruz, C. D., Nascimento, A. C. C., Ferreira, R. P., Bhering, L. P. and Salgado, C. C. (2013). Artificial
neural networks for adaptability and stability evaluation in alfalfa genotypes.Crop Breeding and Applied Biotechnology, 13, 152-156.
Paliwal, M. and Kumar, U. A. (2011). Assessing the contribution of variables in feed forward neural network. Applied Soft Computing, 11, 3690-3696.
Pinheiro-Sant’ana, H. M., Stringheta, P. C., Brandão, S. C. C. and Azeredo, R. M. C. (1998). Carotenoid retention and vitamin A value in carrot (Daucus carotaL.) prepared by food service. Food Chemistry, 61, 145-151. http://dx.doi.org/10.1016/j.asoc.2011.01.040.
R Development Core Team (2012). The R Project for Statistical Computing; [accessed 2016 May 17]. http://www.R-project.org/
Ramos, S. P. and Ferreira, D. F. (2009). Agrupamento de médias via bootstrap de populações normais e não-normais. Revista Ceres, 56, 140-149.
Rodríguez-Amaya, D. B. (2001). A guide to carotenoid analysis in foods. Washington: International Life Sciences Institute Press.
Santos, E. M., Velarde, L. G. C. and Ferreira, V. A. (2010). Associação entre deficiência de vitamina A e variáveis socioeconômicas, nutricionais e obstétricas de gestantes. Ciência & Saúde Coletiva, 15, 1021-1030. http://dx.doi.org/10.1590/ S1413-81232010000700008.
Seroczyńska, A., Korzeniewska, A., Sztangret-Wiśniewska, J., Niemirowicz-Szczytt, K. and Gajewski, M. (2006). Relationship between carotenoids content and flower or fruit flesh colour of winter squash (Cucurbita máxima). Folia Horticulturae, 18, 51-61.
Silva, I. N., Spatti, D. H. and Flauzino, R. A. (2010). Redes neurais artificiais: para engenharia e ciências aplicadas. São Paulo: Artliber.
Soares, F. C., Robaina, A. D., Peiter, M. X., Russi, J. L. and Vivan, G. A. (2014). Redes neurais artificiais na estimativa da retenção de água do solo. Ciência Rural, 44, 293-300. http://dx.doi.org/10.1590/ S0103-84782014000200016.