Acta Scientiarum
http://www.uem.br/acta ISSN printed: 1679-9275 ISSN on-line: 1807-8621
Doi: 10.4025/actasciagron.v39i1.30691
Acta Scientiarum. Agronomy Maringá, v. 39, n. 1, p. 89-97, Jan.-Mar., 2017
Effect of liming on micronutrient availability to soybean grown in
soil under different lengths of time under no tillage
Silvino Guimarães Moreira1*, Luís Ignácio Prochnow2, Volnei Pauletti3, Bruno Montoani Silva1, Jorge de Castro Kiehl4 and Carine Gregório Machado Silva5
1
Departamento de Ciências Agrárias, Universidade Federal de São João del-Rei, Sete Lagoas, Minas Gerais, Brazil. 2International Plant Nutrition Institute, Piracicaba, São Paulo, Brazil. 3Departamento de Solos e Engenharia Agrícola, Universidade Federal do Paraná, Curitiba, Paraná, Brazil. 4Departamento de Ciência do Solo, Escola Superior de Agricultura "Luiz de Queiroz", Universidade de São Paulo, Piracicaba, São Paulo, Brazil. 5
Universidade Federal de São João del-Rei, Sete Lagoas, Minas Gerais, Brazil. *Author for correspondence. E-mail: [email protected]
ABSTRACT. The effect of liming on the availability of micronutrients to soybean cultivated during different numbers of years under no tillage (NT) was investigated. The treatments consisted of the number of years under NT (three, six, and nine years) and five rates of lime (0, 33, 67 and 100% of the amount calculated to raise soil base saturation to 70%) broadcast on soil surface plus the rate of 100% broadcast with incorporation in the 0-0.20 m layer of a clayey Red Oxisol. Soil and leaf samples were collected at two vegetative stages of the crop (vegetative V4 and blossoming R2). The soil was sampled at depths of 0-0.05, 0.05-0.10, 0.10-0.20, and 0.20-0.30 m. Surface liming had little effect on extractable soil micronutrient and nutrient concentrations in soybean leaves. In the area with three years under NT, all liming rates decreased the extractable soil Zn up to a depth of 0.20 m. Lime incorporation decreased the extractable soil Mn in the surface layer. There were no differences in the extractable soil micronutrients and nutrient concentrations in soybean leaves as a function of the number of years under NT. These data suggest that broadcasting lime at current rates on soils under NT does not necessarily lead to micronutrient deficiencies.
Keywords: copper, iron, manganese, zinc, no till.
Efeito da calagem na disponibilidade de micronutrientes para soja, cultivada em solo sob
diferentes tempos de cultivo em plantio direto
RESUMO. Avaliou-se o efeito da calagem sobre a disponibilidade de micronutrientes à soja cultivada em solo, com diferentes tempos de cultivo sob sistema de semeadura direta (SD). Os tratamentos consistiram de número de anos sob SD (três, seis e nove anos) e cinco doses de calcário (0, 33, 67 e 100% da quantidade necessária para elevar a saturação por bases a 70%), aplicadas em superfície, mais a dose 100% incorporada na camada 0-0,20 m de um Latossolo Vermelho argiloso. Amostras de solo e de folha foram coletadas em dois estádios de vegetação da soja (V4: estádio vegetativo e R2: florescimento pleno). O solo foi amostrado nas profundidades de 0-0,05, 0,05-0,10, 0,10-0,20 e 0,20-0,30 m. A calagem superficial exerceu pouco efeito sobre os teores de micronutrientes no solo e nas folhas de soja. Na área com três anos sob sistema de SD todas as doses de calcário reduziram os teores de Zn até a profundidade de 0,20 m. A incorporação de calcário diminuiu o teor de Mn da camada superficial. Os teores de micronutrientes no solo e as concentrações nas folhas da soja não variaram com os anos de cultivo sob SD. Estes dados sugerem que as doses atualmente empregadas de calcário aplicadas na superfície de solos sob SD não necessariamente conduzem a deficiências de micronutrientes.
Palavras-chave: cobre, ferro, manganês, zinco, plantio direto.
Introduction
The availability of nutrients to plants is affected by several soil attributes, such as pH, organic matter (OM), redox potential, temperature, moisture, and microbial activity, in addition to competition for adsorption sites. Cultivation under no tillage (NT) increases the amount of OM in the surface layer (Thomas, Dalal, & Standley, 2007; Santiago, Quintero, & Delgado, 2008; Aziz, Mahmood, &
accumulate (Aziz et al., 2013; Motschenbacher et al., 2014). Such features may cause the availability of micronutrients under NT to be different than when the soil is frequently tilled (Moreira et al., 2016). However, little information is available to evaluate to what extent surface liming and cultivation under NT will affect the availability of micronutrients.
High concentrations of some micronutrients have long been reported in surface layers of North American soils cultivated under NT. In many cases, these high micronutrient levels in the soils were attributed to the application of high rates of N to
maize (Zea mays L.) and/or monocultures of grass,
which cause a reduction in the pH and, consequently, increases in the availability of certain micronutrients (Grove & Blevins, 1988; Follett & Peterson, 1988; Edwards, Wood, Thurlow, & Ruf , 1992). However, it is known that the increased availability of certain micronutrients, chiefly Mn and Zn, is highly related to the increase of OM in the surface soil (Teixeira et al., 2003; Moreira, Prochnow, Kiehl, Martin-Neto, & Pauletti, 2006; Martin-Rueda et al., 2007; Santiago et al., 2008; Motschenbacher et al., 2014; Moreira et al., 2016). On the other hand, Zn and Mn deficiencies have been noticed especially in corn and soybean crops under NT. In addition, micronutrient deficiencies may increase with increasing time under NT because OM can bind with some micronutrients and decrease their availability (Tisdale, Nelson, & Beaton, 1985; Moreira et al., 2006; Moreira et al., 2016).
The deficiencies of such nutrients have been attributed to the excessive increases in pH in the surface layer (Grupta, Kening, & Siyuan, 2008), and in Brazil, many cases are related to the application of high rates of lime. However, this explanation may not always be correct because high extractable soil Zn and Mn have been found in surface layers of soils under NT, even when the pH and OM are high (Teixeira et al., 2003; Moreira et al., 2006; Moreira et al., 2016). Soratto and Crusciol (2008) did not observe decreases in Mn, Fe and Zn absorption by black oat cultivated in a Red Latosol under NT when high rates of lime were used. On the other hand, Caires, Banzatto, & Fonseca (2000) observed decreases in Mn and Zn absorption by soybean plants cultivated in a Red Latosol under NT for 15 years when high rates of lime were used. However, Caires et al. (2003) observed decreases in
Mn and Zn absorption by soybean plants, but only in some crops. Liming and re-liming caused a decrease in the Mn concentration in wheat leaves, but leaf concentrations of Cu, Fe and Zn were not affected by liming (Fonseca et al., 2010).
Considering these facts, in the present work, lime was broadcast at different rates on the surface or broadcast with incorporation in the 0-0.20 m layer of a Red Latosol that had been previously under NT for different lengths of time in order to evaluate the effect of these treatments on the availability of micronutrients to soybean plants.
Material and methods
The work was carried out under field conditions on a very clayey Red Latosol (Oxysol) in Tibagi, State of Paraná, Brazil, that had been previously cropped under NT for three, six, and nine years. The three and six year sites were located in grain growing areas of the farms. The nine year site was located in an experimental field. Details about the cropping during the three, six and nine years prior to the treatments are presented by Moreira, Kiehl, Prochnow, and Pauletti, (2001).
The experiment was set in a randomized complete block as a split-split-plot design with four replications. The main plots were treatments arranged in a 3 x 5 factorial set (3 different lengths of time under NT x 5 rates of lime); the subplots included the two sampling times after lime application, and the sub-subplots comprised four depths of soil sampling (0-0.05, 0.05-0.10, 0.10-0.20, and 0.20-30 m). For the sites with three and six years under NT, the plots measured 6.4 m x 7.0 m
(45 m2), whereas for the nine years under NT, the
dimensions were 8.30 m x 12.50 m (104 m2).
Lime rates were 0, 33, 67 and 100% of the amount calculated to raise the base saturation to 70% that was broadcast on the surface plus the 100% broadcast rate with incorporation in the 0-0.20 m soil layer. Rates to raise the base saturation to 70%, calculated in accordance to procedures recommended by Raij et al. (1997), were 3,030,
3,380, and 2,485 kg ha-1, respectively, for the sites
Liming on micronutrient availability to soybean 91
Acta Scientiarum. Agronomy Maringá, v. 39, n. 1, p. 89-97, Jan.-Mar., 2017
Table 1. Chemical properties of the Red Latosol prior to experiment installation.
Years under no tillage
(1)pH
in CaCl2
Presin OM H+Al Al K Ca Mg SB CEC BS Al Saturation
mgdm-3 ________________ mmol
c dm
-3 _________________ ___ %__
Three 5.0 33 55 58 1 3.7 28 26 57.7 115.7 50 1.7
Six 4.8 41 47 72 2 6.7 47 18 71.7 143.7 50 2.7
Nine 5.1 44 47 52 0 2.6 34 21 57.6 109.6 53 0.0
(1) pH and OM, P, K, Ca, Mg and Al content determined according to Raij et al. (1987).
Soybean (cv. EMBRAPA 59) was sown in October 1998 in rows spaced 0.45 m apart, at the rate of 16 plants per metre. The seeds were previously treated with a solution containing selected species of Bradyrhizobium and sodium molybdate at 64 g of sodium molybdate per 50 kg
of seeds. At seeding, 200 kg ha-1 of 0-20-20 NPK
fertilizer was applied in the furrow.
The soil and leaves were sampled at the following two times: stage V4 (three open trifoliolate leaves) and stage R2 (blossoming) on December 17, 1998 and January 26, 1999, respectively. Malavolta, Vitti, and Oliveira (1997) recommended sampling only one leaf at the blossoming, but an additional date was considered because Mn deficiencies in soybean and Zn deficiencies in corn have been frequent in the initial periods of crop development but subsequently disappear eventually (Pauletti, 1999; Moreira et al., 2006). Twenty open trifoliolate leaves per plot (third leaf from the top) were collected. The plant material was washed in deionized water and dried at 60°C in a ventilated chamber. The concentrations of B, Cu, Fe, Mn, and Zn were determined according to methods described by Malavolta et al. (1997).
One sampling, comprising ten samples, was taken in each plot with a tubular probe at depths of 0-0.05, 0.05-0.10, 0.10-0.20, and 0.20-0.30 m. The samples were dried in a ventilated chamber at 40°C and passed through a 2 mm sieve. The extractable soil Mn, Cu, Zn, and Fe content was determined by extraction with DTPA-TEA pH 7.3 (Lindsay & Norvell, 1978), and the extractable B content was determined by
extraction with BaCl2.H2O 0.125% in a
microwave oven (Abreu, Abreu, Raij, van, Bataglia, & Andrade, 1994).
The data were subjected to an analysis of variance (F test), and the means were compared using Tukey’s test at the 5% level (Ferreira, Cavalcanti, & Nogueira, 2013). The comparison of the means was utilized instead of polynomial regressions because the method of lime
application was not uniform for all treatments. A simple linear correlation analysis was estimated for the treatments without lime incorporation between extractable soil micronutrients and soil pH and soil OM and between extractable soil micronutrients and leaf micronutrient concentrations.
Results and discussion
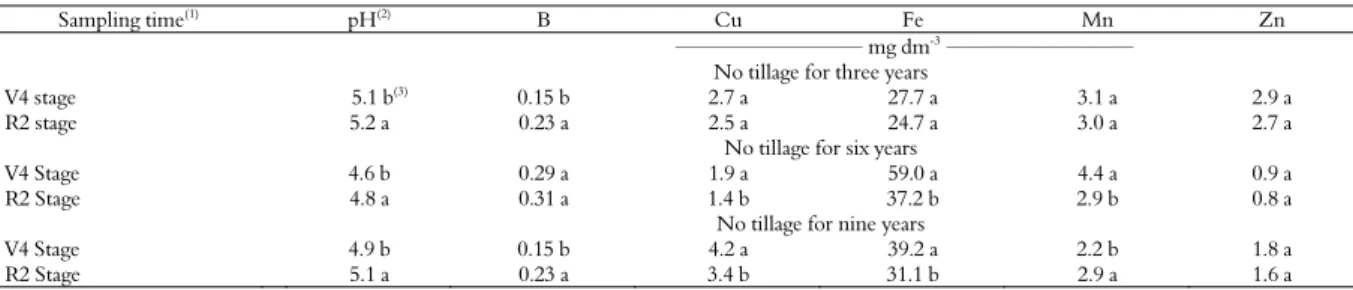
Except for the concentrations of Cu and Fe in the soils that had six and nine years under NT and of Mn in the soil that had six years of NT, all of which decreased from the first to the second sampling, micronutrient availability was not greatly affected by the increase in soil pH (Table 2). This small pH increase was probably not enough to reduce the solubility of the micronutrients in the soil. Moreover, in some situations, a small increase in extractable soil B was observed in the second sampling. In the case of B, according to Tisdale et al. (1985), the increase in pH may accelerate the decomposition of OM and release B into the soil. In
this study, some B was adsorbed to Al(OH)3 in the
second sample, which may have been released into the soil solution and contributed to the increased B levels in the soil solution and, consequently, in plant leaves. Rosolem and Biscaro (2007) showed that even with high doses of lime, the B adsorption by soil was observed only in the first year of limestone application. The authors report that, over time, the amount of B increased in the soil solution and was able to be absorbed by plants.
Table 2. Soil pH and extractable soil micronutrients in a Red Latosol after three, six and nine years of soybean cultivation under no tillage at two sampling times.
Sampling time(1)
pH(2)
B Cu Fe Mn Zn
________________________________ mg dm-3 ________________________________
No tillage for three years
V4 stage 5.1 b(3) 0.15 b 2.7 a 27.7 a 3.1 a 2.9 a
R2 stage 5.2 a 0.23 a 2.5 a 24.7 a 3.0 a 2.7 a
No tillage for six years
V4 Stage 4.6 b 0.29 a 1.9 a 59.0 a 4.4 a 0.9 a
R2 Stage 4.8 a 0.31 a 1.4 b 37.2 b 2.9 b 0.8 a
No tillage for nine years
V4 Stage 4.9 b 0.15 b 4.2 a 39.2 a 2.2 b 1.8 a
R2 Stage 5.1 a 0.23 a 3.4 b 31.1 b 2.9 a 1.6 a
(1) The sampling times were related to soybean growth stages. (2) Letters compare the sampling time within each cultivation time using the Tukey test at a significance level of 5%. Zn
data were transformed into (Zn)1/2. (3) pH values determined according to Raij et al. (1987). Extractable soil Mn, Cu, Zn, and Fe content was determined by extraction with DTPA-TEA
pH 7.3 (Lindsay and Norvell, 1978) and B with BaCl2.H2O 0.125% in a microwave oven (Abreu et al., 1994).
Table 3. Micronutrient concentration in soybean leaves cultivated under no tillage in a Red Latosol for three, six and nine years at two sampling times.
Sampling time(1) B Cu Fe Mn Zn
____________________________________
g kg-1
_____________________________________
No tillage for three years
V4 Stage 20 b(1) 8 b 136 a 36 a 25 b
R2 Stage 41 a 11 a 69 b 30 b 33 a
No tillage for six years
V4 Stage 28 b 7 b 114 a 53 a 31 a
R2 Stage 40 a 8 a 54 b 32 b 30 a
No tillage for nine years
V4 Stage 24 a 9 a 215 a 34 a 33 a
R2 Stage 25 a 9 a 60 b 25 b 29 b
(1) Letters compare the sampling time within each number of years of cultivation using the Tukey test at a significance level of 5%. The effect of liming on the extractable soil Fe,
Mn, and Zn content was studied within each year under NT and each depth because the interaction between lime rates, years under NT, and depths was
significant. For the cases in which the triple
interaction was not significant (B and Cu), the significant double interactions were studied.
Extractable soil B and Cu were not influenced by the lime rate and the number of years under NT (B
average = 0.23 mg dm-3; C.V. 27.3% and Cu average
= 2.5 mg dm-3; C.V. 22%). Liming generally
decreases the B content because Al3+ in solution is
precipitated in the form of Al(OH)3, which has the
ability to adsorb large amounts of B (Tisdale et al., 1985; Prodromu, 2004; Rosolem & Bíscaro, 2007). The low exchangeable Al in these soils (Table 1) may explain the lack of response of B to liming.
The extractable soil B in the surface layer seems to have been related more to the amount of OM, which is an important source of this element (Tisdale et al., 1985; Rosolem & Bíscaro, 2007; Rosolem, Zancanaro, & Bíscaro, 2008), than to the soil pH. In the first sampling (V4 stage), the correlation coefficient between extractable soil B and OM was positive for all layers (correlation coefficient in the surface layer was 0.56), thus agreeing with results obtained by Alleoni, Camargo, and Valadares (1999) for soils in the State of São Paulo.
In the case of extractable soil Cu, it is possible that the increase in pH in the present study was not
enough to reduce the solubility of Cu2+. Increases in soil
pH above 6.0 induce the hydrolysis of hydrated Cu, which can lead to a stronger Cu adsorption by clay minerals and organic matter. Thus, the Cu2+ solubility is soil pH dependent and decreases 100-fold for each pH unit increase (Fageria, Baligar, & Clark, 2002). In a study by Fonseca et al. (2010), the soil extractable Cu decreased linearly with increasing lime application rates in a soil under NT due to the increased pH. Nachtigall, Nogueirol, and Alleoni (2007) reported that as the pH decreased, the exchangeable Cu content increased, while the amount of Cu bound to OM, oxides and residual fractions decreased.
For all sites, the surface layer presented the lowest extractable soil Cu (Table 4), which disagreed with the results of Teixeira et al. (2003) for soils in São Paulo State. In the study, the lower extractable soil Cu was attributed to the presence of more OM on the surface, thus resulting in more complexation of the element (Fageria et al., 2002). In the present work, correlation coefficients between the extractable soil Cu and OM were also low or non-significant (data not shown); these results are in disagreement with results by many authors for NT soils (Teixeira et al., 2003; Santiago et al., 2008; Martin-Rueda et al., 2007; Vukasinovic et al., 2015). However, extractable soil Cu is mostly governed by OM in many soils because it can form complexes
and chelates with a large portion of the soil Cu2+
(Tisdale et al., 1985).
Liming on micronutrient availability to soybean 93
Acta Scientiarum. Agronomy Maringá, v. 39, n. 1, p. 89-97, Jan.-Mar., 2017
Table 4. Extractable soil Cu in a Red Latosol after three, six and nine years of soybean cultivation under no tillage at different soil depths.
Soil depth Three years Six years Nine years
m ___________________________________
mg dm-3 ____________________________________
0-0.05 2.3 b(1) 1.4 b 3.2 b
0.05-0.10 2.6 a 1.7 ab 4.3 a
0.10-0.20 2.7 a 1.8 a 4.0 a
0.20-0.30 2.7 a 1.7 ab 4.0 a
(1) Lower case letters compare soil depths within each number of years under no tillage using the Tukey test at a significance level of 5%.
Soil extractable Fe varied little with the lime rate (Table 5). In the site with six years under NT, the incorporation of the total rate resulted in lower extractable soil Fe in the 0.05-0.10 m layer than when 67% of the rate was applied on the surface. In the surface layer, the opposite occurred. This effect may have taken place because incorporation causes a better distribution of lime in the soil profile. In the soil with nine years under NT, all rates applied on the surface reduced Fe content in the 0-0.05 m layer. On the other hand, Fonseca et al. (2010) observed that liming caused a linear decrease in the extractable Fe content. Alleoni, Cambri, and Caires (2005) also observed a decrease in Fe concentrations extracted by DTPA at the 0.10 m depth after the application of surface liming under an NT system.
A greater effect of lime on soil extractable Fe
was expected because ferric (Fe3+) and ferrous
(Fe2+) activity in the soil solution decreases
1000-fold and 100-1000-fold, respectively, for each pH unit increase (Fageria et al., 2002). Additionally, with increasing soil acidification, the available Fe content increases (Rutkowska, Szulc, Sosulski, & Stepien, 2014). However, in these soils, other factors, such as the redox potential and OM, must be considered. According to Follett and Peterson (1988), the accumulation of both OM and water close to the surface may decrease the soil redox potential and thus increase the Fe availability to crops. In many cases, the high exchangeable Fe content in the surface layers of the soil is related to the higher concentrations of OM in these layers (Teixeira et al., 2003; Santiago et al., 2008; Martin-Rueda et al., 2007; Vukasinovic et al., 2015).
Significant negative correlations were found between pH values and the Fe content (values of -0.5, -0.8, -0.7, and -0.7 at the depths of 0.0-0.05, 0.05-0.10, 0.10-0.20 and 0.20-0.30, respectively, at the V4 stage); these results agree with those shown by Ferreira et al. (2013) and Fonseca et al. (2010) for soil under NT. Correlations with OM were positive at the first sampling (values of 0.55, 0.68, 0.67, and
0.53 at the depths of 0.0-0.05, 0.05-0.10, 0.10-0.20 and 0.20-0.30, respectively), and some were negative at the second sampling (data not shown). In the first case, OM may have supplied the soil solution with chelating agents, which increased the Fe availability (Tisdale et al., 1985) and, in the second case, caused the formation of insoluble complexes with Fe. Walters, Aulakh, and Doran (1992) noticed higher extractable soil Fe in the soil during the initial period of decomposition of the residues of hairy
vetch (Vicia villosa L.) than at the end of this period.
They suggested that after total decomposition occurred, there was a re-oxidation of the element, which decreased its availability. Teixeira et al. (2003) also observed negative correlations of Fe with OM in soil under NT, which was attributed to OM's ability to form complexes with the nutrient.
Extractable soil Mn in the surface layer of sites with three and six years under NT decreased more when the lime was broadcast with incorporation in the 0-0.20 m layer than when it was broadcast at the highest rate on the surface (Table 6). In the nine-year NT soil, the incorporation of lime also decreased extractable soil Mn in the 0-0.05 m layer compared to 67 % of the dose applied superficially.
The practice of incorporating lime into the soil may have increased the contact of lime with soil particles, thus increasing its action in decreasing soluble forms of Mn. Furthermore, Mn in the surface layer may have been diluted in the lower layers through the incorporation of lime. In addition, the practice of incorporating lime may
have increased the oxidation reactions of Mn2+ to
Mn4+ because it increases soil aeration. Alleoni et al.
Table 5. Extractable soil Fe at different depths of a Red Latosol after three, six and nine years of soybean cultivation under no tillage as a function of lime rates.
Soil depth Lime rate (1)
100 I 100 S 67 S 33 S 0
1m m _____________________________________ mg dm-3 ____________________________________
No tillage for three years
0-0.05 23.8 abA(2) 23.6 aA 20.7 aA 20.8 bA 24.9 aA
0.05-0.10 23.0 bA 24.0 aA 26.4 aA 25.3 abA 27.2 aA
0.10-0.20 26.6 bA 27.6 aA 27.0 aA 29.1 aA 30.3 aA
0.20-0.30 30.4 aA 28.0 aA 27.1 aA 27.6 abA 30.8 aA
No tillage for six years
0-0.05 46.6 aA 41.0 bAB 38.4 bB 40.6 bAB 40.0 cAB
0.05-0.10 47.7 aB 52.3 aAB 57.1 aA 53.3 aAB 53.7 abAB
0.10-0.20 48.5 aA 54.3 aA 54.8 aA 53.6 aA 55.2 aA
0.20-0.30 45.3 aA 47.4 abA 44.2 bA 41.9 bA 45.0 bcA
No tillage for nine years
0-0.05 37.0 aAB 31.8 aB 30.9 bB 31.4 aB 43.1 aA
0.05-0.10 38.0 aA 36.8 aA 40.8 aA 37.5 aA 43.0 aA
0.10-0.20 34.5 aA 31.0 aA 34.2 abA 36.0 aA 36.6 abA
0.20-0.30 34.8 aA 30.3 aA 29.5 bA 31.4 aA 35.0 bA
C.V. 11.0%
(1)Percentage of the rate necessary to raise the base saturation to 70%; I = broadcast with incorporation in the 0-0.20 m layer; S = broadcast on the surface. (2)Lower case letters compare
soil depths within each lime rate and each period of time under no tillage (NT); upper case letters compare lime rates within each period of time under NT and each soil depth using the Tukey test at a significance level of 5%.
Table 6. Extractable soil Mn at different depths of a Red Latosol cultivated with soybeans for three, six and nine years under no tillage as a function of lime rates.
Soil depth Lime rate (1)
100 I 100 S 67 S 33 S 0
mm _____________________________________ mg dm-3 ____________________________________
No tillage for three years
0-0.05 4.6 aB(2) 6.2 aA 4.8 aB 4.9 aAB 5.6 aAB
0.05-0.10 3.7 abA 3.2 bA 4.1 aA 4.0 aA 3.8 bA
0.10-0.20 2.9 bA 2.2 bcA 2.0 bcA 2.4 bA 2.2 cA
0.20-0.30 1.6 bA 1.1 cA 0.8 cA 0.9 cA 1.0 cA
No tillage for six years
0-0.05 4.2 aB 6.8 aA 5.7 aA 6.6 aA 6.5 aA
0.05-0.10 3.4 aB 4.1 bAB 4.4 aA 4.9 bA 4.3 bAB
0.10-0.20 3.1 abA 2.9 bcA 2.9 bA 3.4 cA 3.0 bA
0.20-0.30 1.8 bA 1.4 cA 1.2 cA 1.2 dA 1.2 cA
No tillage for nine years
0-0.05 3.3 aB 4.3 aAB 4.8 aA 4.5 aAB 5.6 aA
0.05-0.10 2.5 aA 2.5 bA 3.3 bA 2.8 bA 2.8 bA
0.10-0.20 2.0 abA 1.6 bA 1.8 cA 1.9 bcA 1.7 bcA
0.20-0.30 1.1 bA 1.4 bA 1.1 cA 1.3 cA 1.3 cA
C.V. 25.8%
(1)Percentage of the rate necessary to raise the base saturation to 70%; I = broadcast with incorporation in the 0-0.20 m layer; S = broadcast on the surface. (2) Lower case letters compare
soil depths within each lime rate and each number of years under no tillage (NT); upper case letters compare lime rates within each number of years under NT and each soil depth using the Tukey test at a significance level of 5%.
The highest extractable soil Mn was found in the surface layers, in agreement with the results reported by other authors (Martin-Rueda et al., 2007; Vukasinovic et al., 2015). However, this portion of the soil showed the highest pH (Moreira et al., 2001). These results agree with those obtained by Teixeira et al. (2003), Moreira et al. (2006), and Moreira et al. (2016), and disagree with what has been long known about the effect of pH on Mn availability (Gupta et al., 2008, Rutkowska et al., 2014). In this manner, the highest extractable Mn in the surface of NT soil was related to a higher content of OM, which would be a source of this nutrient (Martin-Rueda et al., 2007; Santiago et al., 2008). There were correlations between OM and extractable soil Mn (values of 0.4, 0.5, 0.7, and 0.5 at the depths of 0.0-0.05, 0.05-0.10, 0.10-0.20 and 0.20-0.30, respectively), in agreement with results obtained by Teixeira et al. (2003), Moreira et al. (2006)
and Moreira et al. (2016) for NT soils. However, it must be stressed that OM may also decrease the Mn availability due to the formation of non-soluble chelates with the element (Tisdale et al., 1985; Moreira et al., 2006; Moreira et al., 2016).
In the case of extractable soil Zn, the most pronounced effect of lime application occurred in the site with three years under NT, where the extractable soil Zn decreased with all application rates on the surface (Table 7). The stronger effect on this soil may be due to its higher initial pH (Table 1). According to Tisdale et al. (1985), at a pH above 6.0, the soluble
forms of Zn2+ are decreased because they are
transformed into not very soluble compounds, such as
Zn(OH)2 and ZnCO3. Alleoni et al. (2005) also
Liming on micronutrient availability to soybean 95
Acta Scientiarum. Agronomy Maringá, v. 39, n. 1, p. 89-97, Jan.-Mar., 2017
soils, Shuman and McCracken (1999a) concluded that the extractable soil Zn content was not affected by liming and Fonseca et al. (2010) observed that in the 0-0.05 m layer, soil extractable Zn concentrations were not influenced by the lime rates.
The extractable soil Zn in the six-year NT soil did not vary with depth, thus disagreeing with previous results obtained (Castro, Camargo, Cantarella, Vieira, & Dechen, 1992; Edwards et al., 1992; Teixeira et al., 2003; Vukasinovic et al., 2015). In contrast, the extractable soil Zn in the site with three years under NT was almost always lower in the deepest layer evaluated.
The concentrations of B, Cu, Fe, and Zn in the soybean leaves were not changed by lime rates (data not shown), which reflects the weak effect of liming on the extractable soil micronutrients. Fonseca et al. (2010) also did not observe a decrease in Cu, Fe, and Zn concentrations in wheat leaves due to surface liming in NT fields, but they did find that Mn concentrations decreased. In contrast, Soratto and Crusciol (2008) reported a lower concentration of Fe due to surface liming in NT in black oat plants during the first year of cultivation, but surface liming did not affect the Cu, Mn, and Zn concentrations. In the second year of cultivation, they found that only the Mn concentrations decreased with surface liming.
At the first sampling, the correlation coefficients between the concentrations of B, Cu, and Mn in the leaves and the extractable nutrients in the soil were positive (Table 8). At the R2 stage (time indicated for leaf diagnosis), the correlation coefficients between the B, Cu in the leaves and soil content were low and not significant. The correlation coefficients between the concentrations of Fe in the leaves and the extractable Fe in the soil were negative. Shuman and McCracken (1999b) found negative correlations between Mn and
Zn concentrations in corn leaves and extractable Mn and Zn in the soil under NT.
It appears that differences in micronutrient behaviour in soils under NT compared to soil under CT are mainly due to its higher OM content. It is possible that the extractors used in the present study, hot water for B and DPTA for Cu, Fe, Mn and Zn, were not as effective for soils under NT as they would be for CT soils in Brazil, as previously reported by Fonseca et al. (2010), in the case of cationic micronutrients and by Moreira et al. (2006) for Mn. Such soils usually have a high content of OM, which may form insoluble complexes with Cu, Fe, Mn, and Zn, thus decreasing the availability of such elements. Moreira et al. (2006) applied Mn doses of up to 48 kg
ha-1 in soils under NT and observed minor variations
in Mn accumulation in soybean. However, the amount of Mn in the soil organic portion changed from 15.5 to 51.9% of the Mn in soil, demonstrating that most of the applied Mn was retained in the OM. Based on these results and studies by electron paramagnetic resonance, Moreira et al. (2006) concluded that much of the Mn applied to the soil under NT is retained in the organic fraction in more stable forms and is therefore not available to plants.
There was an effect of lime rates and of the years under NT on the concentrations of Mn in soybean leaves only at the first sampling (Table 9). In the sites with six and nine years under NT, the lowest Mn concentration occurred both when the highest rate was broadcast with incorporation in the 0-0.20 m layer in the soil and in the plots with the shortest time under NT, when this rate was applied on the surface. In all locations, leaf Mn concentrations were adequate for soybean, according to Malavolta et al. (1997).
Table 7. Extractable soil Zn at different depths of a Red Latosol cultivated for three, six and nine years under no tillage as a function of lime rates.
Soil depth Lime rate(1)
100 I 100 S 67 S 33 S 0
m _____________________________________
mg dm-3 ____________________________________
No tillage for three years
0-0.05 4.7 aAB(2) 2.5 aB 2.3 aB 2.0 aB 9.8 aA
0.05-0.10 4.4 aB 1.8 aBC 1.6 abC 2.3 aBC 10.4 aA
0.10-0.20 3.7 aA 0.8 abB 1.3 abB 1.1 abB 4.1 bA
0.20-0.30 1.3 bA 0.4 bA 0.4 bA 0.3 bA 1.0 cA
No tillage for six years
0-0.05 1.5 aA 0.8 aA 0.7 aA 0.8 aA 1.3 aA
0.05-0.10 1.0 aA 0.6 aA 0.7 aA 0.6 aA 0.9 aA
0.10-0.20 1.4 aA 1.5 aA 0.7 aA 0.9 aA 1.5 aA
0.20-0.30 0.6 aA 0.8 aA 0.2 aA 0.3 aA 0.4 aA
No tillage for nine years
0-0.05 2.5 aA 1.3 aA 2.1 bA 2.1 abA 1.8 aA
0.05-0.10 2.4 aB 1.0 aB 5.0 aA 1.7 abB 2.7 aB
0.10-0.20 1.2 abAB 0.6 aB 2.8 abA 2.5 aA 1.1 aAB
0.20-0.30 0.5 bA 0.7 aA 0.5 cA 0.5 bA 0.5 aA
C.V. 34.0%
(1)Percentage of the rate necessary to raise the base saturation to 70%; I = broadcast with incorporation in the 0-0.20 m layer; S = broadcast on the surface. (2)Lower case letters compare
Table 8. Coefficients of linear correlation (r) between extractable soil micronutrients and concentrations in leaves in treatments with lime broadcast without incorporation at different times and soil depths.
Soil depth B Cu Fe Mn Zn
m Soybean V4 stage
0-0.05 0.39 ** 0.48 ** 0.17 ns 0.53 ** -0.12 ns
0.05-0.10 0.52 ** 0.43 ** -0.10 ns 0.50 ** 0.33 *
0.10-0.20 0.57 ** 0.37 ** -0.20 ns 0.37 ** 0.48 **
0.20-0.30 0.45 ** 0.36 * -0.10 ns 0.36 * 0.09 ns
Soybean R2 stage
0-0.05 0.08 ns 0.14 ns -0.40 ** 0.34 * 0.57 **
0.05-0.10 0.11 ns 0.12 ns -0.50 ** 0.36 * 0.44 **
0.10-0.20 0.25 ns 0.12 ns -0.50 ** 0.30 * 0.18 ns
0.20-0.30 0.16 ns 0.22 ns -0.40 ** -0.20 ns 0.20 ns
ns = non-significant, *significant at 5%, **significant at 1%.
Table 9. Concentration of Mn in leaves of soybean cultivated in a Red Latosol for different numbers of years under no tillage as a function of lime rates at two sampling times.
Years under no tillage
Lime rate(1)
100 I 100 S 67 S 33 S 0
_______________________________________ mg kg-1 _______________________________________
Soybean V4 Stage
Three 35 abAB(2) 30 bB 33 bAB 40 bAB 43 bA
Six 44 aB 55 aAB 57 aA 52 aAB 57 aA
Nine 29 bB 31 bAB 33 bAB 36 bAB 41 bA
Soybean R2 Stage
Three 27 aA 31 aA 29 aA 30 aA 35 aA
Six 35 aA 29 aA 30 aA 29 aA 37 aA
Nine 24 aA 22 aA 24 aA 24 aA 29 aA
C.V. 13.1%
(1)Percentage of the rate necessary to raise the base saturation to 70%; I = broadcast with incorporation in the 0-0.20 m layer; S = broadcast on the surface. (2)Lower case letters compare
the number of years under NT within each lime rate and sampling time using Tukey’s test at a significance level of 5%.
Conclusion
Results indicate that, in general, there were no differences in the extractable soil micronutrients and nutrient concentrations in the leaves of soybean as a function of years under no tillage, rates of lime applied and lime incorporation. These data suggest that current rates of lime applied to the soil surface in areas using no tillage do not necessarily lead to micronutrient deficiencies.
References
Abreu, C. A., Abreu, M. F., Raij, B. Van, Bataglia, O. C., & Andrade, J. C. (1994). Extraction of boron from soil by microwave heating ICP-AES determination.
Communication in Soil Science and Plant Analysis,
25(19-20), 3321-3333.
Alleoni, L. R. F., Camargo, O. A., & Valadares, J. A. S. (1999). Correlations between hot calcium chloride-extracted boron and chemical and physical attributes of some brazilian soils. Scientia Agricola,56(2), 295-300. Alleoni, L. R. F., Cambri, M. A., & Caires, E. F. (2005). Atributos químicos de um Latossolo de Cerrado sob plantio direto de acordo com doses e formas de aplicação de calcário. Revista Brasileira de Ciência do Solo,
29(6), 923-934.
Aziz, I., Mahmood, T., & Islam, K. R. (2013). Effect of long term no-till and conventional tillage practices on soil quality. Soil and Tillage Research,131(1), 28-35. Caires, E. F., Alleoni, L. R. F., Cambri, M. A., & Barth, G.
(2005). Surface application of lime for crop grain
production under a no-till system. Agronomy Journal,
97(3), 791-798.
Caires, E. F., Banzatto, D. A., & Fonseca, A. F. (2000). Calagem na superfície em sistema de plantio direto.
Revista Brasileira de Ciência do Solo, 24(1), 161-170.
Caires, E. F., Blum, J., Barth, G., Garbuio, F. J., & Kusman, M. T. (2003). Alterações químicas do solo e resposta da soja ao calcário e gesso aplicados na implantação do sistema de plantio direto. Revista
Brasileira de Ciência do Solo,27(2), 275-286.
Castro, O. M., Camargo, O. A., Cantarella, H., Vieira, S. R, & Dechen, S. C. F. (1992). Teores de zinco cobre, manganês e ferro em dois Latossolos sob plantio direto e convencional. Bragantia, 51(1), 77-84.
Edwards, J. H., Wood, C. W., Thurlow, D. L., & Ruf, M. E. (1992). Tillage and crop rotation on fertility status of a Hapludult soil. Soil Science Society of America
Journal, 56(5), 1577-1582.
Fageria, N. K., Baligar, V. C., & Clark, R. B. (2002). Micronutrients in crop production. Advances in
Agronomy, 77(1), 185-268.
Ferreira, E. B., Cavalcanti, P. P., & Nogueira, D. A. (2013).
ExpDes: Experimental Designs pacakge. R package version
1.1.2. [Software]. Retrieved from
https://cran.r-project.org/web/packages/ExpDes.pt/citation.html. Follett, R. F., & Peterson, G. A. (1988). Surface soil
nutrient distribution as affected by wheat- fallow tillage systems. Soil Science Society of America Journal,
52(1), 141-147.
Liming on micronutrient availability to soybean 97
Acta Scientiarum. Agronomy Maringá, v. 39, n. 1, p. 89-97, Jan.-Mar., 2017
Grove, J. H., & Blevins, R. L. (1988). Correcting soil acidification in continuous corn (Zea mays L.).
Communication in Soil Science and Plant Analysis,
19(7-12), 1331-1342.
Gupta, U. C., Kening, W., & Siyuan, L. (2008). Micronutrients in soil, crops, and livestock. Earth
Science Frontiers, 15(5), 110-125.
Lindsay, W. L., & Norvell, W. A. (1978). Development of a DTPA soil test for zinc, iron, manganese, and copper.
Soil Science Society American Journal, 42(3), 421-428.
Malavolta, E., Vitti, G. C., & Oliveira, S. A. (1997).
Avaliação do Estado Nutricional das Plantas: princípios e
aplicações (2nd ed.). Piracicaba, SP: Potafos.
Martin-Rueda, I., Munoz-Guerra, L. M., Yunta, F., Esteban, E., Tenorio, J. L., & Lucena, J. J. (2007). Tillage and crop rotation effects on barley yield and soil nutrients on a Calciortidic Haploxeralf. Soil and
Tillage Research, 92(1), 1-9.
Moreira, S. G., Kiehl, J. C., Prochnow, L. I., & Pauletti, V. (2001). Calagem em sistema de semeadura direta e efeitos sobre a acidez do solo, disponibilidade de nutrientes e produtividade de milho e soja. Revista
Brasileira de Ciência do Solo, 25(1), 71-81.
Moreira, S. G., Prochnow, L. I., Kiehl, J. C., Martin-Neto, L., & Pauletti, V. (2006). Formas químicas, disponibilidade de manganês e produtividade de soja em solos sob sistema de semeadura direta. Revista
Brasileira de Ciência do Solo, 30(1), 121-136.
Moreira, S. G., Prochnow, L. I., Kiehl, J.C., Pauletti, V., & Martin-Neto, L. (2016). Chemical forms in soil and availability of manganese and zinc to soybean in soil under different tillage systems. Soil and Tillage Research, 163, 41-53.
Motschenbacher, J. M., Brye, K. R., Anders, M. M., & Gbur, E. E. (2014). Long-term rice rotation, tillage, and fertility effects on near-surface chemical properties in a silt-loam soil. Nutrient Cycling
Agroecosystems, 100(1), 77-94.
Nachtigall, C. R., Nogueirol, R. C., & Alleoni, L. R. F. (2007). Formas de cobre em solos de vinhedos em função do pH e da adição de cama-de-frango. Pesquisa
Agropecuária Brasileira,42(3), 427-434.
Pauletti, V. (1999). Disponibilidade e resposta de culturas a micronutrientes no sistema plantio direto. In V. Pauletti, & R. Seganfredo (Eds.). Revista Plantio Direto: Atualização tecnológica (p. 71-95). São Paulo, SP: Fundação Cargill/Fundação ABC.
Prodromu, K. P. (2004). Boron adsorption by amorphous Al(OH)3 in the presence of low molecular weight
organic acids. Agrochimica, 48(3-4), 172-176.
Raij, B. van, Cantarella, H., Quaggio, J. A., & Furlani, A. M. C. (1997). Recomendações de calagem e adubação para o
Estado de São Paulo (2nd Ed.). Campinas, SP: Instituto
Agronômico de Campinas.
Raij, B. van, Quaggio, J. A., Cantarella, H., Ferreira, M. E., Lopes, A. S., & Bataglia, O. C. (1987). Análise
Química do Solo para fins de Fertilidade. Campinas, SP:
Fundação Cargill.
Rosolem, C. A., & Bíscaro, T. (2007). Adsorção e lixiviação de boro em Latossolo Vermelho-Amarelo.
Pesquisa Agropecuária Brasileira, 42(10), 1473-1478.
Rosolem, C. A., Zancanaro, L., & Bíscaro, T. (2008). Evaluating available boron and soybean response to boron in an oxisol from central-western Brazil. Revista
Brasileira de Ciência do Solo, 32(6), 2375-2383.
Rutkowska, B. C., Szulc, W., Sosulski, T., & Stepien, W. (2014). Soil micronutrient availability to crops affected by long-term inorganic and organic fertilizer applications.
Plant Soil and Environnment, 60(5), 198-203.
Santiago, A., Quintero, J. M., & Delgado, A. (2008). Longterm effects of tillage on the availability of iron, copper, manganese, and zinc in Spanish Vertisol. Soil
and Tillage Research,98(2), 100-107.
Sorato, R. P., & Crusciol, C. A. C. (2008). Black oat phytomass and nutrient accumulation as affected by surface application of lime and phosphogypsum during establishment of no-tillage system. Ciência
Rural, 38(4), 928-935.
Shuman, L. M., & McCracken, D. V. (1999a). Tillage, lime and poultry litter effects on soil zinc, manganese, and copper. Communication in Soil Science and Plant
Analysis, 30(9-10), 1267-1277.
Shuman, L. M., & McCracken, D. V. (1999b). Tillage and poultry litter effects on plant concentrations of zinc, manganese, and copper. Journal of Plant Nutrition,
22(3), 609-620.
Teixeira, I. R., Souza, C. M., Borém, A., & Silva, G. F. (2003). Variação dos valores de pH e dos teores de carbono orgânico, cobre, manganês, zinco e ferro em profundidade em argisssolo vermelho-amarelo, sob diferentes sistemas de preparo do solo. Bragantia,
62(1), 119-126.
Tisdale, S. L., Nelson, W. L., & Beaton, J. D. (1985). Soil
Fertility and Fertilizers (4th ed.). New York, NY:
Macmillan.
Thomas, G. A., Dalal, R. C., & Standley, J. (2007). No-till effects on organic matter, pH, cation exchange capacity and nutrient distribution in Luvisol in semi-arid subtropics. Soil and Tillage Research,94(2), 295-304.
Vukasinovic, I. Z., Todorovic, D. J., Dordevic, A. R., & Rajkovic, M. B. (2015). Depth distribution of available micronutrients in cultivated soil. Journal of Agricultural
Sciences, 60(2), 177-187.
Walters, D. T., Aulakh, M. S., & Doran, J. W. (1992). Effects of aeration, legume residue and texture on transformations of macro and micronutrients in soils.
Soil Science, 153(2), 100-107.
Received on January 22, 2016. Accepted on July 30, 2016.