DRYING KINETICS
Modelagem matemática da cinética de secagem de semente de laranja
Daniele Penteado Rosa1, Denis Cantú-Lozano2, Guadalupe Luna-Solano2,
Tiago Carregari Polachini3, Javier Telis-Romero3
ABSTRACT
Drying of orange seeds representing waste products from juice processing was studied in the temperatures of 40, 50, 60 and 70 °C and drying velocities of 0.6, 1.0 and 1.4 m/s. Experimental drying kinetics of orange seeds were obtained using a convective air forced dryer. Three thin-layer models: Page model, Lewis model, and the Henderson-Pabis model and the diffusive model were used to predict the drying curves. The Henderson-Pabis and the diffusive models show the best fitting performance and statistical evaluations. Moreover, the temperature dependence on the effective diffusivity followed an Arrhenius relationship, and the activation energies ranging from 16.174 to 16.842 kJ/mol.
Index terms: Dehydration; diffusive model; Henderson-Pabis model; moisture content.
RESUMO
A secagem de sementes de laranja que representam produtos residuais do processamento de suco foi estudada nas temperaturas de 40, 50, 60 e 70 °C e velocidades de secagem de 0,6, 1,0 e 1,4 m/s. As cinéticas de secagem experimental de sementes de laranja foram obtidas utilizando um secador de ar forçado por convecção. Três modelos de camada fina: modelo de Page, modelo Lewis, e o modelo de Pabis e o modelo difusivo foram utilizados para prever as curvas de secagem. Os modelos de Henderson-Pabis e difusivo mostraram o melhor desempenho adequado e avaliações estatísticas. Além disso, a dependência da temperatura na difusividade efetiva seguida a relação de Arrhenius, e as energias de ativação variam entre 16,174-16,842 kJ / mol.
Termos de indexação: Desidratação; modelo difuso; modelo Henderson-Pabis; teor de umidade.
INTRODUCTION
Orange oil is one of the good vegetable oils that have been developed rapidly in many parts of world such as Brazil. The orange seed oil has high amounts of unsaturated fatty acids (69%) and essential fatty acids (linoleic + linolenic). Linoleic acid is the major fatty acid present (38.4%), followed by oleic (26.0%), palmitic (29.5%), and stearic acids (5.3%) (El-Adawy; Taha, 2001). The high temperatures and long drying periods of seeds may have deleterious effects on the quality of the oil obtained from the seeds. Careful control of moisture is critical for quality assurance of dry foods during storage. For safe storage, the moisture content of the harvested orange oil seeds needs to be reduced to less than 8% in dry basis (Doijode, 2001).
Convective drying is a widely used technology and adequate for sub-products, as it is usually employed with dehydration of fruits and vegetables. Drying is
a complex process in which simultaneous heat and mass transfer phenomena contribute to moisture removal leading to substantial reduction in mass and volume product minimizing packaging, storage and transportation costs (Vega-Gálvez et al., 2010). Modeling of drying process brings mathematical as well as physical insight into the process; many studies have been devoted to analyzing the different aspects of this phenomenon. The principle of modeling is based on having a set of mathematical equations that can adequately characterize the system. A ‘good’ drying model should be simple, accurate, robust and able to capture major physics during drying; at the same time the model should require short computational time, favorable for quick decision-making in industry (Barati; Esfahani, 2011). Since knowledge of the moisture distribution inside the solid during ripening is of vital importance for the control of the process and the quality of the product, mathematical models to predict moisture
1Universidade Estadual Paulista “Júlio de Mesquita Filho”/UNESP – Departamento de Engenharia e Tecnologia de Alimentos – Rua Cristóvão
Colombo – 2265 – Jardim Nazareth – 15054-000 – São José do Rio Preto – SP – Brasil – [email protected]
2 Instituto Tecnologico de Orizaba – Division de Estudios de Posgrado e Investigación – Orizaba – México
3Universidade Estadual Paulista “Júlio de Mesquita Filho”/UNESP – Departamento de Engenharia e Tecnologia de Alimentos – São José do Rio
Preto – SP – Brasil
distribution during drying have been proposed. Thus, the aims of this research were to formulate and validate a mathematical model representative of orange seeds in a thin-layer drier.
MATERIAL AND METHODS
Raw material and sample preparation
Orange seeds (C. sinensis cv. Brazilians) used to the experimental procedures were obtained directly from fruit juice production lines of industries in São José do Rio Preto, SP, Brazil. The seeds were manually separated from the waste and washed with distilled water to remove the remaining pomace. The raw material was stored at 5 °C prior to analysis.
Experimental drying kinetics
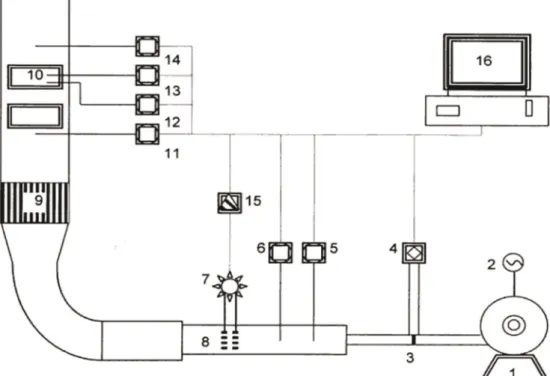
A pilot scale convective dryer (Figure 1) provided
with three sections i.e., an airflow rate control system, a
drying air heating section, and a drying chamber was used
to determine the drying kinetic of orange seeds. The drier was equipped with a process control system based on Fieldbus technology (SMAR Industrial Equipment Ltda., Sertãozinho, Brazil). The dryer was previously described elsewhere (Nicoleti; Telis-Romero; Telis, 2001).
Drying of orange seeds was carried according to the method Cantu-Lozano et al. (2103), using temperatures of 40, 50, 60 and 70 °C and air dry velocities of 0.6, 1.0 and 1.4 m/s. Temperatures were chosen carefully to avoid damages to the oil in orange seeds. Drying was stopped when the weight of the test sample reached a constant value. Moisture contents at each time interval was calculated in dry basis (d.b.) from both weight loss data and dry solid weight of the sample, determined at the beginning of drying by vacuum oven according to the AOAC 934.06 method (Association Of Analytical Communities - AOAC, 1997). At the end of each test, the relative humidity (RH) was recorded to calculate the water activity (aw) through the relationship aw=RH/100.
Drying kinetic modeling and statistical analysis
Experimental drying curves of orange seeds were modeled using the thin-layer models of Page (Equation 1), Lewis (Equation 2), and the Henderson-Pabis model (Equation 3).
the analytical solution for spherical geometry (Crank, 1975), as followed (Equation 6):
(3)
β1
e
i e
x x
M exp kt
x x
e i e x xM exp kt
x x
e 2 i e x xM β exp kt
x x (1) (2)
where M represents the unaccomplished moisture content or moisture ratio (dimensionless), x is the moisture at any time (t, s) during drying (kg/kg, d.b.), xi is the initial moisture content (kg/kg, d.b.), xe is the equilibrium moisture content (kg/kg, d.b.), k is the drying rate constant
(1/s) and β1 and β2 are the constants (dimensionless) (Kaleemullah; Kailappan, 2006; Roberts; Kidd; Padilla-Zakour, 2008). The equilibrium moisture content (xe) was
calculated from the fitting sorption isotherm values through
the Oswin model (Equation 4) (corrected values) (Rosa; Villa-Vélez; Telis-Romero, 2013).
(4)
1 2.668 -4
0.169 4.346 10 w
e w a x T 1 a
where aw is the water activity (dimensionless).
Also, the diffusive model (Equation 5) was used to describe the mass transport during the drying process (Sablani; Rahman; Al-Habsi, 2000; Brovchenko; Oleinikova, 2008). (5)
eff M D M t where Deff is the effective moisture diffusivity representing the conductive term of all moisture transfer mechanism (m/ s2). Based on the assumptions of uniform initial moisture distribution, negligible external, negligible temperature gradients, negligible shrinkage during drying and constant
diffusion coefficient, the Equation 5 can be solved using
where n is the number of terms in the series and r is the equivalent radius of the material (m2).
The effective moisture diffusivity (Equation 7) can be related with the temperature by the Arrhenius relationship:
(6)
6 2 2 eff
e
2 2 2
n 1
i e
D t
x x 1
M exp n π
x x n π r
(7) a eff 0 ED D exp
RT
where D0 is the pre-exponential factor of the Arrhenius equation (m2/s), Ea is the activation energy (kJ/mol), R is the universal gas constant (8.314×10⁻³ kJ/mol K) and T is the absolute air dry temperature (K) (Lopez et al., 2000).
Non-linear regression analysis of the empirical and theoretical drying kinetic models were carried out using the “nlinfit” and “nlparci” function of the Statistic Toolbox of Matlab® 7.1 (The MathWorks Inc., Natick,
MA, USA) considering the robust fitting option. Also,
the “lillietest” function was used to determine, if the residuals followed a normal distribution. The adjusted
coefficient of determination (R2
adj) and the mean relative error (MRE) were used to evaluate the goodness of fit and accuracy of the estimation, respectively. The statistical term R2
adj (Equation 8), also known as the explained
variation, adjusts the coefficient of determination based
on the number of model parameters, and is the criterion
that defines how successful the model is in explaining
the variation of the experimental data. Thus it is a good
indicator of the quality of fit when one compares models
that have different numbers of fitted coefficients. In addition, the MRE (Equation 9) was the criterion used to evaluate the accuracy of the estimations. A model with a value for MRE below 15 % is considered to have good accuracy (Sablani; Baik; Marcotte, 2002).
2 2 1
1 1 adj a R R a b 1 * 100 a i Y Y MRE
a Y
(8)
In Equations 8 and 9, Y is the experimental data, Y* is the calculated data from the regression, b is the number of parameters in the model, a is the number of experimental data points used in the regression analysis and R2 is the
coefficient of determination.
RESULTS AND DISCUSSION
Experimental drying kinetics
The time required to dry orange seeds from an initial moisture content of around 1.022 kg/kg, d.b.
to the final moisture content of around 0.063 kg/kg,
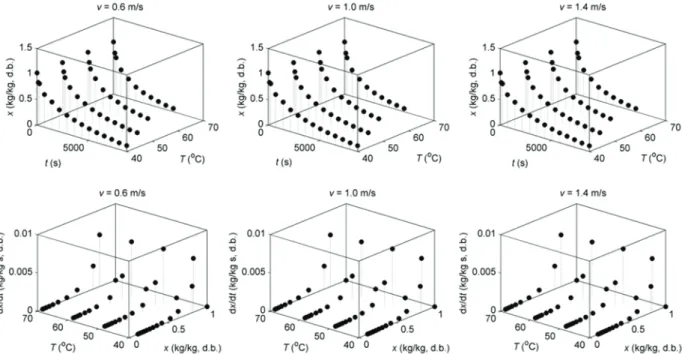
d.b. (all drying velocities) was 8640 s (2.4 h), 7200 s (2.0 h), 5760 s (1.6 h) and 5760 s (1.6 h) at the drying temperatures of 40, 50, 60 and 70 °C, respectively. The time of drying for orange seeds was faster compared to other seeds such as grape seeds (4.6 h) (Roberts; Kidd; Padilla-Zakour, 2008), cuphea seeds (3.7 h) (Cermak et al., 2005) and amaranth seeds (3.1 h) (Abalone et al., 2006). Curves of moisture content versus drying time and the drying rate versus moisture content of orange seeds for the different drying air temperatures and velocities are shown in Figure 2.
In Figure 2, the moisture content reduces exponentially as the drying time increased. In these curves, an increase of drying rate, given by the curve
slope, with increase in temperature was observed, being consistent with the reported in literature for this product (Roberts; Kidd; Padilla-Zakour, 2008; Kaleemullah; Kailappan, 2006). On the other hand, orange seeds did not exhibit a constant rate period of drying, observing only the falling rate period, behavior was also observed by Cantu-Lozano et al. (2013) in study with grapefruit seed. The drying rate was slightly more for oranges seeds dried at higher temperature than the orange seeds dried at lower temperatures for the same average moisture content. According to Kallemullah and Kailappan (2006) at higher temperatures the relative humidity of the drying air was less compared to drying air at lower temperatures. Because of this, the difference in the partial vapour pressure between orange seeds and the surrounding higher temperature drying air environment was more compared to the difference in partial vapour pressure between orange seeds and the surrounding lower temperature drying air environment. Hence, the moisture transfer rate was more with higher temperature drying air.
Mathematical modelling of drying kinetics
The three thin-layer models expressed by Equations 1 and 3 were applied to describe the drying kinetics of
orange seeds through the fit to the experimental data.
The drying parameters k and β1 in Equation 1, k in Equation 2, and k and β2 in Equation 3 were determined for each drying test. Modelling results and statistical validation are shown in Tables 1 and 3. There was an increased observed in Tables 2 and 3, increase of the parameter k when the temperature increases for each drying velocity level. Already for the Page model (Table 1) close values of k parameter were found.
In general terms, the three models presented similar behavior with respect to the temperature, being consistent with the reported by Roberts, Kidd and Padilla-Zakour (2008) for grape seeds, Doymaz (2007) for pumpkin slices and Dandamrongrak, Young and Mason (2002) for banana.
To assess the adequacy of each model, the R2 adj and MRE were used to compare the performance of the Page, Lewis and Henderson–Pabis models.
Results of R2
adj (values above 0.960) showed a good assessment of the three models to represent the drying curves but, when the performance of the modelling was evaluated with the MRE, the Page and the Lewis model showed poor correlation between the experimental and calculated data (values above 15 %).
Only the Henderson-Pabis model showed a good fitting
result for both statistical terms (R2
adj> 0.978 and MRE< 10.171 %). Closed curves between the experimental and calculated data using the Henderson-Pabis model can be observed in Figure 3.
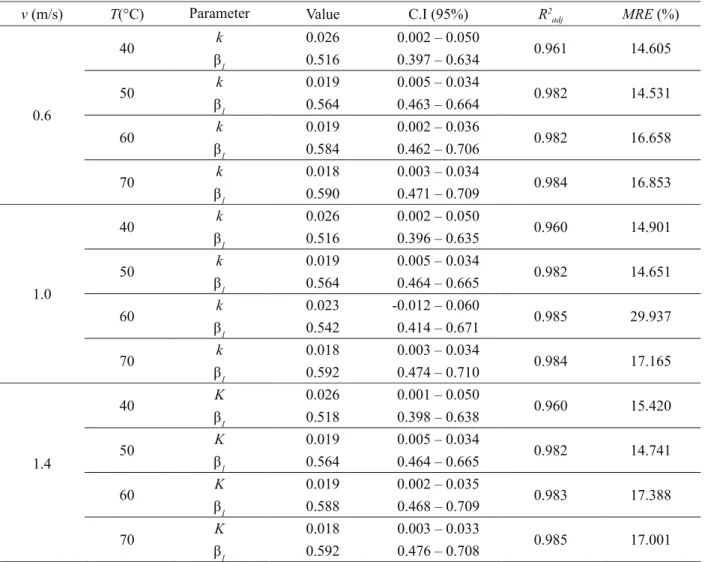
Table 1: Parameter results of the thin-layer Page model.
v (m/s) T(°C) Parameter Value C.I (95%) R2
adj MRE (%)
0.6
40 k 0.026 0.002 – 0.050 0.961 14.605
β1 0.516 0.397 – 0.634
50 k 0.019 0.005 – 0.034 0.982 14.531
β1 0.564 0.463 – 0.664
60 k 0.019 0.002 – 0.036 0.982 16.658
β1 0.584 0.462 – 0.706
70 k 0.018 0.003 – 0.034 0.984 16.853
β1 0.590 0.471 – 0.709
1.0
40 k 0.026 0.002 – 0.050 0.960 14.901
β1 0.516 0.396 – 0.635
50 k 0.019 0.005 – 0.034 0.982 14.651
β1 0.564 0.464 – 0.665
60 k 0.023 -0.012 – 0.060 0.985 29.937
β1 0.542 0.414 – 0.671
70 k 0.018 0.003 – 0.034 0.984 17.165
β1 0.592 0.474 – 0.710
1.4
40 K 0.026 0.001 – 0.050 0.960 15.420
β1 0.518 0.398 – 0.638
50 K 0.019 0.005 – 0.034 0.982 14.741
β1 0.564 0.464 – 0.665
60 K 0.019 0.002 – 0.035 0.983 17.388
β1 0.588 0.468 – 0.709
70 K 0.018 0.003 – 0.033 0.985 17.001
β1 0.592 0.476 – 0.708
k: drying rate of Page model (1/s), β1: parameter of the Page model (dimensionless), v: drying velocity (m/s), and C.I: confidence
Table 2: Parameter results of the thin-layer Lewis model.
v (m/s) T(°C) k C.I (95%) R2
adj MRE (%)
0.6
40 6.505×10⁻⁴ 4.246×10⁻⁴ – 8.765×10⁻⁴ 0.972 24.164
50 7.906×10⁻⁴ 5.261×10⁻⁴ – 1.055×10⁻³ 0.977 26.254
60 1.050×10⁻³ 6.565×10⁻⁴ – 1.444×10⁻³ 0.976 25.004
70 1.075×10⁻³ 6.781×10⁻⁴ – 1.472×10⁻³ 0.976 25.110
1.0
40 6.660×10⁻⁴ 4.293×10⁻⁴ – 8.908×10⁻⁴ 0.971 23.927
50 7.942×10⁻⁴ 5.284×10⁻⁴ – 1.060×10⁻³ 0.977 26.182
60 1.063×10⁻³ 6.664×10⁻⁴ – 1.459×10⁻³ 0.976 24.775
70 1.094×10⁻³ 6.898×10⁻⁴ – 1.498×10⁻³ 0.976 25.250
1.4
40 6.743×10⁻⁴ 4.375×10⁻⁴ – 9.111×10⁻⁴ 0.970 23.613
50 7.950×10⁻³ 5.287×10⁻⁴ – 1.061×10⁻³ 0.977 26.173
60 1.066×10⁻³ 6.704×10⁻⁴ – 1.461×10⁻³ 0.976 24.717
70 1.074×10⁻³ 6.819×10⁻⁴ – 1.467×10⁻³ 0.976 25.214
k: drying rate of Lewis model (1/s), v: drying velocity (m/s), and C.I: confidence intervals of the fitting modelling α=95%.
According to Bonazzi, Broyart and Courtois (2009) the Henderson-Pabis model has been used extensively for characterizing thin layer drying of cereals, oilseeds, and ear corn, due to it kinetic parameter to represent the dependence between the moisture content and the air temperature (T). In this case, the temperature dependence was observed with the linear increase of k parameter with respect to the temperature (Table 3). Thus, this model is accepted to describe mathematically the relationship between the drying kinetic of orange seeds (moisture content and drying time) with a certain physical level.
For a better physical understanding of the mass transfer occurring in the drying process of orange seeds, the diffusive model (Equation 5) was employed. To implement the diffusive model, boundary conditions (described previously) and experimental conditions (Table 4) were applied. Although these conditions, the initial moisture content (xi = 1.022 kg/kg, d.b.) and the average diameter (dp = 8.30 mm; r =4.15 mm), determined by sieve test at the moisture content level of 1.020 kg/kg, d.b., were kept constants in the modelling.
Results of the fitting modeling with diffusive model are
shown in Table 4.
In Table 5, the statistical values of R2
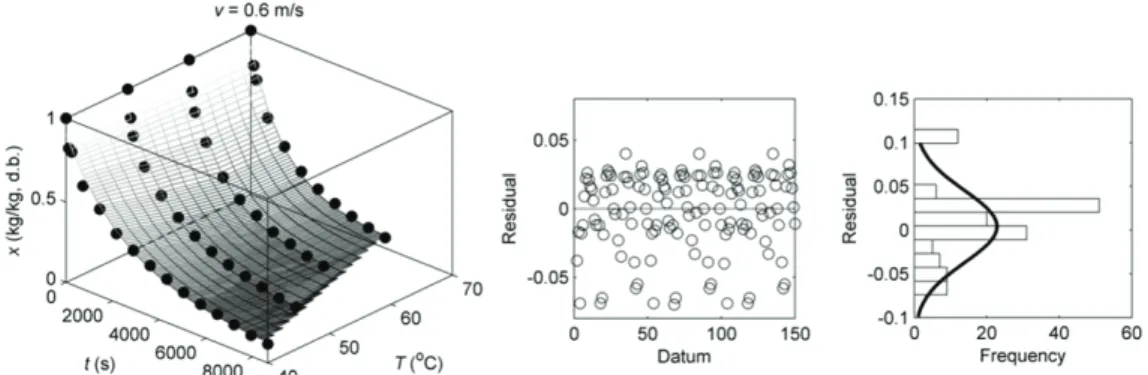
adj> 0.997 and MRE < 11.920 % show a good accuracy of the model prediction and the closeness between experimental and calculated data, respectively. Graphical representation of the accuracy of diffusive model as well as the residual analysis is shown in Figure 4.
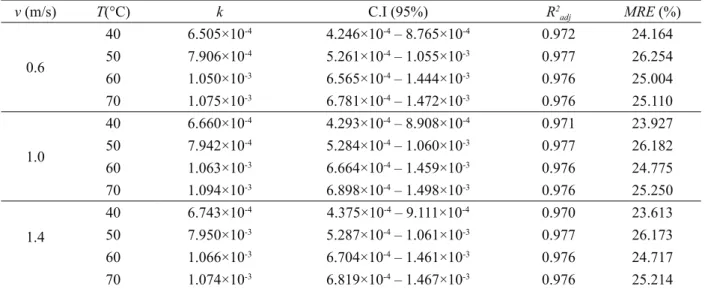
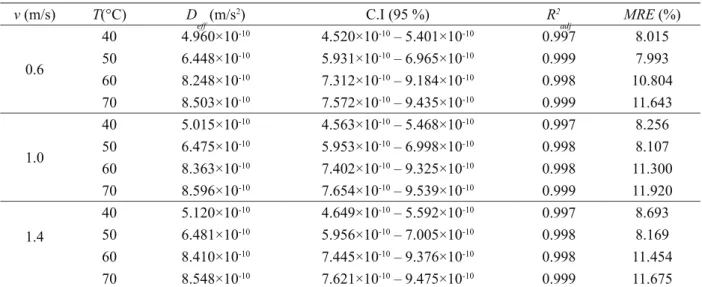
Values of the effective moisture diffusivity (Deff) ranging from 4.960×10⁻¹⁰ to 8.596×10⁻¹⁰ m/s2 in the temperature range of 40 – 70 °C and drying velocities of 0.6 – 1.4 m/s. Similar values were found in products such as grapefruit seeds (Cantú-Lozano et al., 2013) and grape seeds (Roberts; Kidd; Padilla-Zakour, 2008). Also, the Deff increase when the temperature increases for each drying velocity level.
The effective diffusivities depend on the drying air temperature besides variety and composition of material (Rizvi, 2005). According Kartika et al. (2012) the chemisorption on polar groups as the lipids and aromatic compounds can affect the effective moisture diffusivity. With increasing temperatures more hydrophilic sites increases and the migration of water from inside of orange seeds to the surface occurs. It also, was reported that at temperatures of 70 °C the heat of sorption decreased as the moisture content increased, reaching to the water vaporization energy at x over 0.050 kg/kg, d.b. (Rosa; Villa-Vélez; Telis-Romero, 2013), value similar to obtained in the drying tests.
Table 3: Parameter results of the thin-layer Henderson-Pabis model.
v (m/s) T(°C) Parameter Value C.I (95%) R2
adj MRE (%)
0.6
40 K 4.087×10
-4 3.550×10⁻⁴– 4.624×10⁻⁴
0.982 6.512
β2 0.723 0.679 – 0.767
50 K 5.337×10
-4 4.416×10⁻⁴– 6.259×10⁻⁴
0.978 8.358
β2 0.776 0.718 – 0.835
60 K 7.011×10
-4 5.562×10⁻⁴– 8.459×10⁻⁴
0.978 9.482
β2 0.787 0.721 – 0.854
70 K 7.219×10
-4 5.730×10⁻⁴– 8.707×10⁻⁴
0.979 9.926
β2 0.791 0.726 – 0.857
1.0
40 K 4.132×10
-4 3.587×10⁻⁴– 4.676×10⁻⁴
0.982 6.643
β2 0.722 0.678 – 0.766
50 K 5.361×10
-4 4.435×10⁻⁴– 6.286×10⁻⁴
0.978 8.439
β2 0.776 0.718 – 0.835
60 K 7.112×10
-4 5.631×10⁻⁴– 8.593×10⁻⁴
0.978 9.676
β2 0.789 0.723 – 0.856
70 K 7.303×10
-4 5.789×10⁻⁴– 8.172×10⁻⁴
0.979 10.124
β2 0.793 0.727 – 0.859
1.4
40 K 4.213×10
-4 3.653×10⁻⁴– 4.772×10⁻⁴
0.982 6.805
β2 0.722 0.678 – 0.766
50 K 5.364×10
-4 4.435×10⁻⁴– 6.293×10⁻⁴
0.978 8.426
β2 0.776 0.718 – 0.835
60 K 7.152×10
-4 5.659×10⁻⁴– 8.646×10⁻⁴
0.978 9.727
β2 0.791 0.724 – 0.858
70 K 7.257×10
-4 5.749×10⁻⁴– 8.764×10⁻⁴
0.979 10.171
β2 0.794 0.728 – 0.861
k: drying rate of Henderson-Pabis model (1/s), β2: parameter of the Henderson-Pabis model (dimensionless), v: drying velocity
(m/s), and C.I: confidence intervals of the fitting modelling α=95%.
Table 4: Experimental conditions of drying for diffusive model application.
v (m/s) T (°C) RH (%) aw xe
0.6
40 11.9 0.119 0.105
50 11.3 0.113 0.068
60 11.0 0.110 0.066
70 10.6 0.106 0.063
1.0
40 11.7 0.117 0.106
50 11.0 0.110 0.068
60 10.8 0.108 0.065
70 10.4 0.104 0.062
1.4
40 11.5 0.115 0.106
50 11.0 0.110 0.068
60 10.3 0.103 0.064
70 10.1 0.101 0.061
v: drying velocity (m/s), RH: relative humidity of air drying, aw: water activity and xe: calculated equilibrium moisture content from Oswin model (kg/kg, d.b.).
Table 5: Effective diffusive coefficient results of drying kinetics of orange seeds.
v (m/s) T(°C) D
eff (m/s
2) C.I (95 %) R2
adj MRE (%)
0.6
40 4.960×10⁻¹⁰ 4.520×10⁻¹⁰ – 5.401×10⁻¹⁰ 0.997 8.015
50 6.448×10⁻¹⁰ 5.931×10⁻¹⁰ – 6.965×10⁻¹⁰ 0.999 7.993
60 8.248×10⁻¹⁰ 7.312×10⁻¹⁰ – 9.184×10⁻¹⁰ 0.998 10.804
70 8.503×10⁻¹⁰ 7.572×10⁻¹⁰ – 9.435×10⁻¹⁰ 0.999 11.643
1.0
40 5.015×10⁻¹⁰ 4.563×10⁻¹⁰ – 5.468×10⁻¹⁰ 0.997 8.256
50 6.475×10⁻¹⁰ 5.953×10⁻¹⁰ – 6.998×10⁻¹⁰ 0.998 8.107
60 8.363×10⁻¹⁰ 7.402×10⁻¹⁰ – 9.325×10⁻¹⁰ 0.998 11.300
70 8.596×10⁻¹⁰ 7.654×10⁻¹⁰ – 9.539×10⁻¹⁰ 0.999 11.920
1.4
40 5.120×10⁻¹⁰ 4.649×10⁻¹⁰ – 5.592×10⁻¹⁰ 0.997 8.693
50 6.481×10⁻¹⁰ 5.956×10⁻¹⁰ – 7.005×10⁻¹⁰ 0.998 8.169
60 8.410×10⁻¹⁰ 7.445×10⁻¹⁰ – 9.376×10⁻¹⁰ 0.998 11.454
70 8.548×10⁻¹⁰ 7.621×10⁻¹⁰ – 9.475×10⁻¹⁰ 0.999 11.675
Deff: effective moisture diffusivity (m2/s), v: drying velocity (m/s), and C.I: confidence intervals of the fitting modelling α=95%.
7 16762.2
3.229 10 eff
D exp
RT
7 16842.2
3.359 10 eff
D exp
RT
(12) (10)
(11)
7 16174.1
2.643 10 eff
D exp
RT
The equations above showed values of R2 adj = 0.965 for v = 0.6 m/s, R2
adj = 0.964 for v = 1.0 m/s and R2
Figure 4: Dependence of the moisture content (x) of orange seeds on time (t) and on temperature (T), and graphical residual analysis between experimental x and x calculated by diffusive model.
CONCLUSIONS
Experimental drying kinetics of orange seeds was carried out at temperatures of 40 – 70 °C and drying velocities of 0.6, 1.0 and 1.4 m/s. Three thin-layers models (Page, Lewis and Henderson-Pabis) and the diffusive
model (spherical coordinate) were employed to fit the
drying curves. Statistical results showed the Henderson-Pabis model as the best thin-layer model to represent the drying kinetic of orange seeds (R2
adj> 0.978). Moreover, the diffusive model presented good performance (R2
adj> 0.997) to describe the mass transfer process occurring in the drying of orange seeds. Values of the effective moisture diffusivity ranging from 4.960×10⁻¹⁰ to 8.596×10⁻¹⁰ m/s2 in the temperature range of 40 – 70 °C and drying velocities of 0.6 – 1.4 m/s. Finally, the temperature dependence of the effective diffusivity showed an Arrhenius relationship, where the activation energy was determined observing
poor influence by the drying velocity in the process.
ACKNOWLEDGEMENT
The authors gratefully acknowledge the financial
support received from FAPESP (Process Number 2009/11675-3).
REFERENCES
ABALONE, R. et al. Thin layer drying of amaranth seeds. Biosystems Engineering. 93(2):179-188, 2006.
ASSOCIATION OF ANALYTICAL COMMUNITIES - AOAC. Official methods of analysis, Gaithersburg. AOAC International. 1997.
BARATI, E.; ESFAHANI, J.A. A new solution approach for simultaneous heat and mass transfer
during convective drying of mango. Journal of Food Engineering. 102(4):302-309, 2011.
BONAZZI, C.; BROYART, B.; COURTOIS, F. Dryer modeling. In: RATTI, C. Advances in food dehydration. New York: Taylor & Francis Group, 2009. p. 1-488.
BROVCHENKO, I.; OLEINIKOVA, A.
Interfacial and confined water. Oxford: Elsevier, 2008. 317 p.
CANTU-LOZANO, D. et al. Sorption isotherms and drying kinetics of grapefruit seeds. Acta Scientiarum. Technology. 35(4):717-723, 2013.
CERMAK, S.C. et al. Batch drying of cuphea seeds.
Industrial Crops and Products. 21(3):353-359, 2005.
CRANK, J. The mathematics of diffusion. London: Oxford University Press, 1975. 1 p.
DANDAMRONGRAK, R.; YOUNG, G.; MASON, R. Evaluation of various pre-treatments for the dehydration of banana and selection of suitable drying models. Journal of Food Engineering. 55(2):139-146, 2002.
DOIJODE, S.D. Seed Storage of Horticultural Crops. New York: Food Products Press, 2001. 357 p.
EL-ADAWY, T.A.; TAHA, K.M. Characteristics and
composition of different seed oils and flours. Food
Chemistry. 74(1):47-54, 2001.
KALEEMULLAH, S.; KAILAPPAN, R. Modelling of thin-layer drying kinetics of red chillies. Journal of Food Engineering. 76(4):531-537, 2006.
KARTIKA, I.A. et al. Moisture sorption behaviour of jatropha seeds (Jatropha curcas) as a source of vegetable oil biodiesel production. Biomass and Bioenergy. 36(2012):226-233, 2012.
LOPEZ, A. et al. Thin-layer drying behavior of vegetable wastes from wholesale market. Drying Technology. 18(4-5):995-1006, 2000.
NICOLETI, J.F.; TELIS-ROMERO, J.; TELIS, V.R.N. Air-drying of fresh and osmotically pretreated
pineapple slices: fixed air temperature versus fixed
slice temperature drying kinetics. Drying Technology. 19(9):2175-2191, 2001.
RIZVI, S.S.H. Thermodynamic Properties of Foods in Dehydration. In: RAO, M.A.; RIZVI, S.S.H.; DATTA, A.K. Engineering Properties of Foods. Boca Raton: Taylor & Francis Group, p. 1-88. 2005.
ROBERTS, J.S.; KIDD, D.R.; PADILLA-ZAKOUR, O. Drying kinetics of grape seeds. Journal of Food Engineering. 89(4):460-465, 2008.
ROSA, D.P.; VILLA-VÉLEZ, H.A.; TELIS-ROMERO, J. Study of the enthalpy-entropy mechanism from water sorption of orange seeds (C. sinensis cv. Brazilian) for the use of agro-industrial residues as a possible source of vegetable oil production. Ciência e Tecnologia de Alimentos. 33:95-101, 2013.
SABLANI, S.; RAHMAN, S.; AL-HABSI, N. Moisture diffusivity in foods. An overview. In:
MUJUMDAR, A.S. Drying technology in agriculture and food sciences. Enfield: Science Publishers, Inc,
2000.
SABLANI, S.S.; BAIK, O.D.; MARCOTTE, M. Neural networks for predicting thermal conductivity of bakery products. Journal of Food Engineering. 52(3):299-304, 2002.