2016 | Lavras | Editora UFLA | www.editora.ufla.br | www.scielo.br/cagro
All the contents of this journal, except where otherwise noted, is licensed under a Creative Commons Attribution License attribuition-type BY.
Study of costs and revenue from the production and practice
laboratories of the Federal Institute of Science and Technology
of Minas Gerais -
Campus
Bambuí
Estudo dos custos e receitas de laboratórios de produção e prática do Instituto Federal
de Ciência e Tecnologia de Minas Gerais - Campus Bambuí
Uellington Corrêa1*,Gideon Carvalho de Benedicto1,Francisval de Melo Carvalho1, Renato Silvério Campos1,Marcos Aurélio Lopes2, Bruna Pontara Vilas Boas Ribeiro3
1Universidade Federal de Lavras/UFLA, Departamento de Administração e Economia/DAE, Lavras, MG, Brasil 2Universidade Federal de Lavras/UFLA, Departamento de Medicina Veterinária/DMV, Lavras, MG, Brasil 3Universidade Federal de Lavras/UFLA, Departamento de Zootecnia/DZO, Lavras, MG, Brasil
*Corresponding author: uellington.correa@gmail.com Received in september 1, 2015 and approved in february 1, 2016
ABSTRACT
The management of costs is used as a performance indicator by private companies in various sectors and, more recently, in public
institutions, which offer free products and services to society. This article aimed to analyze the costs and revenues generated from the Production and Practice Labs (PPL) of Dairy Cattle and Dairy Products Processing from IFMG Campus Bambuí, to check the contribution of the revenues generated by these laboratories in reducing dependence on federal funds used to support these activities. The study was delimited with an investigation of the time series monthly revenues, costs and expenses of PPL analyzed from January 2012 to June 2014. The methodology used to determine the costs of Dairy Cattle production, was the operating cost and Dairy Products Processing cost absorption. The results demonstrate that both dairy farming as dairy products processing activity depended on federal funds to support them throughout the study period. The econometric analysis showed that domestic consumption revenue of Dairy Cattle PPL
(domestic consumption of fresh dairy + animals for slaughter) was significant at 1% to reduce dependence on federal funds. Therefore is seems that for every increase in R$ 1.00 in the revenue of internal consumption from the dairy cattle lab reduced the deficit or transfer
by the federation in R$ 1.32.
Index terms: Cost management; dairy production; dairy processing; public sector.
RESUMO
A gestão dos custos é utilizada como indicador de desempenho por empresas privadas de vários segmentos e, mais recentemente, em instituições públicas, que oferecem produtos e serviços gratuitos à sociedade. Este artigo teve por objetivo analisar os gastos e as receitas geradas pelos Laboratórios de Produção e Prática (LPP) de Bovinocultura de Leite e de Processamento de Leite e Derivados do IFMG
Campus Bambuí, de modo a verificar qual a contribuição das receitas geradas por estes laboratórios para diminuir a dependência de
recursos da União que subsidiam as suas atividades. O estudo foi delimitado com uma investigação da série temporal mensal de receitas, custos e despesas dos LPP analisados, entre o período de janeiro de 2012 a junho de 2014. A metodologia utilizada para apurar os custos da Bovinocultura Leiteira foi a do custo operacional e da atividade de Processamento de Leite e Derivados foi a do custeamento por absorção. Os resultados da pesquisa demonstram que tanto a atividade leiteira como a atividade de processamento de leite e derivados depende de recursos da União para subsidiar suas atividades ao longo de todo o período de estudo. A análise econométrica demonstrou que a receita de consumo interno do LPP de Bovinocultura (consumo interno de leite in natura + animais para abate) foi significativa a
1% para reduzir a dependência de recursos da União. Assim, infere-se que a cada aumento de R$ 1,00 na receita de consumo interno do LPP de Bovinocultura diminuiu o déficit ou repasse da União em R$ 1,32.
Termos para indexação: Gestão de custos; atividade leiteira; processamento de leite; setor público.
INTRODUCTION
Costs in the activities that make up a production system are fundamental in any sector of the economy, whether in the commercial, industrial or service sector. Thus, management of costs is used as a performance indicator by private companies in various sectors, be
it small, medium or large and, more recently, in public institutions, which offer free products and services to society. Cost management is important so that we can, with the best use of scarce resources, meet the population’s real needs, providing social welfare.
practice should be incorporated, since the efficient and
effective implementation of the work program proposed by the government depends on information related to how much the service costs to the society and how cost management is made (Machado; Holanda, 2010).
The adoption of typical management processes of private organizations (management by objectives, total quality management, decentralized management) by public authorities is a recurring theme in the literature and has engaged many researchers to develop discussions on this theme, such as the Boyne (2002), Meier et al. (2007), Boyne and Walker (2010).
Cost management is also inserted in this context, Zafra-Gómez et al. (2013) state that the interest in the
issue of control of the budget and public deficit increased from the economic and financial crisis that hit the state and reopened the discussion about greater efficiency in
the forms of governance that allow public spending to be reduced (Peters, 2011; López-Hernández; Zafra-Gómez; Ortiz-Rodrigues, 2012).
Slomski (2009) states that in Brazil the study on the cost accounting applied to public administration is at an early stage. It adds further that it is necessary for public sector managers know the activities costs in order to make better management decisions, such as deciding to produce or buy. Between national research related to public cost management, it is observed that there is a questioning in
the studies on the efficiency of public spending, this fact
can be observed in the studies of Machado and Holanda (2010), Magalhães et al. (2010), Rezende, Cunha and Bevilacqua (2010), Cavalcante and Lariu (2012), Borges, Mario and Carneiro (2013), Couto and Coelho (2015).
Since the 60’s the National Coordination of Agricultural Education (COAGRI) implemented implemented the “farm school” a pedagogical oriented practice model with aims to agricultural production in the Agriculture Schools. These schools have been through some changes which led to the Federal Institutes which were implemented by the Law no. 11.892, of 29 December
2008 (Brazil, 2008).
One of the components that make up the organization “school farm” models are the Production and Practice Laboratories (PPL). These are composed by the agricultural sectors: agriculture, animal husbandry, horticulture, food processing (dairy products, meat, fruit processing) and others present in the school’s syllabus.
International literature provides us with studies
related to the analysis of costs, profitability and risk
analysis in the dairy activity in different types of production systems, as studies of Giordano et al. (2011), Berentsen,
Kovacs and Asseldonk (2012), Vibart et al. (2012), Wolf (2012) and O’Hara and Parsons (2013), among others.
In the national literature, whose research results are closer to the object of this study, we developed research about the economic analysis of dairy farming in different production systems, such as studies of Moura et al. (2010), Lopes et al. (2011), Lopes, Santos and Carvalho (2012) and Silva and Silva (2013). Among these mentioned studies, we can highlight the research Lopes et al. (2011), because it was developed in a research center such as this study.
The authors studied the profitability of dairy production
system of a research center in Varginha region of Minas Gerais. The analysis concluded that the research center of the dairy production system was decapitalizing and accumulating debt.
However, little is discussed in the literature about the amount budgeted and executed by the institutions of the public sector, and the measurement of expenditures for maintenance of the “school farm” model of the Federal Institutes. As measuring spending and revenue control in public service, is no common practice, how much the “farm school” is dependent on the transfer of the Union or the extent to which revenue from the production of PPL contribute to cover their expenses and keep their activities is not known for sure. Thus, this article seeks to answer the following question: what is the behavior of the production costs from the Dairy Cattle and Dairy Products Processing laboratories from IFMG Campus Bambuí over
five semesters. Furthermore how have revenues from
production activities participated in the execution of the maintenance costs of these sectors in order to reduce dependence on federal resources?
The main goal of this research was to analyze costs and revenues generated by Production and Practice Laboratories (PPL) of Dairy Cattle and Dairy Products Processing from January 2012 till June 2014 in order
to find whether there are contributions of the revenues
generated by these laboratories in reducing dependence on federal funds to support these activities.
Cost control at IFMG Campus Bambuí is a major factor in the minimum operational viability of the educational production systems present at the farm schools. These schools have great institutional and social importance because it supplies the school’s restaurant as
well as a sales office, open to the community with prices
below retail market of the study area and region.
market exists and the establishing prices above production
costs is justified by the need for reinvestment in the
production units for its survival and maintenance.
MATERIAL AND METHODS
The approach of this research is characterized as qualitative and quantitative. In this type of research, qualitative information is presented together with quantitative data. Qualitative research is directed along its development and does not seek to enumerate or measure events and generally does not employ statistical instruments for data analysis. Quantitative studies generally seek to follow strictly the prescribed plan,
based on variables that are operational definition of object
(Bryman, 2006; Bryman, 2007; Bryman; Becker; Sempik, 2008; Creswell, 2013). Lunde, Heggen and Strand (2012) argue that by adopting mixed methods research, one acquires the knowledge that would be available not only in quantitative and qualitative studies, conducted separately.
This study is delimited with an investigation of monthly series of revenues, costs and expenses of Production and Practice Labs (PPL) from Dairy Cattle and Dairy Products Processing at IFMG Campus Bambuí. The analysis included the period from January 2012 to June 2014, totaling 30 observations.
Data collection was through document analysis. After collecting data, prices of inputs and products
marketed were deflated based on the Producer Price Index (PPI) for the food industry. This price index reflects the price of economy in December 2009. To deflate the values
Equation 1 was used (Wessels, 2003):
includes the total operating cost (TOC) and the effective operational cost (COE). For Lopes and Carvalho (2000), the effective operational cost refers to the cost of all production resources that require disbursement, while the total operating cost is the sum of COE with other non-payable costs, such as depreciation.
The effective operational cost of dairy farming
at Campus Bambuí includes feed costs, artificial
reproduction, health, milking, federal employees and outsourced employees, electricity, industry maintenance costs and miscellaneous expenses.
Industry revenues are generated by three different sources: sales revenue of dairy production surplus for a dairy industry in the region; Internal Revenue consumption of dairy is received by the dairy processing unit; and revenue from animals that are slaughtered in the institution.
To calculate dairy revenue of domestic consumption the market value in kg/fresh dairy region was considered, while for the recipe of slaughtered animals was considered the market price in live weight with 50% carcass yield.
Economic efficiency indicators evaluated in the
dairy business were calculated from the total revenue (sales fresh dairy + domestic consumption of fresh dairy + slaughtered animals). Thus, gross margin (gross revenue - COE) was measured, net margin (gross
revenue - TOC) and profitability (COE / gross margin)
(Lopes et al, 2004).
The Dairy Cattle Laboratory has an area of 120 hectares devoted to dairy farming, among which 20 hectares are used to produce corn (Zea mays) silage, a built area of 769.96 m2 with classroom, office, kitchen, stables
and milking room, 500 m2 corral with concrete pavement,
trench silo with an area of 240 m2, dairy tank with capacity
for 3,000 liters and a scale to weigh the cattle.
The herd consists of Girolando animals with
different genetic groups. Reproduction is done by artificial
insemination and there are lactating cows, cull cows, calves and heifers (Table 1).
The upbringing system is in semi-intensive in rotational grazing system consisting of Brachiaria decumbens, Panicum maximum (Mombasa grass), Brachiaria brizantha (mg-5) and Cynodon spp. (Tifton 85). Lactating cows receive dietary supplementation with concentrate (feed) corn silage and minerals after milking. The proportion of dry cows and calves receiving only corn silage and minerals, while another part of the offspring receives complementary concentrate, and silage corn and minerals. Lactating cows are milked twice a day, in the morning and afternoon with a milking machine
displayed in a fishbone diagram.
Nominal variable
Real variable = x100
Deflator
(1)
where: Real Variable are deflated prices; Nominal Variable are contained inflation rates; and Deflator is the IPP.
Producer Price Index as a deflator is justified since
this index measures the variation in prices of inputs and production factors. Data assessment was performed using
Microsoft Office Excel® software, spreadsheets developed
specifically for this purpose, and the econometric treatment was through Gretl software - Gnu Regression, Econometrics and Time-series Library (Adkins, 2012).
The Dairy Products Processing PPL from IFMG
Campus Bambuí began operations in 1982. In this PPL
practical classes are held, research development, dairy processing in natura produced in the Dairy Cattle LPP and dairy production that supply the cafeteria as well as the local shop. The unit has built area of 386 m2, with
receiving and product shipment platform, production area and freezer. Its processing capacity is 5,000 kg/dairy/day.
To measure the cost of production of the Dairy Products Processing PPL a cost method for absorption was
adopted. In this method the activity costs were classified into variable and fixed and the expenses as fixed. This way, the
variable costs of the activity and raw material (fresh dairy,
lactic acid, sugar, flavoring, bicarbonate, citrate, calcium
chloride, rennet, dye, yeast, fruit pulp and salt), packaging,
federal and outsourced labor, electricity and firewood.
Whereas fixed costs consist of the cleaning supplies,
depreciation, and the fixed costs of office supplies. The
water consumption costs are not accounted for as spending because the water used comes from local sources.
The dairy products made at the Dairy Products Processing PPL during the analyzed period were: yogurts, pasteurizes dairy, fresh dairy, curd, cheese, mozzarella and ricotta.
In determining the income of the activity two sources were considered: sales revenues of the surplus production; and revenues from domestic production consumption. Thus, for products consumed domestically market price was assigned. To determine the role of own revenue to pay the costs and expenses of the laboratories studied and compare with the transfer of the Union to the Campus, i.e., find what the dependence of federal funds to subsidize the activities of dairy cattle and processing of dairy products, we used
an econometric model by the method of ordinary least squares (OLS) with multiple regression.
According to Wooldridge (2009), by adding more factors to the model that are useful to explain y, then, more y variation can be explained. Thus, the multiple regression analysis can be used to construct the best models to predict dependent variable.
The variables which compose the OLS model are real, i.e., not have econometric treatment. An equation to explain adequately the relationship between the response variable y and the explanatory variables, x1, x2, x3 and x4 (Equation 2) was used:
Animal Cathegory Semester Mean DP1
1 2 3 4 5
Lactating cows 32 37 38 33 34 34.8 2.6
Cull cows 23 59 63 63 57 53.0 17.0
Female Calves 1 to 12 months 30 35 20 13 26 24.8 8.6
Male Calves 1 to 12 months 16 11 19 23 18 17.4 4.4
Heifers 13 to 24 months 22 21 23 7 18 18.2 6.5
Males 13 to 24 months 0 3 2 6 13 4.8 5.1
Cows 25 to 36 months 46 22 20 30 21 27.8 10.9
Bulls 0 0 0 0 0 0.0 0.0
Total 169 188 185 175 187 180.8 8.4
Table 1:Average composition of the herd studies per semester.
Source: Research Data (2015); Legend: DP – Deviation Pattern.
where: Y is the money received by the Union, i.e., the dependent variable, what you want to explain; α is the intercept, the model’s constant, is the value of Y when xi (i=1,…,4.) assumes zero value; βi is the observed change in Y associated with the increase of one unit in xi, i=1,…,4.; x1 assumed to be the sales revenue of the surplus production (fresh dairy for Dairy industry) and for Dairy Cattle PPL; x2 assumed to be the domestic consumption revenue (fresh dairy, more animals for slaughter) of the Dairy Cattle PPL; x3 assumed to be the production of surplus sales revenue (yogurt, pasteurized dairy, fresh dairy, curd, cheese, mozzarella and ricotta) of the Dairy Products Processing PPL; x4 assumed to be the domestic consumption Recipe production (yogurt, pasteurized dairy, fresh dairy, curd, cheese, mozzarella and ricotta) of the PPL of Dairy Products Processing; εt is the error to explain / understand / predict Y from , x1, x2, x3 e x4.
To identify the transfer of value from the Union to Campus Bambuí a proxy was built. Therefore, it was
considered that the results (surplus or deficit) of the dairy
production activities and dairy processing would represent the dependence of federal funds to subsidize these activities. In order to verify that the econometric model used was set and answered the variable of interest (Y) normality residue tests were performed, heteroskedasticity and autocorrelation of the residues. To test the normality hypothesis of the residues Doornik and Hansen (1994) normality test was applied. By this test it is possible to test whether the normality assumption is true (Equation 3). where: Z1 e Z2 were obtained from transformations of asymmetry and kurtosis of the series; and p is the number of variables.
and revenue of animals slaughtered by the institution was not enough to cover the actual operating (COE) and total (TOC) costs of dairy farming at Campus Bambuí. Organic manure generated in the activity was not recorded as revenue, as this was used as a fertilizer on the pastures.
It appears that the profitability indicators (gross
margin, net margin and profitability) were negative throughout the study period. Thus, it can be inferred that the dairy business on Campus is operating based on subsidies transferred by the Union; otherwise the activity would not be sustained in short and long terms.
The percentage of representation of each item of income in relation to total gross revenue is presented in Table 3. The internal consumption of dairy revenue (52.51%) was the most representative on average, followed by sales revenue of the surplus production dairy for industry (28.29%) and revenue of animals slaughtered (19.20%).
From the results in Table 4, it is observed that the average price of kg/dairy (R$ 0.63) is greater than the effective average operating cost of kg/dairy (R$ 1.91) and average total operating cost the kg/dairy (R$ 1.99) over the analysis period.
Through Table 5, developed by the absorption costing method, it is observed that the sources of gross revenues were
insufficient to cover the fixed and variable costs and fixed
expenses of the activity during the review period of this study. The percentage of contribution of each item of income over total gross revenue is presented in Table 6. The source of the surplus production of sales revenue (average
86.06%) contributed the largest share to reduce the deficit of
activity. This is due to the fact that the volume of products sold is greater than the consumed internally, they showed, on average, 13.94% of total gross revenue.
It is inferred from the calculated result, that the activity does not have operational feasibility, and thus depends on the Union’s subsidies to fund and maintain the dairy processing activities. As the productive activities of Dairy Cattle and Dairy Products Processing PPL proved to be loss-making throughout the period of this study, an
OLS model was used by multiple regression to find what
is the level of dependence on federal funds to subsidize the activities. The results are shown in Table 7.
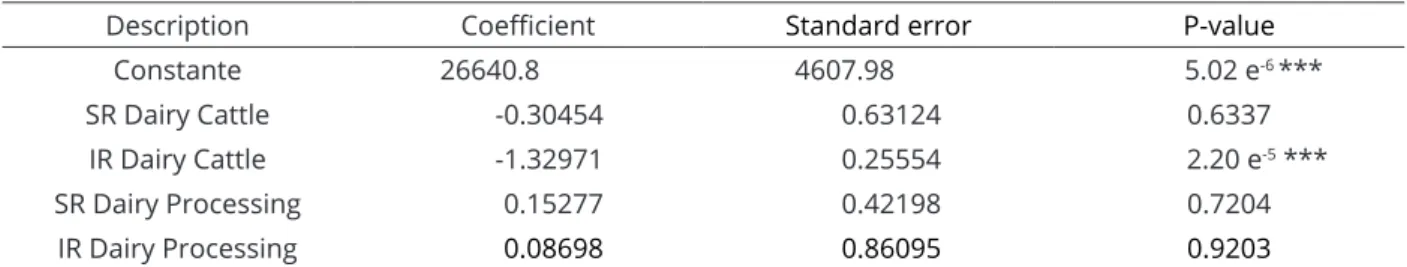
From the results of the OLS model is possible to predict that the sales revenue of PPL production surplus of Cattle (fresh dairy for the industry) and the sale proceeds of surplus production and domestic consumption of Dairy Products Processing LPP (yogurt, pasteurized dairy, fresh dairy, curd, cheese, mozzarella and ricotta) were not
significant to reduce dependence on federal funds that
support the activities of both laboratories.
( )
' ' 2
1 1 2 2 ~ 2
Z Z +Z Z x p
In order to verify the existence of heteroscedasticity in the model the White (1980) test was applied. According to Wooldridge (2009) in the econometric model in which the existence of heteroscedasticity occurs the variance of the unobservable error, conditional on the explanatory variables, is not constant. The White test aims to verify if the model has errors over its function, that is, if there is loss of explanatory power of the variables.
Autocorrelation is determined by the Durbin-Watson test, in which the calculated statistical value d is compared with the lower limit (di) and upper (du) for tabulated values by Durbin and Watson (1950), and Durbin and Watson (1951) as Wooldridge (2009).
According to Miranda and Ferreira (2006) “autocorrelation is set as the correlation of values of a variable at time t with values of the same variable, delayed in time”. When there is autocorrelation, estimates
of the OLS model are not efficient because it does not
have minimum variance and its standard error can be
biased producing tests and incorrect confidence intervals
(Miranda; Ferreira, 2006).
RESULTS AND DISCUSSION
The results are presented in summarized form and is shown accumulated per semester for each study activity. The research period, from January 2012 to June 2014,
consists of five semesters.
Description Semester
1 2 3 4 5
Revenue 44,981.91 55,783.85 57,161.47 69,908.46 72,141.63
Dairy industry 11,102.74 20,351.55 17,961.16 15,460.14 19,280.63
Dairy domestic consumption 25,191.37 28,416.14 34,037.77 36,873.05 31,279.23
Animals slaughtered 8,687.80 7,016.16 5,162.54 17,575.26 21,581.77
Total Operational Costs 149,265.30 151,335.82 147,803.25 154,023.07 145,253.58
Depreciation 5,771.03 5,534.45 6,131.90 5,874.27 5,824.78
Effective Operational Cost 143,494.27 145,801.37 141,671.35 148,148.80 139,428.80
Feed 74,153.09 73,080.75 67,867.46 73,230.40 67,544.33
Reproduction 947.91 497.43 430.22 2,319.76 227.24
Sanity 1,860.89 4,915.11 1,750.11 3,859.58 1,634.02
Milking 1,809.76 2,009.00 2,514.45 1,250.59 4,119.96
Federal Labor 22,245.44 26,692.03 28,969.36 30,379.42 28,931.15
Outsourced labor 40,449.09 36,400.46 38,467.74 35,826.07 35,682.27
Electricity 1,719.24 1,547.16 1,248.90 1,148.33 949.87
Maintanence Costs 21.89 395.89 250.59 9.49 228.02
Miscellaneous expenditure 286.96 263.54 172.52 125.16 111.94
Gross Margin -98,512.37 -90,017.52 -84,509.88 -78,240.34 -67,287.17
Net Margin -104,283.40 -95,551.96 -90,641.78 -84,114.61 -73,111.95
Table 2: Profitability analysis of dairy cattle.
Source: Survey data (2015).
Description Semester Mean DP1
1 2 3 4 5
Dairy industry 24.68 36.48 31.42 22.11 26.73 28.29 5.71
Dairy domestic consumption 56.00 50.94 59.55 52.75 43.36 52.51 6.08
Animals slaughtered 19.32 12.58 9.03 25.14 29.91 19.20 8.62
Total 100.00 100.00 100.00 100.00 100.00
Table 3: Representation of each item in revenue in percentage (%).
Source: Survey data (2015); Legend: 1DP – Deviation Pattern.
Description Semester Mean DP1
1 2 3 4 5
Average price of dairy sale 0.54 0.61 0.68 0.68 0.66 0.63 0.06
Effective operational cost 2.15 1.81 1.85 1.94 1.81 1.91 0.14
Total operational cost 2.24 1.88 1.93 2.01 1.88 1.99 0.15
Table 4: Price (R$) average sales and average costs of production kg/dairy/semester.
Description Semester
1 2 3 4 5
Revenue 65,618.64 60,960.52 64,645.83 76,422.70 68,737.72
Sales revenue 54,927.96 52,514.49 53,268.11 68,487.74 60,769.01
Domestic consumption
Revenue 10,690.68 8,446.03 11,377.71 7,934.97 7,968.71
Variable Costs 76,213.26 75,970.68 82,802.70 86,123.18 74,909.00
Raw material 28,629.04 32,707.85 38,388.31 41,463.48 34,838.08
Packages 3,429.33 3,281.16 3,804.12 3,817.07 3,353.73
Federal labor 12,406.47 11,273.33 12,893.29 14,914.22 12,257.07
Outsourced labor 20,093.29 18,082.11 19,109.06 17,796.81 17,725.38
Electricity 10,101.32 9,227.35 7,323.68 6,880.85 5,567.94
Firewood 1,553.82 1,398.87 1,284.22 1,250.75 1,166.80
Fixed Costs 5,211.35 4,061.01 3,875.73 4,995.90 4,879.21
Cleaning material 1,381.84 599.80 313.30 1,712.72 1,567.49
Depreciation 3,829.52 3,461.21 3,562.43 3,283.18 3,311.72
Fixed Expenses 87.58 66.21 164.48 320.01 82.11
Surplus / Deficit -15,893.55 -19,137.37 -22,197.07 -15,016.39 -11,132.59
Description Semester Mean DP1
1 2 3 4 5
Sales revenue 83.71 86.15 82.40 89.62 88.41 86.06 3.05
Domestic consumption Revenue 16.29 13.85 17.60 10.38 11.59 13.94 3.05
Total 100.00 100.00 100.00 100.00 100.00
Table 5: Profitability analysis of Dairy Products Processing.
Source: Survey data (2015).
Table 6: Representation of each item in revenue in percentage (%).
Source: Survey data (2015); Legend: DP – Deviation Pattern.
Description Coefficient Standard error P-value
Constante 26640.8 4607.98 5.02 e-6 ***
SR Dairy Cattle -0.30454 0.63124 0.6337
IR Dairy Cattle -1.32971 0.25554 2.20 e-5 ***
SR Dairy Processing 0.15277 0.42198 0.7204
IR Dairy Processing 0.08698 0.86095 0.9203
Table 7: Multiple regression by the method of ordinary least squares.
However, the domestic consumer revenue of Dairy Cattle PPL (domestic consumption of fresh dairy + animals
for slaughter) was significant at 1% to reduce dependence
on federal funds. Thus, it appears that for each increase of R$ 1.00 in domestic consumption revenue from the Dairy
Cattle PPL reduced the deficit or Union transfer in R$
1.32. By the results of this model, it appears that the dairy revenue sold fresh to the industry and its byproducts do not contribute to the execution of the expenses, only the dairy revenue in natura consumed within the institution and the animals for slaughter revenue seem to contribute.
The test results, shown in Table 8, for normal residues, heteroskedasticity and autocorrelation of the residuals show that the OLS model used is well adjusted and answered the variable of interest (Union transfer).
Thus, from the results of the tests it can be inferred that errors are normally distributed, as the chi-square statistic test was 4.46129 and p-value 0.107459, the model does not have Heteroskedasticity since the statistical LS test was 11.8841 and p-value was 0.615607, which showed no residual autocorrelation, as the test statistic OLS was 0.0912125 and 0.765243 p-value.
The adoption of management practices typical of the private sector by the public sector as those mentioned by Boyne (2002), Meier et al. (2007), Boyne and Walker (2010), Zafra-Gómez et al. (2013), among others, demonstrated its functionality, as from the application management costs in the PPL production of IFMG Campus Bambuí be found the deficit that the activities under study generated in the analysis period. As well as some results of this research can be compared to those reported by Lopes et al. (2011) because both studies were developed in research centers, such as gross and net margins negative and the decapitalization and indebtedness of production systems.
The set of management information found through the results of this research are parameters to verify the
efficiency in which public resources are being employed
in both laboratories. As suggestions for future research the operational analysis of other laboratories that make up the
“school farm” model as the poultry, swine, fish and rabbits
PPLs. Furthermore the return from a social perspective of the studied PPL can be made once under the operating
optical it proved to be unprofitable.
CONCLUSIONS
Regarding the econometric analysis, only the variable of domestic consumption revenues of Dairy Cattle PPL (domestic consumption of fresh dairy + animals for
slaughter) proved to be significant for the reduction of
dependence on federal funds that support the activities of PPL studied. In both systems there is the practice of measuring the production costs, i.e., in the public service there is no tradition of measuring activities costs. However, this practice was fundamental to elucidate the operational reality of two production and practice laboratories from the “school farm” models of IFMG Campus Bambuí. The adoption of the institution cost determination systems is important to help manage and use of federal resources.
REFERENCES
ADKINS, L. C. Using gretl for principles of econometrics. 2012. Available in: <http://gretl.sourceforge.net/win32/ index_pt.html>. Access in: February, 18, 2016.
ALONSO, M. Custos no serviço público. Revista do Serviço Público, 50(1):37-63, 1999.
BERENTSEN, P. B. M.; KOVACS, K.; ASSELDONK, M. A. P. M. Comparing risk in conventional and organic dairy farming in the Netherlands: an empirical analysis. Journal of Dairy Science, 95(7):3803-3811, 2012.
BORGES, T. B.; MARIO, P. C.; CARNEIRO, R. A implementação dos sistema de custos proposto pelo governo federal: uma análise sob a ótica institucional. Revista de Administração Pública - RAP, 47(2):469-491, 2013.
BOYNE, G. A. Public and private management: what’s the difference? Journal of Management Studies,
39(1):97-122, 2002.
Tests Standard Results Interpretation
Normality P-value > 0,10 P-value = 0.10749 Normally distributed
Heteroskedasticity P-value > 0,10 P-value = 0.615607 No Heteroskedasticity
Autocorrelation P-value > 0,10 P-value = 0.765243 No autocorrelation
Table 8:Statistical normality tests, heteroscedasticity and autocorrelation.
BOYNE, G. A.; WALKER, R. M. Strategic management and public service performance: the way ahead. Public Administration Review, Special Issue:185-192, 2010.
BRASIL. Lei nº. 11.982, de 29 de dezembro de 2008. Institui a Rede Federal de Educação Profissional, Científica e Tecnológica, cria os Institutos Federais de Educação, Ciência e Tecnologia, e dá outras providências. Available in: <http:// www.planalto.gov.br/ccivil_03/_ato2007-2010/2008/lei/ l11892.htmr>. Access in: February, 18, 2016.
BRYMAN, A. Barriers to integrating quantitative and qualitative research. Journal of Mixed Methods Research, 1(1):8-22,
2007.
__________. Integrating quantitative and qualitative research: how is it done? Qualitative Research, 6(1):97-113, 2006.
BRYMAN, A.; BECKER, S.; SEMPIK, J. Quality criteria for quantitative, qualitative and mixed methods research: a view from social policy. International Journal of Social Research Methodology, 11(4):261-276, 2008.
CAVALCANTE, P.; LARIU, C. Orçamento e desempenho municipal: uma análise comparada da qualidade do gasto público nas políticas sociais. Revista do Serviço Público, 63(3):343-361, 2012.
COUTO, H. L. G.; COELHO, C. Fatores críticos no comportamento do gestor público responsável por compras sustentáveis: diferenças entre consumo individual e organizacional.
Revista de Administração Pública - RAP, Rio de Janeiro, 49(2):519-543, 2015.
CRESWELL, J. W. Designing a qualitative study. In: CRESWELL, J. W. Qualitative inquiry and research design. London: Sage, 2013. p. 42-68.
DOORNIK, J. A.; HANSEN, H. An omnibus test for univariate and multivariate normality. Economics Working Papers W4 & 91, Nuffield College, Oxford, 1994, 16p.
DURBIN, J.; WATSON G. S. Testing for serial correlation in least squares regression I. Biometrika,37(3/4):409-428, 1950.
__________. Testing for serial correlation in least squares regression II. Biometrika,38(1/2):159-178, 1951.
GIORDANO, J. O. et al. An economic decision-making support system for selection of reproductive management programs on dairy farms. Journal of Dairy Science, 94(12):6216-6232, 2011.
LOPES, M. A.; CARVALHO, F. de M. Custo de produção do leite. Lavras: UFLA, 2000. 42 p. (Boletim agropecuário, 33).
LOPES, M. A. et al. Controle gerencial e estudo da rentabilidade de sistemas de produção de leite na região de Lavras (MG).
Ciência e Agrotecnologia, 28(4):883-892, 2004.
__________. Resultados econômicos de um sistema de produção de leite na região de Varginha – Sul de Minas Gerais.
Boletim da Indústria Animal, 68(1):07-15, 2011.
LOPES, M. A.; SANTOS, G.; CARVALHO, F. M. Comparativo de indicadores econômicos da atividade leiteira de sistemas intensivos de produção de leite no Estado de Minas Gerais.
Revista Ceres, 59(4):458-465, 2012.
LOPEZ-HERNANDEZ, A. M.; ZAFRA-GOMEZ, J. L.; ORTIZ-RODRIGUEZ, D. ‘Effects of the crisis in spanish municipalities’ financial condition: an empirical evidence 2005–2008’, International Journal of Critical Accounting, 4(4):631-645, 2012.
LUNDE, A.; HEGGEN, K.; STRAND, R. Knowledge and power: exploring unproductive interplay between quantitative and qualitative researchers. Journal of Mixed Methods Research, 7(2):197-210, 2012.
MACHADO, N.; HOLANDA, V. B. Diretrizes e modelo conceitual de custos para o setor público a partir da experiência no governo federal do Brasil. Revista de Administração Pública - RAP, 44(4):791-820, 2010.
MAGALHÃES, E. A. et al. Custo do ensino de graduação em instituições federais de ensino superior: o caso da Universidade Federal de Viçosa. Revista de Administração Pública - RAP, 44(3):6037-66, 2010.
MATSUNAGA, M. et al. Metodologia de custo de produção utilizada pelo IEA. Agricultura em São Paulo, 23(1):123-139, 1976.
MEIER, K. J. et al. Strategic management and the performance of public organizations: testing venerable ideas against recent theories. Journal of Public Administration Research and Theory, 17(3):357-77, 2007.
MIRANDA, V. F. L.; FERREIRA, D. F. Avaliação Monte Carlo de testes assintóticos e de Bootstrap para autocorrelação residual.
Revista de Matemática e Estatística, 24(1):29-52, 2006.
MOURA, J. F. P. et al. Análise econômica da exploração de leite no Cariri paraibano. Acta Scientiarum. Animal Sciences, 32(2):225-231, 2010.
O’HARA, J. K.; PARSONS, R. L. The economic value of organic dairy farms in Vermont and Minnesota. Journal of Dairy Science, 96(9):6117-6126, 2013.
REZENDE, F.; CUNHA, A.; BEVILACQUA, R. Informações de custos e qualidade do gasto público: lições da experiência internacional. Revista de Administração Pública - RAP, 44(4):959-992, 2010.
SILVA, M. F.; SILVA, A. C. Análise dos indicadores zootécnicos e econômicos do sistema de produção de leite a pasto com suplementação. Revista Brasileira de Agropecuária Sustentável, 3(1):110-116, 2013.
SLOMSKI, V. Controladoria e governança na gestão pública. 1. ed. São Paulo: Atlas, 2009, 160p.
VIBART, R. E.et al. Effects of feeding strategy on milk production, reproduction, pasture utilization, and economics of autumn-calving dairy cows in eastern North Carolina. Journal of Dairy Science, 95(2):997-1010, 2012.
WESSELS, W. J. Economia. 2. ed. São Paulo: Saraiva, 2003, 335p.
WHITE, H. A heteroscedasticity consistent covariance matrix estimator and a direct test of heteroscedasticity.
Econometrica, 48(4):817-838, 1980.
WOLF, C. A. Dairy farmer use of price risk management tools.
Journal of Dairy Science, 95(7):4176-4183, 2012.
WOOLDRIGE, J. M. Introductory Econometrics: a modern approach. 4th. Cengage Learning, 2009, 896p.