Effects of airway obstruction on albuterol-mediated
variations in the resistive and elastic properties of the
respiratory system of patients with asthma*
Efeito da obstrução de vias aéreas nas variações das propriedades resistivas e elásticas do sistema respiratóriode asmáticos, mediadas pelo uso de salbutamol
Juliana Veiga, Agnaldo José Lopes, José Manoel Jansen, Pedro Lopes de Melo
Abstract
Objective: To investigate the effects of airway obstruction on albuterol-mediated variations in the resistive and elastic properties of the respiratory system of adult patients with asthma. Methods: This study comprised 24 healthy controls and 69 patients with asthma, all of whom were nonsmokers. The patients were divided into three groups according to the severity of airway obstruction (mild, moderate or severe). Each of the three groups was divided into two subgroups according to the bronchodilator response (BR): positive (BR+) or negative (BR−). These measurements were conducted before and after albuterol use (300 µg). Airway obstruction was determined by means of spirometry, and the resistive and elastic properties were determined by means of the forced oscillation technique. Results: The resistance at the intercept (R0) presented greater reductions in the groups with higher obstruction. This reduction was more evident in the BR+ subgroups than in the BR− subgroups (p < 0.02 and p < 0.03, respectively). There was a significant difference between the control group and the BR+ subgroup with severe obstruction (p < 0.002). The reductions in dynamic elastance (Edyn) were significantly greater in proportion to the degree of obstruction, in the BR− subgroups (p < 0.03), and in the BR+ subgroups (p < 0.003). The reductions in Edyn were significantly greater in the BR− subgroup with moderate obstruction (p < 0.008) and in the BR+ subgroup with severe obstruction (p < 0.0005) than in the control group. Conclusions: In patients with asthma, increased airway obstruction results in greater reductions in R0 and Edyn after albuterol use. These
reductions are greater among BR+ patients than among BR− patients.
Keywords: Asthma; Bronchodilator agents; Respiratory mechanics; Spirometry; Albuterol.
Resumo
Objetivo: Investigar os efeitos da obstrução de vias aéreas nas variações das propriedades resistivas e elásticas do sistema respiratório de asmáticos adultos mediadas pelo uso de salbutamol. Métodos: Foram analisados 24 indi-víduos controles e 69 asmáticos, todos não tabagistas, divididos em três grupos segundo o nível de obstrução de vias aéreas (leve, moderada e acentuada). Cada grupo foi dividido em dois subgrupos de acordo com a resposta broncodilatadora: resposta broncodilatadora positiva (RB+) ou negativa (RB−). A espirometria foi utilizada para a avaliação da obstrução, e a técnica de oscilações forçadas, para a análise das propriedades resistivas e elásticas, sendo realizadas antes e após a utilização de 300 µg de salbutamol. Resultados: A resistência no intercepto (R0)
apresentou maior redução nos grupos com maior obstrução. Essa redução foi mais evidente nos subgrupos RB+ do que nos RB− (p < 0,02 e p < 0,03, respectivamente). Houve diferença significativa entre o grupo controle e a o subgrupo com obstrução acentuada RB+ (p < 0,002). As reduções na elastância dinâmica (Edyn) se acentuaram significativamente com a obstrução, tanto para os subgrupos RB− (p < 0,03), quanto para os RB+ (p < 0,003). As reduções da Edyn foram significativamente maiores nos subgrupos com obstrução moderada RB− (p < 0,008) e com obstrução acentuada RB+ (p < 0,0005) do que no grupo controle. Conclusões: Em asmáticos, o aumento da obstrução de vias aéreas resulta na elevação das variações em R0 e Edyn com o uso de salbutamol. Pacientes com
RB+ apresentam variações mais elevadas que indivíduos com RB−.
Descritores: Asma; Broncodilatadores; Mecânica respiratória; Espirometria; Albuterol.
* Study carried out at the Universidade do Estado do Rio de Janeiro – UERJ, Rio de Janeiro State University – Rio de Janeiro,
Brazil.
Correspondence to: Pedro Lopes de Melo. Universidade do Estado do Rio de Janeiro, Rua São Francisco Xavier, 524, Pavilhão Haroldo
Lisboa Filho, Térreo, Salas 104/105, CEP 20550-013, Rio de Janeiro, RJ, Brasil.
Tel 55 21 2587-7773. Fax 55 21 2587-7760. E-mail: plopes@uerj.br
Financial support: This study received financial support from the Fundação de Apoio à Pesquisa do Estado do Rio de Janeiro (FAPERJ, Foundation for the Support of Research in the State of Rio de Janeiro) and the Conselho Nacional de Desenvolvimento Científico e Tecnológico (CNPq, National Council for Scientific and Technological Development).
Submitted: 8 October 2008. Accepted, after review: 2 March 2009.
ance with the Helsinki Declaration criteria.(11)
The study protocol was applied only after all volunteers had given written informed consent. The tests were performed in the Pulmonary Function Laboratory of the Rio de Janeiro State
University, in the city of Rio de Janeiro, Brazil.
Data processing and statistical analysis were performed at the Rio de Janeiro State University Laboratory of Biomedical Instrumentation.
We evaluated 69 never-smoking patients with asthma.(12,13) The patients were divided
into three groups, according to the obstructive disorder classification proposed by Jansen(14): mild obstruction (n = 28); moderate obstruction
(n = 22); and severe obstruction (n = 19). Each of the three groups was divided into two subgroups, based on bronchodilator response: positive
(BR+); or negative (BR−). Of the 28 patients in
the mild obstruction group, 7 were classified
as BR+ and 21 were classified as BR−. Of the
22 patients in the moderate obstruction group, 13 were classified as BR+ and 9 were classified
as BR−. Of the 19 patients in the severe obstruc
-tion group, 9 were classified as BR+ and 10 were
classified as BR−. The control group comprised
24 never-smoking individuals with no history of cardiovascular disease or pulmonary disease and with normal spirometric values.
The following closed-circuit equipment was used in performing the spirometry tests(15,16):
Vitatrace VT 130 SL (Pro Médico Ind Ltda., Rio
de Janeiro, Brazil); and Collins/GS (Warren E.
Collins, Inc., Braintree, MA, USA). The instru-ment used for evaluating respiratory impedance,
as well as the protocol for performing the FOT
tests, has previously been described.(10,17) A
300-µg dose of inhaled albuterol,(18) divided into
three inhalations of 100 µg at 1-min intervals, was used for the bronchodilator test. The bron-chodilator response was measured 20 min after the last inhalation and was considered positive when the increase in FEV1 and FVC was ≥ 12% or 200 mL.(16)
To provide a quantitative description of the results regarding the curves for respira-tory system resistance (Rrs) and reactance (Xrs), the mean distances (MDs) between the preb-ronchodilator and postbpreb-ronchodilator curves, designated MDRrs and MDXrs, were calculated in
the frequency range of 4-16 Hz. Physiologically,
Introduction
A bronchodilator response is a marked char-acteristic of asthma; however, it might not be present in all tests performed.(1) The parameters used to analyze bronchodilator response should
allow the identification of reduced airway resist-ance as a result of decreased bronchial muscle tone. This reduction is usually evaluated
indi-rectly by analyzing the flows and volumes
obtained through spirometry.
The forced oscillation technique (FOT) allows
the estimation of parameters that translate the resistive and relative properties of the
respira-tory system. The FOT requires only passive
cooperation, is performed during spontaneous breathing and provides new parameters for analysis.(2-4) Although the potential for use of the FOT in the study of the pathophysiology
of bronchodilator response in asthma patients is high, relatively few studies have investigated that potential.(5-9) Such studies have
demon-strated that the parameters obtained using the
FOT allow adequate identification of reduced
muscle tone and, consequently, of reduced airway resistance as a result of bronchodilator
testing in adult patients with asthma. Our study
group has recently reported results regarding the analysis of bronchodilator response using
the FOT in asthma patients presenting such a
response.(10) The results presented in that studies
raised the following question: Are bronchodila-tor-mediated changes in the resistive and elastic properties of the respiratory system dependent on the basal level of bronchial obstruction? This is a question of great interest that, to the best of our knowledge, has yet to be addressed.
Therefore, in continuation of the previous study conducted by our group and published
in this journal,(10) the purpose of the present
study was to contribute to the understanding of bronchodilator response in adult patients with asthma. To that end, the influence that the basal level of airway obstruction has on resistive and elastic alterations resulting from bron-chodilator testing in adult asthma patients was investigated.
Methods
The present study was approved by the Research Ethics Committee of the Pedro Ernesto
-Effects of airway obstruction on albuterol-mediated variations in the resistive and elastic properties of the respiratory system of patients with asthma
647
Results
The biometric characteristics (age, weight, height and gender, respectively) were similar in all groups: control (41.9 ± 16.3 years; 63.4 ± 11.9 kg; 160.1 ± 10.3 cm; 6 males); mild obstruction (41.2 ± 17.2 years; 67.9 ± 14.0 kg; 161.2 ± 11.0 cm; 7 males); moderate obstruc-tion (47.6 ± 17.5 years; 65.2 ± 10.6 kg; 159.0 ± 12.2 cm; 10 males); and severe obstruc-tion (51.5 ± 18.49 years; 69.5 ± 14.4 kg; 161.2 ± 8.2 cm; 9 males). No significant differ -ences were observed (p > 0.05). Table 1 shows the spirometric test results for the groups under study.
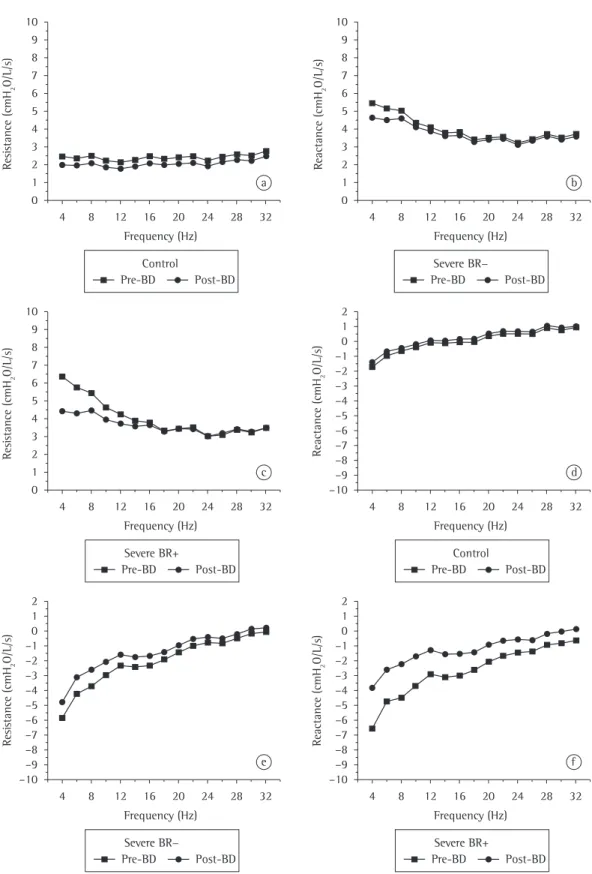
Figure 1 illustrates the effect of bronchodi-lator use on the Rrs and Xrs curves in the control group and in the severe obstruction group, the
latter group being divided into BR+ and BR−.
Table 2 describes the MD between the curves illustrated in Figure 1.
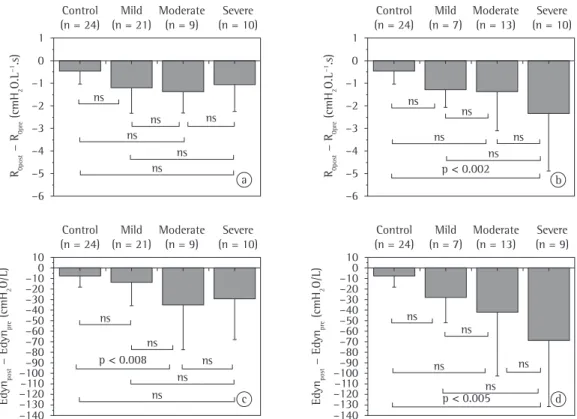
The results of the variation between prebron-chodilator and postbronprebron-chodilator measurements among asthma patients with mild, moderate and severe obstruction are illustrated in Figure 2.
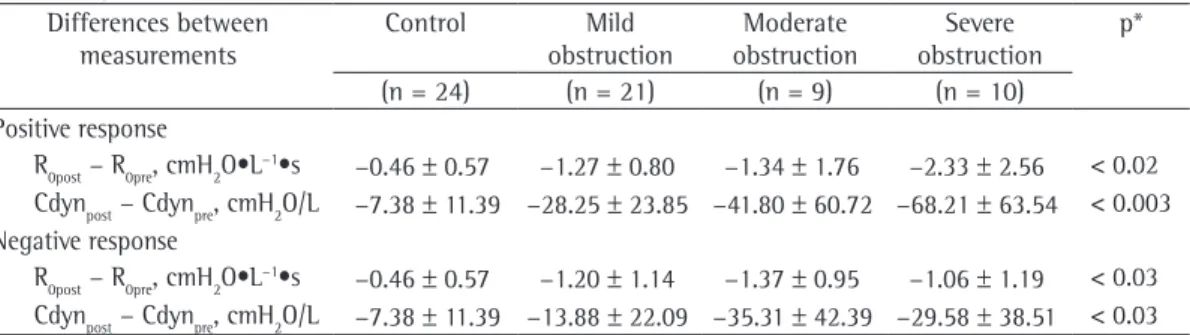
Table 3 summarizes these results.
The postbronchodilator variation in R0 increased significantly in proportion to the these distances describe the variations in the
respiratory system resistive and reactive proper-ties (complacency and inertance) associated with
bronchodilator use. The FOT-derived parameters were also analyzed. Using linear regression of the Rrs curve, carried out in the 4-16 Hz frequency
range, we obtained the resistance at the inter-cept (R0).(2,10,17) Based on the Xrs curve, the
dynamic compliance (Cdyn) of the respiratory
system at the 4-Hz frequency was calculated as
follows(17,19): Cdyn = −2ω × f × Xrs, 4 Hz
The analysis of R0 and Cdyn was performed using the values for the variation between prebronchodilator and postbronchodilator measurements in the different groups (control, mild, moderate and severe) and subgroups (BR+
and BR−).
The results are presented as mean ± standard deviation. Statistical analysis was performed using the STATISTICA 5.0 program
for Windows (StatSoft Inc., Tulsa, OK, USA). One-way ANOVA was performed, and values of p < 0.05 were considered statistically signifi -cant. A second analysis was performed using the Bonferroni multiple correction test, in which
values of p < 0.008 were considered statistically
significant.
Table 1 - Prebronchodilator spirometric test results for the volunteers involved in the present study.
Results Control Mild obstruction Moderate obstruction Severe obstruction
BR+ BR− BR+ BR− BR+ BR−
(n = 24) (n = 7) (n = 21) (n = 13) (n = 9) (n = 9) (n = 10)
FEV1 (%) 98.2 ± 27.3 78.7 ± 15.3 82.4 ± 13.1 53.5 ± 15.3 57.5 ± 19.2 44.2 ± 8.9 42.1 ± 13.5 FEV1, L 3.0 ± 1.2 2.0 ± 0.7 2.6 ± 0.9 1.6 ± 0.8 1.6 ± 0.9 1.1 ± 0.4 1.2 ± 0.6 FVC, L 3.4 ± 1.2 2.8 ± 0.8 3.5 ± 1.1 2.8 ± 1.3 2.7 ± 1.4 2.4 ± 0.8 2.7 ± 1.0 FEV1/FVC (%) 106.0 ± 1.4 84 ± 6.6 85.1 ± 4.8 68.7 ± 6.1 68.1 ± 5.9 55.5 ± 3.7 52.8 ± 7.4
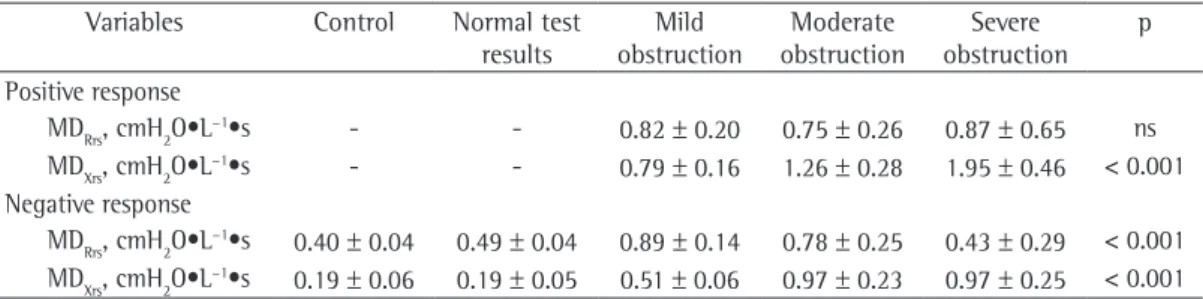
Table 2 - Means and standard deviations of the mean distances between the prebronchodilator and postbronchodilator respiratory system resistance curves and reactance curves in the control group, in asthma patients with a positive bronchodilator response and in asthma patients with a negative bronchodilator response.
Variables Control Normal test
results
Mild obstruction
Moderate obstruction
Severe obstruction
p
Positive response
MDRrs, cmH2O•L−1•s - - 0.82 ± 0.20 0.75 ± 0.26 0.87 ± 0.65 ns
MDXrs, cmH2O•L−1•s - - 0.79 ± 0.16 1.26 ± 0.28 1.95 ± 0.46 < 0.001 Negative response
MDRrs, cmH2O•L−1•s 0.40 ± 0.04 0.49 ± 0.04 0.89 ± 0.14 0.78 ± 0.25 0.43 ± 0.29 < 0.001 MDXrs, cmH2O•L−1•s 0.19 ± 0.06 0.19 ± 0.05 0.51 ± 0.06 0.97 ± 0.23 0.97 ± 0.25 < 0.001
MDRrs: mean distance between the respiratory system resistance curves; MDXrs: mean distance between the respiratory
0 1 2 3 4 5 6 7 8 9 10 R es is ta n ce ( cm H2 O /L /s ) Pre-BD Post-BD Control
4 8 12 16 20 24 28 32
Frequency (Hz) a 0 1 2 3 4 5 6 7 8 9 10 R ea cta n ce ( cm H2 O /L /s ) Pre-BD Post-BD Severe BR−
4 8 12 16 20 24 28 32
Frequency (Hz) b 0 1 2 3 4 5 6 7 8 9 10 R es is ta n ce ( cm H2 O /L /s ) Pre-BD Post-BD Control
4 8 12 16 20 24 28 32
Frequency (Hz) c R ea cta n ce ( cm H2 O /L /s ) Pre-BD Post-BD Severe BR+
4 8 12 16 20 24 28 32
Frequency (Hz) d 2 1 –1 –2 –3 –4 –5 –6 –7 –8 –9 –10 0 Pre-BD Post-BD Severe BR− R es is ta n ce ( cm H2 O /L /s )
4 8 12 16 20 24 28 32
Frequency (Hz) e 2 1 –1 –2 –3 –4 –5 –6 –7 –8 –9 –10 0 Pre-BD Post-BD Severe BR+ R ea cta n ce ( cm H2 O /L /s )
4 8 12 16 20 24 28 32
Frequency (Hz) f 2 1 –1 –2 –3 –4 –5 –6 –7 –8 –9 –10 0
Effects of airway obstruction on albuterol-mediated variations in the resistive and elastic properties of the respiratory system of patients with asthma
649
Discussion
The groups analyzed in the present study
presented similar biometric characteristics. It
is of note that, in such studies, subject height
should be homogeneous, since it is the param-eter that has the most influence on impedance values.(2,3,20)
In the control group, bronchodilator use resulted in a small and homogeneous
reduc-tion in the Rrs values between 4 and 32 Hz
(0.40 ± 0.04 cmH2O•L
−1•s; Figure 1a and
Table 2), which corroborates the findings of another study.(21) However, in the severe obstruc
-tion with BR+ subgroup, bronchodilator use resulted in a greater reduction in total resistance
(MDRrs = 0.87 ± 0.65 cmH2O •L−1•s). The effect
of the bronchodilator increased in proportion
to the degree of obstruction in BR− patients (ANOVA, p < 0.001; Table 2). Such results are
in accordance with what has recently been proposed by some authors,(22) i.e., that Rrs is a
degree of obstruction (as assessed by
spirom-etry) in patients with BR− (ANOVA; p < 0.03; Figure 2a, Table 3). However, after Bonferroni
correction, no differences were observed between the subgroups. Among the BR+ asthma patients, there were greater differences between the prebronchodilator and postbronchodilator measurements, principally in the severe
obstruc-tion with BR+ subgroup (ANOVA; p < 0.02;
Figure 2b, Table 3).
The variation in Cdyn after bronchodilator use was significantly greater in proportion
to the degree of obstruction, in the BR− and BR+ asthma patients (ANOVA; p < 0.03 and p < 0.003, respectively). The Bonferroni test
showed a significant difference between the control group and the moderate obstruction
with BR− subgroup (p < 0.008). There was a
significant difference between the control group and the severe obstruction with BR+ subgroup
(p < 0.0005).
R0pos t − R0pre ( cm H2 O .L −1.s ) –6 –5 –4 –3 –2 –1 0 1 Control (n = 24)
Mild (n = 21)
Moderate (n = 9)
Severe (n = 10)
R0pos t − R0pre ( cm H2 O .L −1.s ) –6 –5 –4 –3 –2 –1 0 1 Control (n = 24)
Mild (n = 7)
Moderate (n = 13)
Severe (n = 10)
ns ns ns ns ns ns –10 –20 –30 –40 –50 –60 –70 –80 –90 –100 –110 –120 –130 –140 0 10 Control (n = 24)
Mild (n = 21)
Moderate (n = 9)
Severe (n = 10)
ns ns ns ns ns ns ns ns ns ns p < 0.002
E dy npos t − E dy npre ( cm H2 O /L )
p < 0.008
–10 –20 –30 –40 –50 –60 –70 –80 –90 –100 –110 –120 –130 –140 0 10 Control (n = 24)
Mild (n = 7)
Moderate (n = 13)
Severe (n = 9)
ns
ns
ns ns
p < 0.005
E dy npos t − E dy npre ( cm H2 O /L ) ns a b d c
The analysis of the Xrs curves (Figure 1) revealed that the Xrs values in the control group were slightly negative at low frequen-cies; in addition, a positive dependence of Xrs on frequency was observed in the prebron-chodilator measurements, a slight change in this behavior being observed after bronchodilator use.(21) The proportion of patients presenting negative Xrs values, principally in the 4-16 Hz
range, was greater among those with asthma than among those without. In addition, greater positive dependence of Xrs on frequency was observed among asthma patients. After bron-chodilator use, the increase in Xrs values and the decrease in the dependence of Xrs on frequency occurred principally at low frequencies, which is in accordance with the literature.(5)
The effect of bronchodilator use on Xrs increased in proportion to the degree of airway obstruction. This occurred as a result of the increase in MDXrs values in proportion to the degree of obstruction, which was observed
in BR− patients and in BR+ patients (ANOVA; p < 0.001; Table 2). According to some authors,(8)
bronchodilators increase airway wall compliance
and relax the smooth muscles of the bronchi. This effect can be explained, at least in part,
by the reduction in the rigidity of the bronchial walls associated with the reduction in bron-chospasm. As discussed previously, increased resistance results in a more pronounced bron-chodilator response. The results of the present study suggest that bronchodilator response is more pronounced when reactance values are more negative, which occurs when the elastic sensitive parameter for evaluating
bronchodi-lator response in patients with asthma. The results of the previously cited study are also in accordance with the proposition that greater basal values for resistance are correlated with a more evident reduction in resistance after bron-chodilator use.(8)
Asthma patients presented elevated Rrs
values, principally between 4 and 16 Hz,
before bronchodilator use (Figure 1b and 1c). After bronchodilator use, there was a reduc-tion in Rrs and in the Rrs curve slope in the
4-16 Hz frequency range. Elevated frequency
values have previously been correlated with the degree and profile of peripheral airway
obstruc-tion in patients with obstructive disease (COPD
or asthma).(5,6,23) One group of authors(24) used
the methacholine bronchial provocation test in
order to analyze the pattern of airway obstruc
-tion in patients with asthma. The authors demonstrated that, in healthy individuals and in asthma patients with mild to moderate obstruc-tion, bronchial provocation produced a slightly heterogeneous pattern of obstruction, which might result in total or partial closure of certain
peripheral airways. However, asthma patients
with severe obstruction presented a quite heter-ogeneous pattern of obstruction, the airways being constricted even before methacholine use. This might be due to persistent inflammation and bronchial remodeling. The increase in tissue resistance, resulting from bronchial
remod-eling, might play a key role in BR− and short
MDRrs (0.43 ± 0.29 cmH2O•L
−1•s) observed in
asthma patients with severe obstruction and
BR− (Figure 1b, Table 2).
Table 3 - Means and standard deviations of the differences between postbronchodilator and prebronchodilator measurements of resistance at the intercept and of dynamic compliance of the respiratory system in the groups under study.
Differences between measurements
Control Mild
obstruction
Moderate obstruction
Severe obstruction
p*
(n = 24) (n = 21) (n = 9) (n = 10)
Positive response
R0post − R0pre, cmH2O•L−1•s −0.46 ± 0.57 −1.27 ± 0.80 −1.34 ± 1.76 −2.33 ± 2.56 < 0.02 Cdynpost − Cdynpre, cmH2O/L −7.38 ± 11.39 −28.25 ± 23.85 −41.80 ± 60.72 −68.21 ± 63.54 < 0.003 Negative response
R0post − R0pre, cmH2O•L−1•s −0.46 ± 0.57 −1.20 ± 1.14 −1.37 ± 0.95 −1.06 ± 1.19 < 0.03 Cdynpost − Cdynpre, cmH2O/L −7.38 ± 11.39 −13.88 ± 22.09 −35.31 ± 42.39 −29.58 ± 38.51 < 0.03
R0post: resistance at the intercept after bronchodilator use; R0pre: resistance at the intercept before bronchodilator use;
Cdynpost: dynamic compliance of the respiratory system after bronchodilator use; and Cdynpre: dynamic compliance of the
Effects of airway obstruction on albuterol-mediated variations in the resistive and elastic properties of the respiratory system of patients with asthma
651
dependence on frequency in the basal values, decreasing significantly after albuterol use. Such behavior might be due to three different mechanisms(24-27): tissue viscoelasticity;
hetero-geneity in time constants of the respiratory system; and airway shunt, resulting from wide-spread obstruction on the periphery of the lung. With regard to the significant variation in Cdyn after albuterol use, the following mechanisms
might explain such behavior(24): the opening of
previously closed lung units; the increase in air volume in the peripheral airways; and the reduc-tion in the heterogeneity of the lung.
The results of the present study show that, in asthma patients, increased airway obstruction results in greater variations in R0 and Cdyn after the use of albuterol. In addition, such variations
are greater in BR+ patients than in BR− patients.
We found that R0 and Cdyn satisfactorily indi-cate improved respiratory mechanics.
Acknowledgments
The authors would like to thank the
engi-neers Jayme Mesquita Júnior and Josiel G.
Santos for their assistance in assembling the instruments. The authors are also grateful to Dr.
Vinícius Antão and Dr. Germânia Pinheiro for
referring the patients to us, as well as to the spirometry technicians at the Pedro Ernesto
University Hospital, Edinete do Rosário Limeira and Luzia da Silva Batista, for performing the
spirometric tests.
References
1. Global Initiative for Asthma - GINA. Geneva: Global Initiative for Asthma [Cited 2009 Mar 3]. Available from: http://www.ginasthma.org.
2. Melo PL, Werneck MM, Gianella-Neto A. Avaliação da mecânica ventilatória por oscilações forçadas: fundamentos e aplicações clínicas. J Pneumol 2000;26(4):194-206.
3. Oostveen E, MacLeod D, Lorino H, Farré R, Hantos Z, Desager K, et al. The forced oscillation technique in clinical practice: methodology, recommendations and future developments. Eur Respir J. 2003;22(6):1026-41. 4. LaPrad AS, Lutchen KR. Respiratory impedance
measurements for assessment of lung mechanics: focus on asthma. Respir Physiol Neurobiol. 2008;163(1-3):64-73.
5. Van Noord JA, Smeets J, Clément J, Van de Woestijne KP, Demedts M. Assessment of reversibility of airflow obstruction. Am J Respir Crit Care Med. 1994;150(2):551-4.
6. Zerah F, Lorino AM, Lorino H, Harf A, Macquin-Mavier I. Forced oscillation technique vs spirometry to assess
properties of the respiratory system are more significantly affected.
When controls were compared with asthma
patients with BR− (Figure 2a), the differ
-ences between prebronchodilator R0 and postbronchodilator R0 increased significantly
in proportion to the degree of airway
obstruc-tion (ANOVA; p < 0.03). However, the multiple
comparisons involving all subgroups showed no
statistical significance. It has been hypothesized
that resistance at low frequencies is a parameter that is not sensitive enough to detect the bron-chodilator effect in patients with obstructive
disease (asthma and COPD) at more advanced
stages, although the authors of the study in which that hypothesis was raised did not stratify the study groups according to the bronchodi-lator response.(5)
The differences between prebronchodi-lator and postbronchodiprebronchodi-lator measurements observed in BR+ patients were greater than
those observed in BR− patients with the same
degree of obstruction (Figure 2a), principally in the severe obstruction group. This corrobo-rates the findings of another group of authors,(8)
who demonstrated better R0 response in
patients presenting a variation in FEV1 ≥ 10% after bronchodilator use. Among BR+ patients, the differences between the means increased progressively from those obtained for the control group to those obtained for the severe obstruction with BR+ subgroup, showing a tendency toward a significant increase between
subgroups (ANOVA; p < 0.02). When adjacent
groups were compared, a significant difference was observed between the control group and the severe obstruction group (Bonferroni correction;
p < 0.002).
The results regarding Cdyn are illustrated in Figures 2c and 2d. There was a statisti-cally significant tendency toward lower Cdyn in inverse proportion to the degree of airway
obstruction in BR− and BR+ patients (ANOVA; p < 0.03 and p < 0.003, respectively). The reduc -tions in Cdyn were significantly greater in the
moderate obstruction with BR− subgroup than in the control group (Bonferroni; p < 0.008). The
reductions in Cdyn were significantly greater in the severe obstruction with BR+ subgroup than
in the control group (Bonferroni; p < 0.0005).
18. Jansen JM, Plotkowski LM, Kux R, Milagres JA. Determinação da melhor dose de um broncodilatador - Estudo dose-resposta com salbutamol spray em pacientes asmáticos. J Pneumol. 1986;12(4):211-16. 19. Nagels J, Làndsér FJ, van der Linden L, Clément J, Van
de Woestijne KP. Mechanical properties of lungs and chest wall during spontaneous breathing. J Appl Physiol. 1980;49(3):408-16.
20. Làndsér FJ, Clément J, Van de Woestijne KP. Normal values of total respiratory resistance and reactance determined by forced oscillations: influence of smoking. Chest. 1982;81(5):586-91.
21. Manço JC, Hyatt RE, Rodarte JR. Respiratory impedance in normal humans: effects of bronchodilatation
and bronchoconstriction. Mayo Clin Proc.
1987;62(6):487-97.
22. Yaegashi M, Yalamanchili VA, Kaza V, Weedon J, Heurich AE, Akerman MJ. The utility of the forced oscillation technique in assessing bronchodilator responsiveness in patients with asthma. Respir Med. 2007;101(5):995-1000.
23. Kaczka DW, Ingenito EP, Israel E, Lutchen KR. Airway and lung tissue mechanics in asthma. Effects of albuterol. Am J Respir Crit Care Med. 1999;159(1):169-78. 24. Lutchen KR, Jensen A, Atileh H, Kaczka DW, Israel E, Suki
B, et al. Airway constriction pattern is a central component of asthma severity: the role of deep inspirations. Am J Respir Crit Care Med. 2001;164(2):207-15.
25. Mauad T. Airway Remodeling in Asthma. Proceedings of CHEST 2003: 69th Annual Meeting of the American College of Chest Physicians; 2003 Oct 25-30; Orlando, USA. Northbrook: American College of Chest Physicians; 2003. p.44-7.
26. Brown NJ, Salome CM, Berend N, Thorpe CW, King GG. Airway distensibility in adults with asthma and healthy adults, measured by forced oscillation technique. Am J Respir Crit Care Med. 2007;176(2):129-37.
27. Lutchen KR, Gillis H. Relationship between heterogeneous changes in airway morphometry and lung resistance and elastance. J Appl Physiol. 1997;83(4):1192-201. bronchodilatation in patients with asthma and COPD.
Chest. 1995;108(1):41-7.
7. Mazurek HK, Marchal F, Derelle J, Hatahet R, Moneret-Vautrin D, Monin P. Specificity and sensitivity of respiratory impedance in assessing reversibility of airway obstruction in children. Chest. 1995;107(4):996-1002. 8. Delacourt C, Lorino H, Herve-Guillot M, Reinert P, Harf
A, Housset B. Use of the forced oscillation technique to assess airway obstruction and reversibility in children. Am J Respir Crit Care Med. 2000;161(3 Pt 1):730-6. 9. Schweitzer C, Moreau-Colson C, Marchal F. Respiratory
impedance response to a deep inhalation in asthmatic children with spontaneous airway obstruction. Eur Respir J. 2002;19(6):1020-5.
10. Cavalcanti JV, Lopes AJ, Jansen JM, Melo PL. Using the forced oscillation technique to evaluate bronchodilator response in healthy volunteers and in asthma patients presenting a verified positive response. J Bras Pneumol. 2006;32(2):91-8.
11. World Medical Association. Declaration of Helsinki. 59th WMA General Assembly; 2008 Oct 13; Seoul: WMA; 2008.
12. Sociedade Brasileira de Pneumologia e Tisiologia. III Consenso Brasileiro no Manejo da Asma. J Pneumol. 2002;28(Suppl 1):S6-S51.
13. Sociedade Brasileira de Pneumologia e Tisiologia. IV Diretrizes Brasileiras para o Manejo da Asma. J Bras Pneumol. 2006;32(Suppl 7):S447-S74.
14. Jansen JM. Classificação da Síndrome Obstrutiva Brônquica - Uma proposta estatística [thesis]. Rio de Janeiro: Universidade Federal Fluminense; 1994. 15. Sociedade Brasileira de Pneumologia e Tisiologia.
Diretrizes para Testes de Função Pulmonar. J Pneumol. 2002;28(Suppl 3):S1-S238.
16. Lung function testing: selection of reference values and interpretative strategies. American Thoracic Society. Am Rev Respir Dis. 1991;144(5):1202-18.
17. Cavalcanti JV, Lopes AJ, Jansen JM, Melo PL. Detection of changes in respiratory mechanics due to increasing degrees of airway obstruction in asthma by the forced oscillation technique. Respir Med. 2006;100(12):2207-19.
About the authors
Juliana Veiga
Assistant Professor. Castelo Branco University, Rio de Janeiro, Brazil.
Agnaldo José Lopes
Adjunct Professor. Universidade do Estado do Rio de Janeiro – UERJ, Rio de Janeiro State University – Rio de Janeiro, Brazil.
José Manoel Jansen
Full Professor. Universidade do Estado do Rio de Janeiro – UERJ, Rio de Janeiro State University – Rio de Janeiro, Brazil.
Pedro Lopes de Melo