Genetic control of soybean (
Glycine max
) yield in the absence and presence
of the Asian rust fungus (
Phakopsora pachyrhizi
)
Aliny Simony Ribeiro
1, José Francisco Ferraz de Toledo
1, Carlos Alberto Arrabal Arias
1,
Cláudia Vieira Godoy
1, Rafael Moreira Soares
1, José Ubirajara Vieira Moreira
1,
Pedro Henrique Braga Pierozzi
1, Maria Celeste Gonçalves Vidigal
2and Marcelo Fernandes de Oliveira
1 1Embrapa Soja, Londrina, PR, Brazil.
2
Departamento de Agronomia, Universidade Estadual de Maringá, Maringá, PR, Brazil.
Abstract
Soybean is one of the most important crops in Brazil and continuously generates demands for production technolo-gies, such as cultivars resistant to diseases. In recent years, the Asian rust fungus (Phakopsora pachyrhizi Syd. & P. Syd 1914) has caused severe yield losses and the development of resistant cultivars is the best means of control. Understanding the genetic control and estimating parameters associated with soybean (Glycine max) resistance to P. pachyrhizi will provide essential information for cultivar selection. We investigated quantitative genetic control of P. pachyrhizi and estimated parameters associated to soybean yield in the absence and presence of this phytopathogen. Six cultivars and their 15 diallel derived F2and F3generations were assessed in experiments carried out in the absence and presence ofP. pachyrhizi. The results indicated that soybean yield in the presence and ab-sence ofP. pachyrhizi is controlled by polygenes expressing predominantly additive effects that can be selected to develop new cultivars resistant or tolerant toP. pachyrhizi. These cultivars may prove to be a useful and more dura-ble alternative than cultivars carrying major resistance genes.
Key words:genetic components, genetic potential, yield prediction.
Received: June 29, 2007; Accepted: August 21, 2007.
Introduction
Soybean (Glycine max(L.) Merrill) is the most im-portant crop in Brazilian agriculture, with a current culti-vated area of 20.6 million hectares and an average yield of 2,809 kg ha-1equivalent to an annual production of approx-imately 58 million tons (CONAB, 2007). Brazil contributes 20% of the world soybean production ranking second in soybean production (CONAB, 2006). However, average yield could be greater than 3,200 kg ha-1if the effect of dis-eases was reduced (Almeida, 2001). Asian soybean rust (ASR) caused by the fungusPhakopsora pachyrhiziSyd. & P. Syd 1914) is the most aggressive soybean disease and can result in losses of 10% to 90% of the crop (Hartmanet al., 1999).
A recent doctoral thesis on the mapping of rust resis-tance genes and quantitative trait loci (QTL) involved in soybean resistance to septoriosis caused by phytopatho-genic fungi of the genera Septoria pointed out that economic and effective control ofP. pachyrhizican be
ob-tained using resistant or tolerant soybean cultivars (Brogin, RL. Mapeamento de genes de resistência à ferrugem e de QTLs envolvidos na resistência à septoriose em soja, Ph. D. thesis, Escola Superior de Agricultura Luiz de Queiroz, São Paulo University, Piracicaba-SP, Brazil 2005).
In addition to the classicalRpp1, Rpp2, Rpp3 and
Rpp4resistance genes several major resistance genes have been identified in new plant introductions or cultivars (Bromfield and Hartwig, 1980; Hartwig, 1986; Hartmanet al. 2004; Pierozziet al.(submitted to Genet Mol Biol)). However, resistance toP. pachyrhiziexpressed by single genes does not promise to be durable since theRpp1and
Rpp3genes proved not effective in soybean in the second year (2002) afterP. pachyrhiziwas first detected in Brazil. Although staking individual resistance genes could perhaps prove effective for somewhat longer periods of time, the search for horizontal quantitative resistance must be per-formed to ensure long lasting resistance or tolerance. Some soybean cultivars have shown more tolerance to P.
pachyrhizithan others, which could be due to the presence
of quantitative resistance genes in the plants. The develop-ment of resistant or tolerant cultivars in a breeding program can be greatly helped by a knowledge of the various types
Send correspondence to José Francisco Ferraz de Toledo. Embra-pa Soybean, Caixa Postal 231, 86001-970 Londrina, PR, Brazil. E-mail: toledo@cnpso.embrapa.br.
of gene action in the segregating populations. Plant breed-ing efficiency depends on a good knowledge of the genetic variability and type of predominant gene action in the con-trol of the trait (Ramalho and Vencovsky, 1978).
Assessing the yield of soybean parent plants and their biparental cross derived F2and F3generations in the
pres-ence and abspres-ence ofP. pachyrhiziis, therefore, likely to provide important clues on the possibilities open to breed-ers interested in developing soybean cultivars which are not only high-yielding but also resistant or tolerant to P.
pachyrhizi. Ribeiroet al.(2007) assessed the severity ofP.
pachyrhizi attack on leaves of soybean cultivars FT-2,
EMBRAPA 48, BRS 154, BRS 184, BRS 214, BRS 231 and reported that genes for resistance or tolerance toP.
pachyrhizi displayed predominantly additive effects and
are dispersed among soybean genotypes. If similar results can be obtained for yielding controlling genes, strategies for efficient cultivar development can be efficiently drawn. We investigated the same cultivars as Ribeiroet al.(2007) to assess the Genetic control of soybean yield in the pres-ence and abspres-ence ofPhakopsora pachyrhizi.
Material and Methods
We investigated six commercial cultivars (FT-2, Em-brapa-48, BRS 154, BRS 184, BRS 214 and BRS 231) in biparental diallel crosses which produced 15 sets each of F2, reciprocal F2(RF2), F3 and reciprocal F3(RF3)
genera-tions. The six parental cultivars had expressed different lev-els of resistance and/or tolerance toP. pachyrhiziin several greenhouse tests conducted at the Brazilian Agricultural Research Corporation (Empresa Brasileira de Pesquisa Agropecuária-Embrapa) National Center for Soybean Re-search (Embrapa Soybean, Londrina, Paraná State, Brazil.) and are high-yielding and well-adapted to the growing con-ditions in the Brazilian state of Paraná. The FT-2 cultivar carries a single gene forP. pachyrhiziresistance, probably
Rpp1orRpp3, which express resistance to theP. pachyrhizi
strain isolated from southern Brazil but not to the strain iso-lated in the Brazilian state of Mato Grosso (the “MT” strain). All cultivars show similar growth cycle, which, in genetic studies, is important in minimizing the effects of time onP. pachyrhiziinfection.
During the 2004/05 cropping season at the Embrapa Soybean experimental farm (23°11’ S; 51°10’ W) in Paraná we carried out two completely randomized experiments in-volving 11,400 (2 X 5,700) single-plant hill-plots, with one plant being equal to one hill-plot. Single plant hill-plots were used to allow growing the large number of plants (rep-lications) in a restricted experimental area to reduce soil heterogeneity and to avoid having two experimental errors (between plots and between plants within plots) in the ex-periments, which would only add complexity to the genetic parameter estimation process. In each experiment, each parent was represented by 50 plants, each F2and RF2by 80
plants and each F3and RF3by 20 families of five plants
each. In experiment I we sprayed the plants at the V2plant
growth stage with the fungicide Impact (0.6 L ha-1 equiva-lent to 75 g ha-1of Flutriafol a.i.) and at the R3and R6plant
growth stages with the fungicide Folicur (0.5 L ha-1 equiva-lent to 100 g ha-1of Tebuconazole a.i.) to preclude develop-ment of P. pachyrhizi. In experiment II, we used no fungicide but instead inoculated the plants twice (once at plant development stage V3 and once at stage V5) withP.
pachyrhizistrain MT using a suspension containing about
1 x 10⁴ spores mL-1. The spores were produced on P.
pachyrhizi infected leaves of the soybean cultivar BRS
Bacuri in a contained green-house environment. Cultivar BRS Bacuri was chosen because it is resistant to the south-ern Brazil strain and susceptible to the MT strain ofP.
pachyrhizi, which are the two prevalent strains in Brazil,
therefore ensuring predominance of the MT strain in our inoculum. The P. pachyrhizi strain MT original spores were collected in the State of Mato Grosso by Dr. Tadashi Yorinori in 2002 and kept in the Embrapa Soybean plant pathology collection under freeze-dried stored conditions. Both experiments received all recommended agricultural practices to ensure normal soybean plant development, in-cluding irrigation. The experiments were monitored three times a week to ensure prompt response to any abnormality that could cause the collected data to be unreliable. Details of other experiment characteristics and on the inoculation procedures are given in Ribeiroet al.(2007).
Individual single-plant plots were harvested at the R7 stage and plants taken to a shed for drying to 13% moisture prior to threshing and weighing of the soybeans to calculate grain-yield.
For both experiments, genetic models (Mather and Jinks, 1982) were fitted to the yield means and variances of the generations to estimate genetic parameters, narrow sense heritabilities based on F3family means and predict
the genetic potential of each biparental cross for generating high-yielding inbred lines (Jinks and Pooni, 1976; Toledo, 1987).
Results
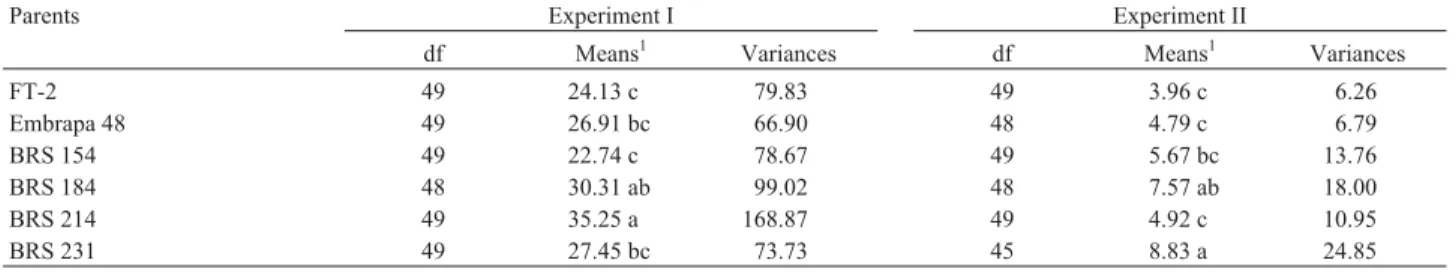
Table 1 shows the degrees of freedom, means and variances of the parents and their derived F2and F3
gen-erations in both experiments after pooling over recipro-cals since no significant (p = 0.05) reciprocal effects were detected for yield in any generation. Significant yield differences were detected for each cultivar between experiments and also between cultivars within experi-ments. The largest yield reductions (in parentheses) be-tween the two experiments were for BRS 214 (-86.04%), FT-2 (-83.59%), Embrapa 48 (-82.20%), BRS 154 (-75.07%) and BRS 184 (-75.02%). Cultivar BRS 231, which has been reported to carry quantitative genes for resistance or tolerance to P. pachyrhizi(Ribeiroet al., 2007), showed a smaller yield reduction of -67.83%
Table 1- Degrees of freedom (df), means and variances of the six parent soybean cultivars and their derived biparental cross F2and F3generations in
ex-periments I and II. Data refer to grams per plant.
Parents Experiment I Experiment II
df Means1 Variances df Means1 Variances
FT-2 49 24.13 c 79.83 49 3.96 c 6.26
Embrapa 48 49 26.91 bc 66.90 48 4.79 c 6.79
BRS 154 49 22.74 c 78.67 49 5.67 bc 13.76
BRS 184 48 30.31 ab 99.02 48 7.57 ab 18.00
BRS 214 49 35.25 a 168.87 49 4.92 c 10.95
BRS 231 49 27.45 bc 73.73 45 8.83 a 24.85
1Means followed by the same letters did not differ significantly by the Tukey test at p = 0.05.
Crosses
FT-2 x Emb 48 df Means Variances df Means Variances
F2 157 26.26 85.30 156 5.52 7.37
F3 194 27.37 107.88 197 5.49 10.22
__F3between families 39 235.79 39 12.13
__F3within families 155 74.65 158 9.74
FT-2 x BRS 154 df Means Variances df Means Variances
F2 159 29.85 138.46 158 5.97 13.18
F3 196 27.68 120.84 197 5.88 13.99
__F3between families 39 190.06 39 24.45
__F3within families 157 103.13 158 11.33
FT-2 x BRS 184 df Means Variances df Means Variances
F2 154 32.35 110.97 155 7.48 14.82
F3 197 30.26 147.12 197 6.48 15.76
__F3between families 39 326.85 39 30.04
__F3within families 158 101.50 158 12.14
FT-2 x BRS 214 df Means Variances df Means Variances
F2 159 34.20 166.97 157 6.06 17.55
F3 196 32.12 163.11 197 6.25 11.69
__F3between families 39 245.34 39 10.93
__F3within families 157 142.07 158 11.88
FT-2 x BRS 231 df Means Variances df Means Variances
F2 154 28.02 122.31 153 8.00 29.28
F3 194 25.80 143.59 191 6.29 18.52
__F3between families 39 241.94 39 25.92
__F3within families 155 117.90 152 16.55
Emb 48 x BRS 154 df Means Variances df Means Variances
F2 155 27.72 150.54 157 5.76 16.01
F3 198 25.63 106.73 195 6.12 21.23
__F3between families 39 179.01 39 35.38
__F3within families 159 88.52 156 17.58
Emb 48 x BRS 184 df Means Variances df Means Variances
F2 156 32.94 106.38 158 6.73 14.10
F3 197 30.15 92.23 194 6.60 13.77
__F3between families 39 103.28 39 17.54
__F3within families 158 89.43 155 12.79
Emb 48 x BRS 214 df Means Variances df Means Variances
F2 158 29.92 147.38 155 5.19 12.42
F3 194 29.26 152.88 194 5.80 14.68
__F3between families 39 293.14 39 20.93
__F3within families 155 116.44 155 13.05
Emb 48 x BRS 231 df Means Variances df Means Variances
F2 155 32.58 142.39 153 8.20 31.66
F3 199 25.02 97.45 195 4.68 6.10
__F3between families 39 120.65 39 7.06
tween experiments and was top yielding in experiment II. The BRS 184 cultivar also showed some degree of toler-ance toP. pachyrhizias its yield did not significantly dif-fer from that of BRS 231 in either experiment.
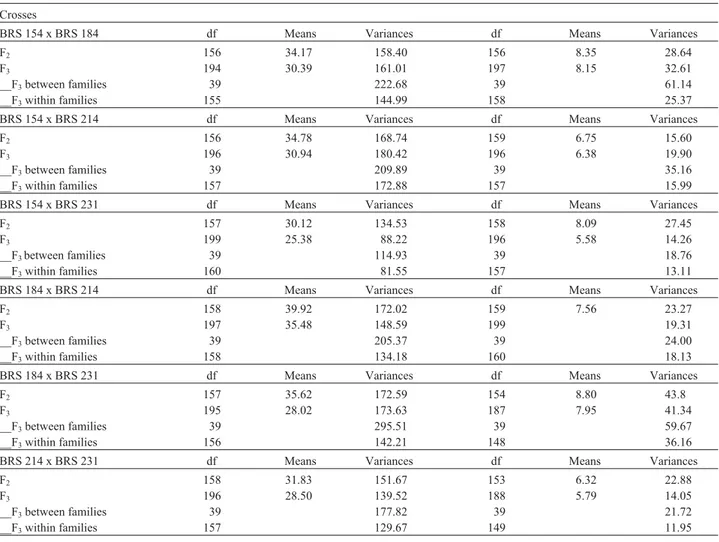
The mean and variance genetic parameters estimated for yield are shown in Table 2 for experiment I and Table 3 for experiment II.
In experiment I, out of the 15 crosses investigated ad-ditive ([d]) gene effects were significant in 11 crosses and dominant ([h]) effects in 13 crosses. Dominance was pre-dominantly positive towards increased yield. The estimated variance parameters indicated a prevalence of additive (D) effects in nine out of the 15 crosses with the presence of re-pulsion linkage between genes expressing additive effects in the Embrapa 48 x BRS 154 cross (D1 > D2, data not shown). No significant dominant (H) variance was ob-served and significant genotype x micro-environment inter-action (E1≠E2) was detected only in the Embrapa 48 x BRS 214 cross. The larger absolute values of [h] compara-tively to those of [d] coupled with the predominance of D over H effects and detection of repulsion linkage in one
cross suggested that the yield increasing genes were dis-persed among the parents.
In experiment II, out of the 15 crosses investigated [d] gene effects were significant in 10 crosses and [h] effects in 11 crosses, with [h] effects always towards yield increase. Duplicate epistasis was detected in three crosses (FT-2 x Embrapa 48, FT-2 x BRS 214 and Embrapa 48 x BRS 214). The D estimates were significant in 8 out of 15 crosses, in-dicating that the genetic variability detected for yield in the presence ofP. pachyrhiziwas predominantly of the tive type. Repulsion linkage between loci expressing addi-tive gene effects was detected on a single occasion in the BRS 184 x BRS 214 cross (D1 > D2, data not shown). No significant H estimates were obtained and significant geno-type x micro-environment interaction was detected in two crosses (FT-2 x BRS 184 and Embrapa 48 x BRS 184). The main picture is that the genetic control of soybean yield in the presence of the pathogen was mostly by dispersed genes displaying additive effects.
Narrow sense heritability estimates based on F3
fam-ily means (Table 4) were of moderate value, ranging from 0.53 to 0.80 in experiment I and from 0.52 to 0.80 in
experi-Ribeiroet al. 101
Table 1 (cont.)
Crosses
BRS 154 x BRS 184 df Means Variances df Means Variances
F2 156 34.17 158.40 156 8.35 28.64
F3 194 30.39 161.01 197 8.15 32.61
__F3between families 39 222.68 39 61.14
__F3within families 155 144.99 158 25.37
BRS 154 x BRS 214 df Means Variances df Means Variances
F2 156 34.78 168.74 159 6.75 15.60
F3 196 30.94 180.42 196 6.38 19.90
__F3between families 39 209.89 39 35.16
__F3within families 157 172.88 157 15.99
BRS 154 x BRS 231 df Means Variances df Means Variances
F2 157 30.12 134.53 158 8.09 27.45
F3 199 25.38 88.22 196 5.58 14.26
__F3between families 39 114.93 39 18.76
__F3within families 160 81.55 157 13.11
BRS 184 x BRS 214 df Means Variances df Means Variances
F2 158 39.92 172.02 159 7.56 23.27
F3 197 35.48 148.59 199 19.31
__F3between families 39 205.37 39 24.00
__F3within families 158 134.18 160 18.13
BRS 184 x BRS 231 df Means Variances df Means Variances
F2 157 35.62 172.59 154 8.80 43.8
F3 195 28.02 173.63 187 7.95 41.34
__F3between families 39 295.51 39 59.67
__F3within families 156 142.21 148 36.16
BRS 214 x BRS 231 df Means Variances df Means Variances
F2 158 31.83 151.67 153 6.32 22.88
F3 196 28.50 139.52 188 5.79 14.05
__F3between families 39 177.82 39 21.72
Phakopsora
pachyrhizi
and
soybean
yield
effects; [l] = dominance by dominance epistatic mean effects;χ2= Chi-square value; df = degrees of freedom; p = probability level; D = additive variance effects; D1and D2= additive variance effects in the pres-ence of digenic linkage; H = dominance variance effect; E = additive environmental variance component; E1 and E2 are the additive environmental variance components of P1 and P2, respectively, in the prespres-ence of genotype x microenvironment interaction.
Crosses / parameters m [d] [h] [i] [l] χ2 df p D H E or E1and E2 χ2 gl p
FT 2 x EMBRAPA 48 26.49±0.45 - - - - 5.12 3 0.16 51.65±15.71 - 65.52±6.88 2.19 3 0.53
FT 2 x BRS 154 23.83±0.80 - 12.91±2.57 - - 1.66 2 0.44 31.58±12.69 - 99.17±8.60 6.04 3 0.11
FT 2 x BRS 184 27.41±0.85 3.11±0.95 10.18±2.54 - - 0.20 1 0.66 74.83±21.24 - 83.11±8.92 1.79 3 0.62
FT2 x BRS 214 29.77±0.98 5.59±1.10 8.99±3.02 - - 0.02 1 0.88 49.48±22.44 - 131.73±12.36 6.24 3 0.10
FT2 x BRS 231 25.41±0.80 1.67±0.88a 4.44
±2.49a - - 1.08 1 0.30 67.97
±21.03 - 88.76±9.28 2.18 3 0.53
EMBRAPA 48 x BRS 154 24.58±0.77 2.10±0.85 5.63±2.59 - - 0.43 1 0.51 37.16c
±10.21 - 88.47±7.41 7.12 3 0.07
EMBRAPA 48 x BRS 184 28.30±0.79 1.64±0.91a 8.78±2.45 - - 0.46 1 0.50 - - 95.08±6.34 3.72 4 0.44
EMBRAPA 48 x BRS 214 29.96±0.56 3.69±1.01 - - - 1.69 2 0.43 66.70±23.52 - 154.67±22.92
64.43±12.49
0.79 2 0.67
EMBRAPA 48 x BRS 231 27.17±0.84 - -28.00±7.75 - 77.65±15.10 0.10 1 0.75 - - -
-BRS 154 x -BRS 184 26.54±0.86 3.79±0.95 15.29±2.76 - - 0.00 1 0.97 62.46±23.12 - 114.90±11.41 5.26 3 0.15
BRS 154 x BRS 214 28.60±0.99 6.11±1.10 11.67±3.04 - - 0.60 1 0.44 - - 163.96±10.93 8.48 4 0.08
BRS 154 x BRS 231 20.64±1.62 2.36±0.87 18.96±4.55 4.45±1.84 - b - - - - - - -
-BRS 184 x -BRS 214 32.35±1.01 2.36±1.15 14.45±3.11 - - 0.56 1 0.45 - - 153.58±10.22 7.8 4 0.10
BRS 184 x BRS 231 28.66±0.92 - -19.10±9.58 - 65.89±18.74 2.34 1 0.13 109.21±28.76 104.07±11.49 4.56 3 0.21
BRS 214 x BRS 231 25.17±1.95 3.90±1.10 13.32±5.16 6.18±2.24 - b - - -
-139.7±9.29 8.97 4 0.06
a
[d] and [h] significant at the 10% probability level. bPerfect fit.
c
Ribeiro
et
al.
103
Table 3- Genetic models of means and variances fitted for the soybean yield trait in Experiment I. All the estimates are significant at the level of 5% probability, except when specifically noted as being at the l0% level. The column headings represent the following: m = mean effects of the genes non-segregating in the cross; [d] = additive mean effects; [h] = dominance mean effects; [i] = additive by additive epistatic mean effects; [l] = dominance by dominance epistatic mean effects;χ2= Chi-square value; df = degrees of freedom; p = probability level; D = additive variance effects; D1and D2= additive variance effects in the pres-ence of digenic linkage; H = dominance variance effect; E = additive environmental variance component; E1 and E2 are the additive environmental variance components of P1 and P2, respectively, in the prespres-ence of genotype x microenvironment interaction.
Crosses / parameters m [d] [h] [i] [l] χ2 df p D H E or E1and E2 χ2 gl p
FT 2 x EMBRAPA 48 4.35±0.26 - 6.76±2.42 - -8.84±4.52 2.61 1 0.11 - - 8.43±0.56 9.42 4 0.05
FT 2 x BRS 154 5.02±0.28 0.93±0.31 2.24±0.85 - - 2.04 1 0.15 5.51±2.02 - 10.10±1.00 6.83 3 0.08
FT 2 x BRS 184 5.70±0.31 1.77±0.34 3.46±0.93 - - 0.15 1 0.70 6.61±2.37 - 16.49±2.38
6.06±1.18
0.56 2 0.76
FT2 x BRS 214 4.31±0.28 - 12.02±2.66 - -17.04±5.23 2.68 1 0.1 - - -
-FT2 x BRS 231 4.58±0.76 2.43±0.41 6.84±2.14 1.81±0.86 - b - - - - -
-EMBRAPA 48 x BRS 154 5.70±0.19 0.59±0.31a - - - 3.80 2 0.15 9.29±2.96 - 17.60±2.68
7.50±1.47
4.4 2 0.11
EMBRAPA 48 x BRS 184 6.54±0.17 1.55±0.33 - - - 1.48 2 0.48 - - 20.20±2.14
7.06±1.37
2.31 3 0.51
EMBRAPA 48 x BRS 214 4.84±0.29 - 6.98±2.86 - -12.56±5.46 0.05 1 0.83 4.50±1.90 - 10.43±1.00 4.40 3 0.22
EMBRAPA 48 x BRS 231 1.16±0.57 2.02±0.41 14.08±1.95 5.65±0.71 - b - - -
-BRS 154 x -BRS 184 6.83±0.37 0.98±0.40 3.52±1.17 - - 1.77 1 0.18 19.73±5.11 - 18.21±2.02 2.66 3 0.45
BRS 154 x BRS 214 5.40±0.31 - 2.94±0.93 - - 2.06 2 0.36 7.85±2.71 - 12.81±1.29 1.57 3 0.67
BRS 154 x BRS 231 3.07±0.68 1.58±0.45 10.04±1.98 4.18±0.82 - b - - - - - - -
-BRS 184 x -BRS 214 6.29±0.34 1.34±0.38 2.63±1.08 - - 0.07 1 0.79 3.15c±0.97 - 17.73±1.36 4.87 3 0.18
BRS 184 x BRS 231 8.23±0.28 - - - - 3.36 3 0.34 23.06±6.95 - 27.42±2.99 6.59 3 0.09
BRS 214 x BRS 231 6.15±0.20 1.65±0.40 - - - 4.7 2 0.09 - - -
-a
[d] and [h] significant at the 10% probability level. bPerfect fit.
c
ment II, suggesting that selection for higher yield is likely to be successful in both cases.
Table 5 shows the genetic potential of each cross esti-mated as the percentage of random inbred lines expected to score higher yields than the BRS 231 cultivar in the pres-ence and abspres-ence ofP. pachyrhizi. The probability of gen-erating random inbred lines superior to BRS 231 was higher in experiment I than in experiment II, but an overall picture of successful selection was portrayed in both cases.
Discussions
The extreme yield reductions for all cultivars seen in experiment II as compared with experiment I suggests that the two inoculations (one at plant growth stage V3 and the other at stage V5) withP. pachyrhizispores were carried out too early in the plant growth cycles. However, as previ-ously reported in the disease severity studies by Ribeiroet al., 2007, screening cultivars, F2plants and F3families for
P. pachyrhizitolerance was successfully performed in
ex-periment II using yield assessment. The genetic component analyses confirmed previous observations (Toledo, unpub-lished data) indicating that quantitative genes controlling yield in soybean in the presence ofP. pachyrhiziare dis-persed among the currently available Brazilian cultivars. Given the predominantly additive effect expressed by these genes, recurrent selection in the presence of the pathogen is likely to bring good results. This type of selection has been tried successfully before at Embrapa Soybean for insect re-sistance to stinkbugs (Souza and Toledo, 1995). Further in-dications of the feasibility of selection for quantitative
resistance toP. pachyrhiziwere provided by the moderate levels of heritability detected in some crosses and by the predicted potential of a few crosses to generate high yield-ing random inbred lines in experiment II. The experimental data clearly showed that, as expected, deriving random in-bred lines with higher yields than BRS 231 is more difficult in experiment II than in experiment I. However, the predic-tions were rather encouraging given that at least five out of the 15 crosses showed that more than 10% of the derived lines were expected to yield higher than BRS 231 underP.
pachyrhizpressure and quantitative resistance, tolerance or
both is likely to be durable.
Our data demonstrated that breeding soybean for re-sistance or tolerance toP. pachyrhizidoes not have to rely solely on the few identified major genes already reported in the literature (Bromfield & Hartwig, 1980; Hartwig, 1986; Hartmanet al., 2004; Laperutaet al.(submitted to Genet Mol Biol); Pierozziet al.(submitted to Genet Mol Biol)). This is important especially after the MT strain had de-feated the resistance expressed by theRpp1andRpp3genes after only two years of the presence of P. pachyrhizi in Brazil. In spite of the low yield attained under severe patho-gen pressure in experiment II, cultivars showing quantita-tive levels of resistance or tolerance toP. pachyrhizisimilar to, or higher than, cultivar BRS 231 may prove an impor-tant asset for farmers since with this level of resistance or tolerance they are likely to attain adequate yield levels in well managed fields where a single fungicide spray in a sea-son could suffice to obtain good disease control, resulting in higher economic returns and safer cropping.
Table 5- Expected percentage of random inbred lines higher yielding than BRS 231 derived from each cross in Experiments I and II.
Crosses Experiment I (%) Experiment II (%)
FT-2 x Embrapa 48 44.83 0.00
FT-2 x BRS 154 26.11 5.26
FT-2 x BRS 184 50.00 11.12
FT-2 x BRS 214 62.93 -*
FT-2 x BRS 231 40.13 -*
Embrapa 48 x BRS 154 31.92 15.15
Embrapa 48 x BRS 184 0.00 0.00
Embrapa 48 x BRS 214 62.17 3.01
Embrapa 48 x BRS 231 -* -*
BRS 154 x BRS 184 45.62 32.64
BRS 154 x BRS 214 0.00 11.12
BRS 154 x BRS 231 -* -*
BRS 184 x BRS 214 0.00 7.64
BRS 184 x BRS 231 54.78 45.22
BRS 214 x BRS 231 0.00 -*
*no estimate was possible because a genetic model could not be fitted to the data.
Table 4- Narrow sense heritability estimates (h2n) based on F3family
means from Experiments I and II.
Crosses Experiment I Experiment II
FT-2 x Embrapa 48 0.75±0.06 *
FT-2 x BRS 154 0.54±0.10 0.67±0.07
FT-2 x BRS 184 0.77±0.05 0.52±0.11
FT-2 x BRS 214 0.58±0.09 *
FT-2 x BRS 231 0.74±0.06 *
Embrapa 48 x BRS 154 0.61±0.09 0.58±0.09
Embrapa 48 x BRS 184 0.00 *
Embrapa 48 x BRS 214 0.53±0.11 0.62±0.09
Embrapa 48 x BRS 231 * *
BRS 154 x BRS 184 0.67±0.07 0.80±0.04
BRS 154 x BRS 214 * 0.70±0.07
BRS 154 x BRS 231 * *
BRS 184 x BRS 214 * 0.40±0.14
BRS 184 x BRS 231 0.80±0.05 0.76±0.05
BRS 214 x BRS 231 * *
Acknowledgments
The authors thank the Brazilian agencies Embrapa, CNPq and FINEP for the financial support. Embrapa Soy-bean provided scholarships to ASR and PHBP during this work.
References
Almeida AMR (2001) Observação de resistência parcial aSeptoria glycinesem soja. Fitopat Bras 26:214-216 (Abstract in Eng-lish).
Bromfield KR and Hartwig EE (1980) Resistance to soybean rust and mode of inheritance. Crop Sci 20:254-255.
Companhia Nacional de Abastecimento (2006) Previsão e Acom-panhamento das Safras. CONAB, Brasília.
Companhia Nacional de Abastecimento (2007) Acompanhamen-to da Safra Brasileira de Grãos - 9º LevantamenAcompanhamen-to. CONAB, Brasília.
Hartman GL, Sinclair JB and Rupe JC (1999) Compendium of Soybean Diseases. 4. ed. APS Press, St. Paul, 128 pp. Hartman GL, Miles MR and Frederick RD (2004) Soybean rust:
Historical significance and U.S. perspective, la hora del em-powerment. XII Congresso de Aapresid, Urbana, pp 245-250.
Hartwig EE (1986) Identification of a fourth major genes confer-ring to rust in soybeans. Crop Sci 26:1135-1136.
Jinks JL and Pooni HS (1976) Predicting the properties of recom-binant inbreed lines derived by single seed descent. Heredity 36:243-246.
Mather K and Jinks JL (1982) Biometrical Genetics. 3rd ed. Chap-man and Hall, London, 396 pp.
Pierozzi PEB, Ribeiro AS, Moreira JUV, Laperuta LDC, Rachid BF, Arias CAA, Oliveira MF and Toledo JFF (2008) New sources of qualitative genetic resistance to Asian soybean rust. Submitted to Braz J Genetic.
Ramalho MAP and Vencovsky R (1978) Estimação dos compo-nentes de variância genética em plantas autógamas. Ciência e Prática 2:117-140.
Ribeiro AS, Moreira JUV, Pierozzi PHB, Rachid BF, Toledo JFF, Arias CAA, Soares RM and Godoy CV (2007) Genetic con-trol of Asian rust in soybean. Euphytica 157:15-25. Souza RF and Toledo JFF (1995) Genetic analysis of soybean
re-sistance to stinkbug. Braz J Genet 18:593-598.
Toledo JFF (1987) Predicting the inbreeding and the outcrossing potential of soybean [Glycine max(L.) Merrill] varieties. Braz J Genet 10:543-558.
Senior Editor: Ernesto Paterniani