J. Braz. Chem. Soc. vol.14 número2
Texto
Imagem


Documentos relacionados
Agreements were defined as “a set of specific norms, resulting from consensus agreements among the users of fishing resources found in a certain geographical area, or […] a set
Figure 1 – D and Figure 2 –D display the cytotoxicity curves obtained for the standards tamoxifen, α-bungarotoxin and apamin in Vero and MDCK cells respectively, whereas Figure
In artificial systems, some common differences between genetic and learning operators are: genetic operators have a predefined probability of being applied to any individual,
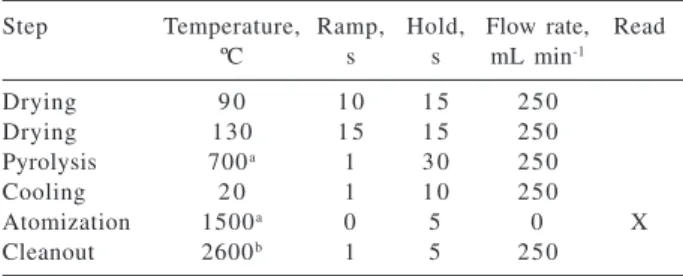
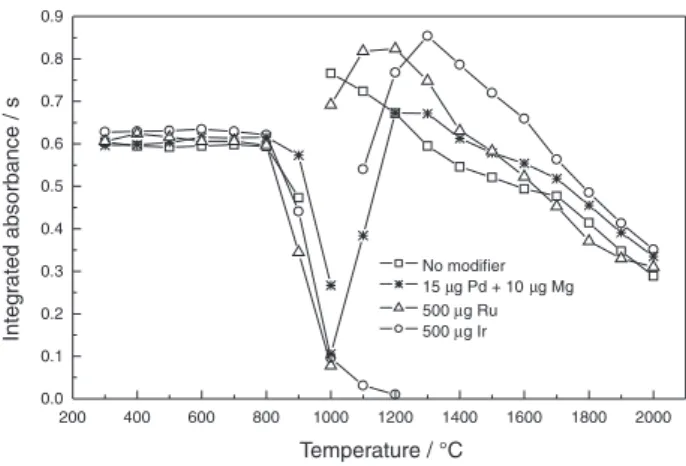
For comparison of the thermal behavior of lead submitted to a furnace temperature program on each of the surfaces used, pyrolysis and atomization temperature curves for lead in
UV-Vis absorption and photoluminescence emission (PL) spectra of the ZnS nanotubes are shown in Figure 3 (a) and (b), respectively. The UV-Vis absorption spectrum (Figure 3a)
DSC curves for samples are observed in Figure 15. The characterization of these polymeric germanium sulfide materials was presented and spectroscopic measurements confirmed
In this context, the present work investigates the superficial sediment characteristics of the Bragança mangrove area (Amazon coast, Brazil – Figure 1) and its correlations with
