Sustainable Competitive Advantage: A Survey of
Companies in Southern Brazil
Julio Cesar Ferro de Guimarães† Faculdade Meridional IMED
Eliana Andréa SeveroΩ
Faculdade Meridional IMED
César Ricardo Maia de Vasconcelos¥ Universidade Potiguar (UnP)
1. INTRODUCTION
Organizations are cast into a global environment with constant ma-rket turbulence, such as potential competitors, currency devaluation,
increases in interest rates and currency luctuations. Contemporary or -ganizations seek to administer their resources to achieve an
advanta-geous position in relation to competitors and, thus, remain competitive.
A competitive advantage is a constant pursuit of enterprises, because being in a privileged position, presenting unique features of services and/or products, raises and maintains this position in the in-dustrial sector, considering the enterprise’s relationships with other peers (PORTER, 1980; BARNEY, 1991a; 1991b; ARAUJO; PISANO;
SHUEN, 2003). The Resource-Based View (RBV) stands out as a
framework capable of analyzing the resources from the perspective
of Sustainable Competitive Advantage (BARNEY, 1991b), which as
-sists researchers and business managers in efective assessment of their resources. The RBV recommends that resources should have speciic
This article has a Creative Commons License - Attribution 3.0 Not Adapted.
Corresponding author:
† PPGA – Faculdade Meridional IMED
E-mail: [email protected] Ω PPGA – Faculdade Meridional IMED E-mail: [email protected]
¥ PPGA – Universidade Potiguar (UnP).
E-mail: [email protected]
Received: 02/07/2016. Revised: 03/04/2016. Accepted: 03/17/2016. Published Online: 02/01/2017.
DOI: http://dx.doi.org/10.15728/bbr.2017.14.3.6
ABSTRACT
A Sustainable Competitive Advantage emerges as an important factor in the perception of value of goods and services, which should be considered as elements of competitive diferentiation. his study aims at identifying the relationship between sustainable competitive advantage and organizational performance, as well as measuring the relationship of environmental sustainability and social responsibility as attributes of sustainable competitive advantage. In order to achieve that, a survey was carried out in 1496 diferent size companies and activity sectors in Brazil. For the data analysis and interpretation we used a structural equation modeling technique. he results indicate that the Sustainable Competitive Advantage construct is an important antecedent of organizational performance because it highlights fundamental attributes for organizations to achieve positive economic consequences. his research contributes to organizational management and to the scientiic community with the provision of a framework that assists in the identiication of relevant strategic resource features.
BBR
14,3
353
attributes, which could promote the diferentiation of the organization that is facing compe
-tition, thus obtaining a Sustainable Competitive Advantage (BARNEY, 1991b). Therefore, inluential variables, such as environmental and social aspects, are omitted or ignored.
Within this context, and in order to cover this gap in academic literature, this study aims
at creating a theoretical framework which covers social and environmental attributes. A sample of 1496 irms was used to validate this framework in order to bring it closer to companies’ realities.
In this scenario, environmental sustainability and social responsibility also emerge
as attributes for a sustainable competitive advantage. Environmental practices contribute
to the reduction of inputs used in production, better quality and lower production costs, as
well as less environmental pollution (SEVERO et al., 2015). Also, social responsibility
strategies are aimed at a better quality of life for employees, as well as the community as
a whole.
A sustainable competitive advantage emerges as an important factor in the percep-tion of goods and services value, which should be considered as elements of competitive
advantage. From this context, the objective of this study is to identify the relationship be -tween sustainable competitive advantage and organizational performance, as well as to measure the relationship between environmental sustainability and social responsibility as attributes of sustainable competitive advantage through a survey of 1496 companies of
dif-ferent sizes and segments in the state of Rio Grande do Sul (Brazil).
2. RESEARCH HYPOTHESES
2.1 RESOURCE-BASED VIEW (RBV), ENVIRONMENTAL
SUS-TAINABILITY AND SOCIAL RESPONSIBILITY
The RBV is related to the accumulation of the valuable, rare, inimitable and
non-substitutable resources, which are the basis of enterprise competitiveness and economic
rent (BARNEY, 1991a; LIN; WU, 2014). Accordingly, resources are elements which are
inherent to the company and generate value to the organization, which can only be trans-ferred with costs and with which the organization is able to develop strategies to maintain or obtain a particular competitive market position (BARNEY 1991a, 1991b; BESANKO
et. al., 2013). Strategic resources must present some attributes: Valuable Resources;
Rare Resources; Imperfectly Imitable Resources; Strategically Irreplaceable (Durable) (BARNEY, 1991a; 1991b) in order to generate a sustainable competitive advantage for
the company. As a complement, Peteraf (1993) requires that the resources must have tools
to avoid their wearing out as time goes by, which refers to the resource capacity of
own-ing an imperfect imitability and exchangeability. Makadok (2001) believes that strategic resources can inluence other resources, increasing productivity by expanding an organiza
-tion competitiveness.
Another important factor is the organization capacity to adapt to context changes, which is called by Teece, Pisano and Shuen (1997) as a dynamic capacity and which hap-pens through resources and competencies interaction (both functional and organizational)
in order to obtain competitive advantage. In this sense, Araujo, Dubois and Gadde (2003) highlight that performance and irm limits are inluenced by the decisions over the way the organization relates to other peers in their environment. The contributions from Teece, Pisano and Shuen (1997) and Araujo, Dubois and Gadde (2003), widen Porter’s (1980) and
Barney’s (1991a; 1991b) views as they show the dynamics of the relationships between
resources, dynamic capacities, industry position and stakeholders.
BBR
14,3
354
Araujo, Dubois and Gadde (2003), strategic resources must also have characteristics that
conform to environmental sustainability and social responsibility in order to improve the
organization performance (LO; SHEU, 2007; MONEVA, LIRIO, TORRES, 2007; GHOUL et al., 2011; DE GUIMARÃES et al., 2014).
In literature, discussions regarding environmental sustainability consider mainly the aspects that encompass renewable natural resources, environmental impacts and
environ-mental practices used by organizations (ROY; BOIRAL; LAGACÉ, 2001; KOLK, 2003; NIEMEIJER, 2004; SHARMA; HAGOS, 2005; GRI, 2013; SEVERO et al., 2015).
The performance indicators recommended by the Global Reporting Initiative (GRI, 2013), a pioneer in the world of sustainability reporting information and, currently, the most widely used sustainability report on the market, aim at describing the economic, envi-ronmental and social impacts, such as Triple Bottom Line (ELKINGTON, 1997), as a way
to certify the sustainability of a company. Research from multinational companies show
that environmental sustainability is an important factor for obtaining a higher performance, considering the potential of reducing costs and gains on the company’s image (TUKKER,
2004; GONZÁLEZ-BENITO; GONZÁLEZ-BENITO, 2006; VAN BOMMEL, 2011; GOLINI; LONGONI; CAGLIANO, 2014).
Environmental sustainability is currently seen in organizations as an area that, in addition to dealing with environmental issues, can become a source of competitive
advan-tages. This is because its principles are the use of environmental practices (SEVERO et al.,
2015) that minimize waste and reduce inputs used in production, resulting in better produc-tivity and, consequently, increased competitiveness and improved organizational
perfor-mance. Another way to improve performance is by using social responsibility as an ally in
shaping the organization image and as a motivator for people involved in the process with
the irm. In this sense, Dorion et al. (2015) take into account that the improvement projects
should consider the impacts on the various stakeholders for, with the involvement of dif-ferent peers, it is possible to widen the internal team potentialities and promote intangible
gains which contribute to the organization competitiveness.
Social responsibility has been constantly discussed in recent years, due to the vari-ous transformations that have been taking place in the business world; the theme is no
longer only the government’s responsibility and is now discussed by the companies. This
is why it is understood as the organizational management’s obligation to decide and take actions that improve social well-being, supporting the interests of society and the
compa-ny as well (CARROLL, 1999; BAKER; NASER, 2000; KUASIRIKUN; SHERER, 2004; MONEVA, LIRIO, TORRES, 2007; ATTIG et al., 2013).
Once social responsibility initiatives have been put into action, it is necessary to ensure life quality for local populations, removing political and institutional obstacles to their social integration, ensuring their participation in development strategies and the
main-tenance of natural capital stock (AGRAWAL; 2001; EKINS et al., 2003).
When discussing the role of social responsibility organizations, Porter and Kramer (1999) state that added value is created through philanthropy by motivated, informed and passionate people who are responsible for their choice of culture, values, history and
conti-nuity of the actions of corporate social responsibility.
Adding ethical and socially responsible behavior to their abilities, organizations earn the respect of people and communities that are impacted by their activities, which
leads society to recognize their attitudes. Accordingly, social responsibility is becoming
an increasingly important factor for business success, which creates new prospects for building a world that is more prosperous and socially and economically fair (INSTITUTO
ETHOS, 2013; AGAFONOW, 2014; LO; SHEU, 2007; GHOUL et al., 2011)
BBR
14,3
355
the company’s image ahead to stakeholders, but it does not guarantee an increase in market
(ORLITZKY; SCHMIDT; RYNES, 2003; SURROCA; TRIBÓ; WADDOCK, 2010). The precepts of the RBV are key to obtaining competitive advantage. However, it is crucial that
resources also present the attributes of environmental sustainability and social
responsi-bility (GUIMARÃES et al., 2015). This premise is the theoretical basis for the following hypothesis:
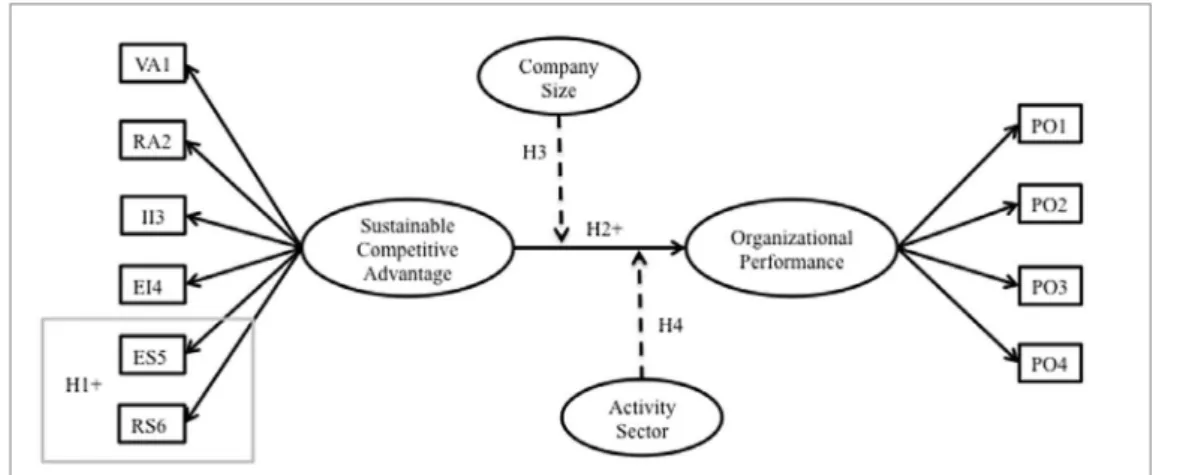
H1: the attributes of environmental sustainability and social responsibility are
con-tributing positively to the construct of sustainable competitive advantage.
2.2 SUSTAINABLE COMPETITIVE ADVANTAGE AND
ORGA-NIZATIONAL PERFORMANCE
Because of the importance of Sustainable Competitive Advantage (SCA) to the long-term success of irms, the existing literature addresses its content as well as its sourc
-es, and the diferent types of strategies that may help companies achieve SCA (KIM et al., 2012). Literature distinguishes competitive advantage with respect to market-related strat -egies (external) (PORTER, 1980) and the internal capabilities of a company (BARNEY,
1991a; 1991b). Market strategies relate directly to managerial decisions positioning the
company in the forefront of industry competitors, whereas the capacities are related to
the resources that the company has to face in the competition. Supporting the diferent vi
-sions, Porter (1980; 1991) and Caves (1984) highlight that a competitive advantage can be derived not only from speciic resources but also from privileged market positions as well.
Although studies by Porter (1980; 1991) and Barney (1991a; 1991b) show distinct approaches for obtaining competitive advantage, other authors conclude that these views
do not have an excluding nature, like the Besanko et al. (2013) case, upon highlighting that
the sustainability of a competitive advantage depends on the isolation mechanisms, which
may be deined as factors that stop competitors from neutralizing a higher performance in
a given company, and which can be obtained by innovation, organization evolution and
the company’s domestic environment (or industry position). As a contribution to the aca
-demic discussion, Araujo, Dubois and Gadde (2003) warn about the inter-organizational
relationships, and Teece, Pisano and Shuen (1997) state that the resources may be turned into routines which power up the organization performance results, composed of dynamic
capacities. Consistently, it is pointed out that there is some view complementariness (both internal and external) of sustainable competitive advantage.
For practical purposes, the sustainable competitive advantage must be translated into a higher performance compared to competitors. According to Paladino (2007), the organizational performance targets the quality and proitability of goods and services and
the return on investments, as well as the reduction of operational costs, compounding the
overall performance of the company against the competition. According to Neely, Gregory and Platts (2005), performance evaluation can be deined as the process of quantifying an action, in which the measurement is equated with quantiication, and the action is under
-stood as that which leads to performance.
The need to include non-inancial measures to evaluate organizational performance
originated with the organizations’ needs to become competitive in a new context in which
inancial measures alone were no longer enough (CHENHALL; LANGFIELD-SMITH, 2007). In this context, the performance measure represents a way to understand an orga
-nization’s performance. It deals with the need to use a combination of inancial and non-inancial indicators (GARENGO; BIAZZO; BITITCI, 2005; MERCHANT, 2006). One example is highlighted in Hogan and Coote (2014): the efect of innovative behaviors on
organizational performance is more strongly positive than that of values supporting
BBR
14,3
356
suitable for future analyses (SHAHIN; MAHBOD, 2007). Based on the literature, it was identiied that sustainable competitive vantage inluences organizational performance as stated in the following hypothesis:
H2: A sustainable competitive advantage is positively related to organizational
performance.
The literature shows that there is evidence of diferences in the results of competi -tive advantage when considering the size of the companies, based on the premise that larger companies have a more complex structure, which supports the development of competitive
advantages, such as the innovativeness. The variable size of the company can be observed in studies of Traill and Meulenberg (2002), Avermaete et al. (2004) and Triguero, Córcoles and Cuerva (2013).
In this sense, this study presupposes that the impact on the relationship between
sustainable competitive advantage and organizational performance can be inluenced by
moderating company size and industry, since this research was conducted with several
diferent-sized companies (micro and small businesses – MSBs –, medium and large com
-panies – MLCs) and in diferent industries (manufacturing industrial, commercial and ser
-vices), which led to the development of hypotheses 3 and 4:
H3: Company size has a moderating efect on the relationship between sustainable competitive advantage and organizational performance.
H4: Company industry has a moderating efect on the relationship between sustain
-able competitive advantage and organizational performance.
Figure 1 represents the theoretical model which composes the three hypotheses of the research presented in the study.
3. METHODOLOGY
In this study, a survey was carried out with 1,496 companies of diferent sizes and in diferent industries in the State of Rio Grande do Sul (Brazil), aiming at identifying the
relationship between sustainable competitive advantage and organizational performance, as well as measuring the relationship between environmental sustainability and social re-sponsibility whileattributes of sustainable competitive advantage. To meet the objective of
this research, we used Structural Equation Modeling (SEM) that seeks to analyze the rela
-tionships between constructs based on the theoretical precepts supported in the literature. Note that for the test of Hypothesis 3 (H3), two distinct groups were considered: Group 1: composed of micro enterprises (annual revenues up to R$ 360,00) and small companies (annual revenues between R$ 360,00 and R$ 3.6 million); Group 2: midsize enterprises (annual revenues between R$ 3.6 million and R$ 300 million) and large enter
-prises (annual revenues with more than R$ 300 million). For the tests of Hypothesis 4 (H4),
we used three groups related to the industry, in which direct choices of respondents were
considered in relation to the options of the Manufacturing (MAN), Commercial (COM) or Services (SER) industries.
The survey was performed using the descriptive research method and with the ap-plication of questionnaires, which were drawn from academic research and practices of
BBR
14,3
357
Data collection occurred between the months of July 2014 and May 2015, obtained through personal contact, telephone and the Internet. Initially, a pre-test with 36 cases was given to business managers in order to validate the understanding of the questionnaire. Subsequently, the answers to the pre-tests were included in the survey data.
For data analysis, SEM uses a set of methodological statistical analysis procedures,
enabling the testing of dependency relationships simultaneously and the measurement of
the intensity of these relationships (HAIR Jr. et al., 2007; KLINE, 2005). SEM consid -ered the sample size (n) as a minimum of 10 respondents for each observable variable
(HAIR Jr. et al., 2007). This survey used 137 respondents, which contributes to Maximum Likelihood Estimation. Therefore, SEM obtained a total sample of 1,496 valid cases, above the recommended amount, which is at least 200 respondents (KLINE, 2005). In this data, missing values have not been identiied. The sample is composed of diferent-sized com
-panies located in the state of Rio Grande do Sul, Brazil. The selection of com-panies for the survey was random: taken from the organizations listed in the Federation of Industries of the state of Rio Grande do Sul (FIERGS, 2013), which has about 47,000 industrial compa
-nies and the Federation of the Commercial and Services of the state of Rio Grande do Sul (FECOMÉRCIO-RS, 2013), which has approximately 570,000 companies.
Tabulation and statistical treatment of data were performed using the SPSS ®
(Statistical Package for Social Sciences), Version 21, software for Windows® and SEM was applied with the use of AMOS software ®, Version 21, coupled with SPSS®, which, ac
-cording to Byrne (2010), present the functions required for the analysis that SEM demands. Conirmation of the proposed model (Figure 1) occurred with the use of Exploratory Factor Analysis (EFA) and Conirmatory Factor Analysis (CFA), to measure the relationship be
-tween the variables of each construct. Cronbach’s Alpha was used to verify the combination of observable and latent variables (constructs) with an expected value over 0.7 (HAIR Jr. et al., 2007), to verify simple reliability of observable variables. Another analysis technique
that we used was the Kurtose Index, in which each observable variable is evaluated through
the Mardia’s coeicient, with an expected value less than 5 (MARDIA, 1971).
EFA examined: i) the factorial charges, which represent the correlations between
measured indicators and the latent variable, in which the accepted value is equal to or
greater than 0.5; ii) Bartlett’s Test of Sphericity and Kaiser-Meyer-Olkin Measure of Sampling Adequacy (KMO), with values above 0.5, which gives viability to EFA; iii) the Communalities that must show factor loadings with values greater than 0.5 (HAIR Jr. et al., 2007); and, iv) multicollinearity, evaluated through Pearson’s correlation coeicient, which is expected to be less than 0.8.
BBR
14,3
358
4. RESULTS AND DISCUSSIONS
Prior to the analysis, the data was debugged. This process identiied and deleted
72 questionnaires that were considered outliers, as these contained responses focused on
unique alternatives, showing inconsistency in relation to the rest of the data. The electronic form did not register the responses if a question was left unanswered. Thus, there were no cases of non-answers. At this research stage, the analysis sought to identify extreme scores, with univariate and multivariate outlier analysis (KLINE, 2005; HAIR Jr. et al., 2007), us -ing Z score calculation for univariate, which did not identify cases with values greater than
3.3 for each variable. To identify multivariate outliers, the analysis applied the Mahalanobis
calculation, which found no cases with a very large distance between the individual value
and sample averages.
After data debugging, the analysis considered 1,496 cases valid, which present the
following characteristics: 36.7% processing industries; 30.8% commercial; 32.5% servic
-es; 37% micro enterpris-es; 42.2% small business-es; 11.4% midsize enterpris-es; 9.4% large enterprises; 89.6% with social capital of Brazilian origin; 3% multinationals; and 7.4% mixed-capital companies (Brazilian and foreign capital).
Analysis of the theoretical model (Figure 1) started with implementation of EFA using Varimax rotation for the veriication of the relationship between the variables of each construct, resulting in two main factors (Table 1), with 69.01% explanation of variability, with all factor loadings above 0.4 as recommended. The variable EI4 presented 0.417 of commonality, which is lower than the recommended value (>0.5). However, we decided to keep it, due to the scientiic importance of the composition of the sustainable competitive advantage construct.
The results of the Initial Integrated Model show the AVE of the constructs in Table 2 (SCA 0.737; OP 0.749), which should be greater than 0.7. The DV has a value of 0.300, which is less than the AVE, since the correlations between constructs (Discriminant Validity) should be less than the convergent validity (Average Variance Extracted). With the results of these indexes, we took the observable variables as consistent in their measurements.
To evaluate Hypothesis 1 (H1), which states that the attributes of environmental sustainability and social responsibility are contributing positively to the construct of sus-tainable competitive advantage, the factor loadings of these attributes were examined and
presented the variable factors ES5 0.896 and RS6 0.897. In the case of EFA, with Varimax rotation, the variables ES5 and RS6 were grouped by SPSS in the same group as VA1, RA2, II3 and EI4 variables, totaling 39.69% of data variability explanation. These results show that the H1 hypothesis has been conirmed.
For the construct of Sustainable Competitive Advantage, the sample displays a Cronbach’s Alpha of 0.875, and for the Organizational Performance construct there was a Cronbach’s Alpha of 0.859, i.e. above 0.7 (HAIR Jr. et al., 2007), providing reliability to data sets. Bartlett’s sphericity test proved to be signiicant and the measure of adequacy of KMO presented an index of 0.725, demonstrating the feasibility of EFA. The Kurtosis index assessment, through the Mardia’s coeicient, obtained values less than 5 (MARDIA,
1970; BENTLER, 1990), leading to the conclusion that there is normality of data, enhanced
by the analysis of Pearson asymmetry coeicients, which resulted in values close to zero, indicating a moderate symmetry (KLINE, 2005; HAIR Jr. et al., 2007).
In the Pearson correlation analysis, the correlations between observable variables
with values above 0.8 were not identiied, and there was no multicollinearity among vari
-ables. With the validation of scales and constructs that articulate the theoretical model,
the analysis of the integrated model (model of measurement and structural) was done to
measure the relationships between constructs (Figure 1), considering the model’s rates of adjustment and the statistical signiicance of the coeicients estimated, following the pre
BBR
14,3
359
For the test of the covariance hypothesis, which is displayed in Table 3, the re
-sults indicate signiicant relationships for the Standardized Coeicient (SC), the Standard Deviation and Critical Ratio (CR) of the Initial Integrated Model (Figure 1), which does not consider the efect of moderation of company size and industry, as this model does not evaluate the possible correlations between observable variables. The test results of the Initial Integrated Model correlation hypothesis (Table 4) present the Estimate Coeicient (EC) that is signiicant in the relationship between the constructs. These results conirm the
H2 hypothesis because they demonstrate the positive relationship between the constructs of
sustainable competitive advantage and organizational performance.
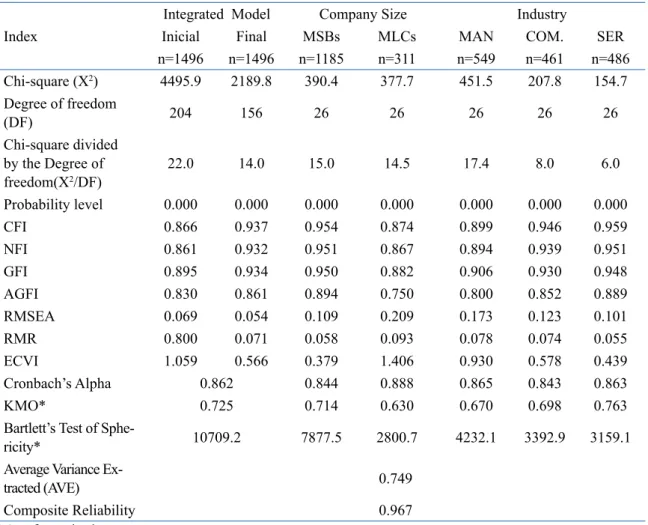
Table 5 presents the AMOS output indexes report for the Initial and Final Integrated Model, as well as the indexes when considering company size (MSBs and MLCs) and in
-dustry of the enterprises (industrial manufacturing, commercial and services). The results show that the AVE obtained for the variables altogether was 0.749, which is higher than the recommended value (>0.7), and the Composite Reliability obtained 0.967, higher than the 0.5 minimum. These results allow one to consider that observable variables are consistent in their measurements. Based on the premises of Hair Jr. et al. (2007) and Marôco (2010), these indexes corroborate the internal reliability of the data set.
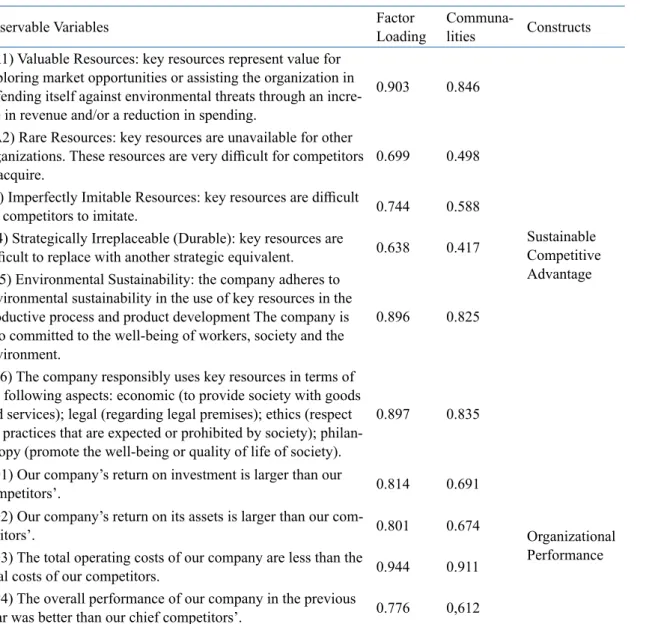
Table 1.Factor Loadings of observable variables – Varimax Rotation
Observable Variables Factor
Loading
Communa
-lities Constructs
VA1) Valuable Resources: key resources represent value for
exploring market opportunities or assisting the organization in defending itself against environmental threats through an
incre-ase in revenue and/or a reduction in spending.
0.903 0.846
Sustainable
Competitive
Advantage
RA2) Rare Resources: key resources are unavailable for other organizations. These resources are very diicult for competitors
to acquire. 0.699 0.498
II3) Imperfectly Imitable Resources: key resources are diicult
for competitors to imitate. 0.744 0.588
EI4) Strategically Irreplaceable (Durable): key resources are
diicult to replace with another strategic equivalent. 0.638 0.417 ES5) Environmental Sustainability: the company adheres to
environmental sustainability in the use of key resources in the productive process and product development The company is also committed to the well-being of workers, society and the
environment.
0.896 0.825
RS6) The company responsibly uses key resources in terms of
the following aspects: economic (to provide society with goods
and services); legal (regarding legal premises); ethics (respect for practices that are expected or prohibited by society);
philan-thropy (promote the well-being or quality of life of society).
0.897 0.835
PO1) Our company’s return on investment is larger than our
competitors’. 0.814 0.691
Organizational Performance PO2) Our company’s return on its assets is larger than our
com-petitors’. 0.801 0.674
PO3) The total operating costs of our company are less than the
total costs of our competitors. 0.944 0.911
OP4) The overall performance of our company in the previous
BBR
14,3
360
The measurement indexes and model adjustment model are used in the analysis
to determine the degree in which the model measurement predicts the matrix of
covari-ances. In this sense, the index that calculates the value of Chi-square (X2) divided by
the Degree of Freedom (DF) obtains a value of 22 in the Initial Integrated Model, which is above the threshold of 5.0 suggested by Tanaka (1993), showing that the model may not be suitable for this sample. However, this is not a criterion for the elimination of the integrated model, though it does suggest that it may undergo adjustments in order to it the empirical data.
Table 5 shows that, for the Initial Integrated Model, the CFI indexes (0.866), NFI (0.861), AGFI (0.830) and GFI (0.895) resulted in lower values than the recom
-mended value of 0.9 (Hair Jr. et al., 2007; Kline, 2005), reinforcing the model inad
-equacy. The RMSEA presents the value of 0.069, which is within the limits suggested by Hair Jr. et al. (2007) and Kline (2005), between 0.05 and 0.08. The RMR presents the value of 0.800 and ECVI of 1.059, considered low values which were expected for this research, because Marôco (2010) recommends that the lower these values are, the better the adjustment of the integrated model is.
Additionally, the adjustment indexes and measurement model are presented in Table 5 (Figure 1), considering the variables of company size and industry of the sur
-veyed companies. One can observe that these diferent groups have indexes (CFI, NFI, AGFI and GFI) with values close to the recommended amount (0.9) and the higher-valued RMSEA of the Initial Integrated Model. These results support the inadequacy of the model, considering the moderating efect of company size and industry on com
-panies. The indexes show the inadequacy of the integrated model. However, this does
not invalidate the H2 hypothesis, which was validated in the hypothesis tests (Tables
3 and 4).
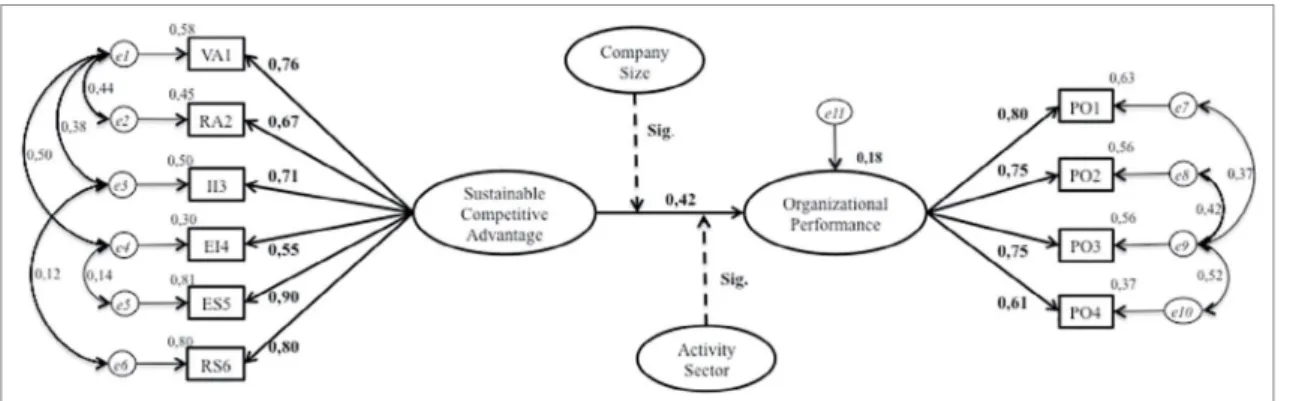
As a solution for improving indexes of measurement adjustments, the Final Integrated Model was developed (as shown in Figure 2), which kept the observable variables and admitted the correlation between some variables (->RA2; VA1<-->II3; VA1<-->EI4; EI4<-->ES5; II3<-->RS6). This correlation solution considers Valuable Resources (VA1) to be an important articulator between the attributes of Rare
Resources (RA2), Imperfectly Imitable Resources (II3) and Strategically Irreplaceable
(Durable) (EI4). It corroborates the indings of the research of Barney (1991b) and Makadok (2001) that analyzes the features and enhancing efects of interactions among
resources, resulting in unique and distinctive capacities to generate competitive
advan-tages. The correlation between attributes EI4 and Environmental Sustainability (ES5)
is supported in surveys done by Elkington (1999), Benito and
González-Benito (2006), which introduced the interaction and the beneits of environmental sus
-tainability. Consistently, the correlation between II3 and Social Responsibility (SR6)
is based on arguments such as those found in studies by Porter and Kramer (1999) and
Moneva, Lirio and Torres (2007), which warn about the distinct potential that comes as a result of the actions of corporate social responsibility.
Table 2.Convergent Validity and Discriminant Validity – Initial Integrated Model
Constructs SCA OP
Sustainable Competitive Advantage (SCA) 0.737a
Performance organizacional
0.300b 0.749a
Organizational Performance (OP)
BBR
14,3
361
The Final Integrated Model presented results of signiicant relationships in hy -pothesis testing of covariance with increased values found, which are expressed in
Table 6 (SC=0.426; SD=0.031; CR=13,809). Correlation hypothesis testing of the Final Integrated Model presents signiicant results with an Estimate valued Coeicient (EC) of 0.422, supporting the conirmation of the H2 hypothesis.
The adjustment indexes and measurement of the Final Integrated Model exhibit re
-sults with values higher than or close to the recommended value (CFI 0.937; NFI 0.932; AGFI 0.861; GFI 0.934). When compared to the Initial Integrated Model, the RMSEA (0.054), RMR (0.800) and ECVI (0.566) values demonstrate the adequacy of the model (Figure 2).
To test the moderating efects of company size and industry on the relationship
between the sustainable competitive advantage and organizational performance
con-structs (Figure 1), we applied the SEM multi-group technique, dividing the sample into ive groups: i) micro and small enterprises; ii) midsize and large enterprises; iii) indus
-trial manufacturing; iv) commercial; v) services. In accordance with Byrne’s (2010) recommendation, in the analysis of multigroup, all the paths in a model are ixed, ex
-cept the path to be tested as diferent between the groups.
We conducted tests to verify the efect of moderating company size. Additionally, ANOVA was performed to check if the respondents displayed divergent behavior com
-pared to groups of diferent-sized companies, showing that there is a signiicant dif
-ference between the respondents in groups (Di-ference X2), which conirms the H3
hypothesis. The results show that midsize and large enterprises have greater intensity ratios (SC=0.461; EC=0.497) than micro and small enterprises (SC=0.400; SC=0.373).
The moderating efect of business enterprise industry, which presents a sig
-niicant diference between the groups of respondents (Diference X2), and was
prov-en by ANOVA, conirms the H4 hypothesis. The results show that the service sec
-tor has greater intensity ratios (SC=0.548; EC=0.498) than industrial manufacturing (SC=0.442; EC=0.456) and commercial (SC=0.305; EC=0.277).
Analysis of the inal integrated model and the models that consider the efects
of company size and industry moderation showed the results of the factor loadings of
the observable variables (EFA), the validity and reliability of variables (KMO, AVE, Composite Reliability, Cronbach’s Alpha), as well as the adjustment model indexes (CFI, NFI, AGFI, GFI, RMSEA, RMR, ECVI), which work as support for stating that the H1, H2 and H3 hypotheses have been conirmed and the relationships which were highlighted in the inal model (Figure 2) are in accordance with this research. These results also show they are statistically signiicant.
5. FINAL CONSIDERATIONS
This research enabled the identiication of relationships between the Sustainable Competitive Advantage (SCA) and the Organizational Performance (OP), as well as
the measurement of the relationship between the Environmental Sustainability (ES)
and the Social Responsibility (SR), while SCA attributes, through a survey carried out in diferent enterprises in diferent economy sectors, analyzed by the Structural Equation Modeling methodology. Among the indings in the research, we point out that SCA inluences OP positively with the support of strategy resources ownership, just like ES and SR are part of the SCA attributes (Valuable Resources; Rare Resources; Imperfectly Imitable Resources; Strategically Irreplaceable – Durable), and which can be seen through this research’s results.
The results show that the Sustainable Competitive Advantage construct is an
important antecedent of Organizational Performance, because this shows fundamental
BBR
14,3
362
Table 3. Hypothesis test (covariance) – Initial Integrated Model
Constructs Coeicient (SC)Standardized Standard
De-viation (SD) Critical Ratio(CR) p
Organizational
Performance
<---Sustainable
Competitive
Advantage
0.278 0.025 11.227 ***
*** Signiicance level p<0.001.
Table 4.Hypothesis test (correlation) – Initial Integrated Model
Constructs Estimate Coeicient (EC)*
Organizational Performance <--- Sustainable Competitive Advantage 0,300
* Signiicance level p<0.001.
Table 5. Adjustment index of the proposed model
Index
Integrated Model Company Size Industry
Inicial Final MSBs MLCs MAN COM. SER
n=1496 n=1496 n=1185 n=311 n=549 n=461 n=486
Chi-square (X2) 4495.9 2189.8 390.4 377.7 451.5 207.8 154.7
Degree of freedom
(DF) 204 156 26 26 26 26 26
Chi-square divided
by the Degree of
freedom(X2/DF)
22.0 14.0 15.0 14.5 17.4 8.0 6.0
Probability level 0.000 0.000 0.000 0.000 0.000 0.000 0.000
CFI 0.866 0.937 0.954 0.874 0.899 0.946 0.959
NFI 0.861 0.932 0.951 0.867 0.894 0.939 0.951
GFI 0.895 0.934 0.950 0.882 0.906 0.930 0.948
AGFI 0.830 0.861 0.894 0.750 0.800 0.852 0.889
RMSEA 0.069 0.054 0.109 0.209 0.173 0.123 0.101
RMR 0.800 0.071 0.058 0.093 0.078 0.074 0.055
ECVI 1.059 0.566 0.379 1.406 0.930 0.578 0.439
Cronbach’s Alpha 0.862 0.844 0.888 0.865 0.843 0.863
KMO* 0.725 0.714 0.630 0.670 0.698 0.763
Bartlett’s Test of
Sphe-ricity* 10709.2 7877.5 2800.7 4232.1 3392.9 3159.1
Average Variance Ex
-tracted (AVE) 0.749
Composite Reliability 0.967
* Signiicance level p<0.001.
Table 6. Hypothesis Test (covariance and correlation) – Final Integrated Model
Construtos Standardized Coeicient
(SC)
Standard De-viation (SD)
Critical
Ratio (CR) Estimate Coeicient (EC)- p
Organizational
Performance
<---Competitiva
Sustentável 13,809 0,031 13,809 0,422 ***
Vantagem
BBR
14,3
363
Figure 2. Final Integrated Model – Standardized Regression Weights.
sense, the managerial implications of this research are focused on two aspects: i) the RBV with VA1, RA2, II3 and EI4 attributes is able to generate competitive advantage, which results in a higher performance; ii) in RBV, one must consider ES5 and RS6 at
-tributes, which characterize Corporate Social Responsibility (CSR), and also extend the organization competitive capacity and performance. This statement is based on the results which conirmed the H1 and H3 hypotheses.
Additional complementary data are that 21.1% (303 companies) claim to pos
-sess RBV and CSR, conirmed by the replies equal to/greater than 3 on the Likert scale, in all matters of RBV/CSR (VA1, RA2, II3 and EI4, ES5, RS6), and of these, 103 com -panies also claim to possess higher performance, as noted by the answers of equal to/
greater than 3 in the performance variables (PO1, PO2, PO3, PO4). These data reinforce
the importance, when forwarded to managers of organizations, in the search to identify strategic resources that have the attributes presented by Barney (1991a; 1991b) and the environmental and social responsibility advocated by the Ethos Institute (2013), Gri
(2013) and Severo et al. (2015).
Statistical evidence, obtained through applying AFA, through the SEM method
-ology, allows managers to ind attributes of resources for performance improvement, as well as provide the scientiic community with a framework for resource characteristic analysis that can lead to sustainable competitive advantage. Other academic contribu -tions are the environmental sustainability and social responsibility attributes for the
RBV, which increase the importance of research done by Lo and Sheu (2007), Ghoul et al. (2011), and Severo et al. (2015), reairming that these attributes are drivers of proitability, and improving social welfare and the environment.
The intensity of the relationship between the constructs of sustainable competi-tive advantage and organizational performance is evident when analyzing the results of
SC and CE of the general-integrated model. However, there is a signiicant diference between the respondents of the diferent-sized enterprises, emphasizing that the micro/ small companies have a positive relationship (SC and CE) between the constructs, but these are inferior to the results presented by medium/large enterprises. These results are expected, since larger companies have inancial and technical resources that allow a better use of what is available to increase performance results. In this sense, this paper contributes to the academic research, conirming the need to consider the moderating variable of intensity in the relationships of cause and consequence.
The results show that the Sustainable Competitive Advantage construct is an
important antecedent of organizational performance, because this shows fundamental
BBR
14,3
364
sense, the managerial implications of this research are focused on two aspects: i) the RBV with VA1, RA2, II3 and EI4 attributes is able to generate competitive advantage, which results in a higher performance; ii) in RBV, one must consider ES5 and RS6 attributes, which characterize Corporate Social Responsibility (CSR) and also extend the organization competitive capacity and performance. This statement is based on the results which conirmed the H1 and H2 hypotheses.
6. CONCLUSION
The main contribution of this study is related to the advancement of science in busi-ness administration, expansion of academic studies and the support of managerial
deci-sions. In this sense, the following can be highlighted:
a) contributions to the advancement of science through the realization of an empirical research that conducts tests of theoretical precepts discussed by
diferent researchers on the topic of sustainable competitive advantage by using the theories of Resource-Based View (VBR). Note that this research adds new factors to VBR, considering the need to include the characteristics
of strategic resources, the social responsibility elements and environmental
sustainability that have been tested and proved to be statistically signiicant,
which allows science to promote new studies;
b) the academic contributions of this research are related to the framework de-veloped for this study, which allows researchers to analyze the sustainable
competitive advantage and the organizational performance in diferent com -panies, with the increase of the characteristics of social and environmental
responsibility. This study can serve as a basis for further research in other countries and in diferent areas of activity.
c) this study provides management contributions related to provision of results, and could show that the company performance can be obtained with the use of strategic resources and that there is no need to include the environmental and social precepts in the search for competitive advantage to improve the
economic success of the organization.
This study presents limitations to generalizing the results to diferent realities, because, though it included a signiicant number of respondents, it cannot be the only
parameter of managerial decision-making in identifying attributes of strategic
resourc-es. Thus, a new research for other contexts using this framework for data analysis is recommended. Another limitation of this study refers to the use of theoretical basis
which supports the research, since we used an array of important works that do not
abridge the scientiical knowledge on Administration in relation to the organizational strategies.
7. REFERENCES
AGAFONOW, A. Toward a positive theory of social entrepreneurship on maximizing versus satisicing value capture. Journal of Business Ethics, v. 125, n. 4, p. 709-713, 2014.
AGRAWAL, A. Common property institutions and sustainable governance of resources. World Develo-pment, v. 24, n. 3, p. 347-364. 2001.
ARAUJO, L. M.; DUBOIS, A.; GADDE, L. E. The multiple boundaries of the irm. Journal of Manage-ment Studies, v. 40, n. 5, 1255-1271, 2003.
ATTIG, N.; EL GHOUL, S.; GUEDHAMI, O.; SUH, J. Corporate Social Responsibility and Credit Ra
BBR
14,3
365
AVERMAETE, T.; VIANE, J.; MORGAN, E. J.; PITTS, E.; CRAWFORD, N.; MAHON, D. Determi
-nants of product and process innovation in small food manufacturing irms. Trends in Food Science & Technology, v.15, n. 10, 474-483, 2004.
BAKER, N. A.; NASER, K. Empirical evidence on corporate social disclosure (CSD) practices in Jor
-dan. International Journal of Commerce and Management, v. 10, n. 3-4, p. 18-34, 2000.
BARNEY, J. B. The resource-based model of the irm: origins, implications, and prospects. Journal of Management, v. 17, n. 1, p. 97-98, 1991a.
BARNEY, J. B. Firm resources and sustained competitive advantage. Journal of Management,v. 17, n. 1, p. 99-120, 1991b.
BESANKO, D.; DRANOVE, D.; SHANLEY, M.; SCHAEFER, S. Economics of strategy. 6 ed. Hobo
-ken: Wiley, 2013.
BYRNE, B. M. Structural equation modeling with AMOS: basic concepts, applications and program
-ming. 2 ed. New York: Taylor & Francis Group, 2010.
CARROLL, A. Corporate social responsibility: evolution of a deinitional construct. Business Society,v.
38, n. 3, p. 268-295, 1999.
CAVES, R. E. Economic analysis and the quest for competitive advantage. The American Economic Review,v. 74, n. 2, p. 127-132, 1984.
CHENHALL, R. H.; LANGFIELD-SMITH, K. Multiple perspectives of performance measures. Euro-pean Management Journal, v. 25, n. 4, p. 266-282, 2007.
DE GUIMARÃES, J. C. F.; SEVERO, E. A.; DORION, E. C. H. Cleaner production and environmental sustainability: multiple case from serragaúcha-Brazil. Espacios (Caracas). v. 35, n. 4, p. 8, 2014. DORION, E. C. H.; GUIMARÃES, J. C. F.; SEVERO, E. A.; REIS, Z. C.; PRODANOV, C. C.; OLEA,
P. M.; NODARI, C. H. Innovation and production management through a just in sequence strategy in a multinational brazilian metal-mechanic industry. Australian Journal of Basic and Applied Sciences,
v. 9, n. 2, p. 100-107, 2015.
ELKINGTON, J. Cannibals with Forks: The Triple Bottom Line of 21st Century Business. Oxford:
Capstone Publishing, 1997.
EKINS, P.; SIMON, S.; DEUTSCH, L.; FOLKE, C.; DE GROOT, R. A framework for the practical ap
-plication of the concepts of critical natural capital and strong sustainability. EcologicalEconomics, v. 44, n. 2-3, p.165-185, 2003.
FIERGS – Federação das Indústrias do Estado do Rio Grande do Sul. Retrieved from http://www.iergs. org.br Accessed on 6th March 2013.
FECOMERCIO-RS – Federação do Comércio de Bens e de Serviços do Estado do Rio Grande do Sul. Retrieved from http://fecomercio-rs.org.br Accessed on 5th March 2013.
GARENGO, P.; BIAZZO, S.; BITITCI, U. S. Performance measurement systems in SMEs: a review for a research agenda. International Journal of Management Reviews, v. 7, n. 1, p. 25-47. 2005.
GHOUL, S. E.; GUEDHAMI, O.; KWOK, C. C. Y.; MISHRA, D. R. Does corporate social responsibility afect the cost of capital? Journal of Banking & Finance, v. 35, n. 9, p. 2388-2406, 2011.
GONZÁLEZ-BENITO, J. G.; GONZÁLEZ-BENITO, O. G. A review of determinant factors of environ
-mental proactivity. Business Strategy and the Environment, v.15, p. 87-102, 2006.
GOLINI, R.; LONGONI A.; CAGLIANO, R. Developing sustainability in global manufacturing ne
-tworks: the role of site competence on sustainability performance. International Journal Production Economics, v. 147(Part B), p. 448-459, 2014.
GRI – Global Reporting Initiative. Index 2013. Retrieved from https://www.globalreporting.org/resour
-celibrary/Portuguese-G3-Reporting-Guidelines.pdf Accessed on 4th May 2013.
GUIMARÃES, J. C. F.; SEVERO, E. A.; DORION, E. C. H.; OLEA, P. M. Attributes for sustainable competitive advantage of irms in the global market. Australian Journal of Basic and Applied Scien-ces, v. 9, n. 7, p. 459-468, 2015.
HOGAN, S. J.; COOTE, L. V. Organizational culture, innovation, and performance: a test of Scheins model. Journal of Business Research, v. 67, p. 1609-1621, 2014.
HAIR JR., J. F.; BLACK, W. C.; BARDIN, B. J.; ANDERSON, R. E. Multivariate data analysis. 7 ed. New Jersey: Prentice Hall, 2007.
INSTITUTO ETHOS. Indicadores Ethos 2ª Geração, 2013. Retrieved from http://www3.ethos.org.br/ wp-content/uploads/2013/07/IndicadoresEthos_2013_PORT.pd Accessed on 6th June 2013.
BBR
14,3
366
KIM, K. H.; JEON, B. J.; JUNG, H. S.; LU, W.; JONES, J. Efective employment brand equity through sustainable competitive advantage, marketing strategy, and corporate image. Journal of Business Research, v. 65, p. 1612-1617, 2012.
KOLK, A. Trends in sustainability reporting by the Fortune Global 250. Business Strategy and the Envi-ronment, v. 12, n. 5, p. 279-291, 2003.
KUASIRIKUN, N.; SHERER, M. Corporate social accounting disclosure in Thailand. Accounting, Au-diting & Accountability Journal, v. 17, n. 4, p. 629-660, 2004.
LIN, Y.; WU, L.Y. Exploring the role of dynamic capabilities in irm performance under the resource-based view framework. Journal of Business Research, v. 67, p. 407-413, 2014.
LO, S.; SHEU, H. Is corporate sustainability a value-increasing strategy for business? Corporate Gov-ernance, v. 15, n. 2, p. 345-358, 2007.
MAKADOK, R. Toward a synthesis of the resource-based and dynamic-capability views of rent crea
-tion. Strategic Management Journal,v. 22, p. 387-401, 2001.
MARDIA, K. V. The efect of non-normality on some multivariate tests and robustness to non-normality in the linear model. Biometrika, v. 58, n. 1, p.105-121, 1971.
MARÔCO, J. Análise de Equa̧ões Estruturais: fundamentos teóricos, softwares &aplicações. Lisboa:
PSE, 2010.
MERCHANT, K. A. Measuring general managers performances: market, accounting and combination-of-measures systems. Accounting, Auditing & Accountability Journal, v. 19, n. 6, p. 893-917, 2006. MONEVA, J. M.; LIRIO, J. M. R.; TORRES, M. J. M. The corporate stakeholder commitment and social
and inancial performance. Industrial Management & Data Systems, v. 107, n. 1, p. 84-102, 2007. NEELY, A.; GREGORY, M.; PLATTS, K. Performance measurement system design: a literature review
and research agenda. International Journal of Operations & Production Management, v. 25, n. 12, p.1228-1263, 2005.
NIEMEIJER, D. Developing indicators for environmental policy: data-driven and theory-driven ap
-proaches examined by example. Environmental Science and Policy, v. 5, n. 2, p. 91-103, 2004. PALADINO, A. Investigating the drivers of innovation and new product success: a comparison of stra
-tegic orientations. Journal of Product Innovation Management, v. 24, p. 534-553, 2007.
PETERAF, M. A. The cornerstones of competitive advantage: a resource based view. Strategic Manage-ment Journal, v. 14, n. 3, 179-191, 1993.
PORTER, M. E. Competitive strategy: techniques for analyzing industries and competitors. New York: Free Press, 1980.
PORTER, M. E. Towards a dynamic theory of strategy. Strategic Management Journal,v. 12, p. 95-117, 1991.
PORTER, M. E.; KRAMER, M. R. Philanthropys new agenda: creating value. Harvard Business Review,
p. 121-130, 1999.
ORLITZKY, M., SCHMIDT, F. L.; RYNES, S. L. Corporate social and inancial performance: a meta
--analysis. Organization Studies, v. 24, n. 3, p. 403-441, 2003.
ROY, M.-J.; BOIRAL, O.; LAGACÉ, D. Environmental commitment and manufacturing excellence: a comparative study within Canadian industry. Business Strategy and the Environment, v. 10, n.5, p. 257-268, 2001.
SEVERO, E. A.; GUIMARÃES, J. C. F.; DORION, E. C. H.; NODARI, C. H. Cleaner production, envi
-ronmental sustainability and organizational performance: an empirical study in the Brazilian metal
--mechanic industry. Journal of Cleaner Production, v. 96, p. 118-125. 2015.
SHAHIN, A.; MAHBOD, M. A. Prioritization of key performance indicators: an integration of analytical hierarchy process and goal setting. International Journal of Productivity and Performance Manage-ment, v. 56, n. 3, p. 226-240, 2007.
SHARMA, S.; HENRIQUES, I. Stakeholder inluences on sustainability practices in the Canadian forest products industry. Strategic Management Journal, v. 26, n. 2, p.159-180, 1995.
SURROCA, J.; TRIBÓ J. A.; WADDOCK, S. Corporate responsibility and inancial performance: the role of intangible resources. Strategic Management Journal, v. 31, n. 5, p. 463-490, 2010.
TANAKA, J. S. Multifaceted conceptions on it in structural equations modeling. In: K. A. Bollen, and J. S. Long (Eds.). Testing structural equation models. Newbury Park: Sage, p. 10-39, 1993.
TEECE, D. J.; PISANO, G.; SHUEN, A. Dynamic capabilities and strategic management. Strategic Ma-nagement Journal, v. 18, n. 7, 509-533, 1997.
BBR
14,3
367
TRIGUERO, A.; CÓRCOLES, D.; CUERVA, M. C. Diferences in innovation between food and manu
-facturing irms: An analysis of persistence. Agribusiness, v. 29, n. 3, p. 273-292, 2013.
TUKKER A. Eight types of product–service system: eight ways to sustainability? experiences from sus
-pronet. Business Strategy and the Environment, v. 13, n. 4, p. 246-260, 2004.