ISSN online: 1807-1775
DOI: 10.4301/S1807-17752014000200002
_____________________________________________________________________________________________
Manuscript first received/Recebido em: 01/01/2014 Manuscript accepted/Aprovado em: 24/06/2014 Address for correspondence / Endereço para correspondência
Layla Hasan, Department of Computer Information Systems, Zarqa University, Jordan E-mail: [email protected]
THE
USEFULNESS
OF
USER TESTING
METHODS
IN
IDENTIFYING PROBLEMS ON UNIVERSITY WEBSITES
Layla Hasan
Department of Computer Information Systems, Zarqa University, Jordan
_____________________________________________________________________
ABSTRACT
This paper aims to investigate the usefulness of three user testing methods (observation, and using both quantitative and qualitative data from a post-test questionnaire) in terms of their ability or inability to find specific usability problems on university websites. The results showed that observation was the best method, compared to the other two, in identifying large numbers of major and minor usability problems on university websites. The results also showed that employing qualitative data from a post-test questionnaire was a useful complementary method since this identified additional usability problems that were not identified by the observation method. However, the results showed that the quantitative data from the post-test questionnaire were inaccurate and ineffective in terms of identifying usability problems on such websites.
Keywords: Usefulness, user testing, methods, university websites, usability, comparison
1. INTRODUCTION
goals of a system/product. However, the International Standards (ISO 9241-11, 1998)
provide a broader definition of usability, stating that: “Usability is the extent to which a
product can be used by specified users to achieve specified goals with effectiveness, efficiency and satisfaction in a specified context of use” (ISO 9241-11, 1998).
Usability Evaluation Methods (UEMs) are a set of methods used to evaluate human interaction with a product; they are aimed at identifying issues or areas of improvement in this interaction in order to increase usability (Gray and Salzman, 1998). A variety of usability evaluation methods have been developed to identify usability problems. These methods have been categorized differently by different authors. For example, Hasan et al. (2012) categorized usability evaluation methods into three categories in terms of how usability problems were identified: user-based UEMs (which involve real users in the process of identifying usability problems), evaluator-based UEMs (which involve evaluators in the process of identifying usability problems), and tool-based UEMs (which involve the use of software tools and models in the process of identifying usability problems).
The user testing methods (user-based UEMs) aim to record users’ performance while interacting with an interface and/or users’ preferences or satisfaction with the interface being tested. The most common user-based UEM relates to user testing. The other methods are either variations of a user testing approach or supplementary techniques that could be used with a user testing method. Section two summarizes the most common user-based UEMs.
Earlier research has employed different user testing methods in the evaluation of the usability of university websites, such as observations and/or questionnaires (Tüzün
et al., 2013; Chaparro, 2008; Alexander, 2005; Kasli and Aucikurt, 2008; Christoun et al., 2006; Lencastre and Chaves, 2008; Mustafa and Al-Zoua'bi, 2008; Hasan, 2014). The results of these studies were useful in providing an idea regarding common usability problems that were identified on university websites. However, there is a lack of research that compares issues identified by different user testing methods in the evaluation of the usability of university websites in terms of the types of usability problem that can be identified by them.
The aim of this research is to investigate the usefulness of three supplementary user testing methods (employing observation, quantitative data from the post-test questionnaire, and qualitative data from the post-test questionnaire) regarding their ability or inability to identify specific usability problems on university websites.
The specific objectives of this research are:
1. To employ three supplementary user testing methods (observation, quantitative data from post-test questionnaire, and qualitative data from post-test questionnaire) to evaluate the usability of three selected university websites;
2. To illustrate the types of specific usability problem identified by each method; 3. To compare the specific usability problems identified by each method with the
other methods; and
This paper is organized as follows. Section two summarizes user-based usability evaluation methods while section three reviews earlier research that has used user testing methods in the evaluation of the usability of university websites. Section four describes the methods used. Section five outlines the main results and section six discusses the results in the light of the literature. Finally, section seven reviews and presents some conclusions.
2. USER-BASED USABILITY EVALUATION METHODS (UEMs)
This section reviews the most common user testing methods that can be used to evaluate the usability of websites. The effectiveness of the various user evaluation methods is also presented.
a) User Testing
The user testing method is “a systematic way of observing actual users trying out a product and collecting information about the specific ways in which the product is
easy or difficult for them” (Dumas and Redish, 1999). It is the most important and
useful approach since it provides direct information regarding how real users use the interface and it illustrates exactly what problems the users encounter in their interaction (Nielsen and Mack, 1994).
Different supplementary techniques have been suggested for use during a user testing session, such as making different types of observation (e.g., notes, audio, video or interaction log files) to capture users’ performance; questionnaires and interviews
have also been suggested as ways of collecting data concerning users’ satisfaction
(Nielsen, 1993; Rogers et al., 2011; Dumas and Redish, 1999; Rubin, 2008). Capturing user performance can be automated using tools such as Camtasia and/or Morae. Camtasia is a screen capture software package, provided by the TechSmith Company, which has proved to be an effective tool for capturing website usability data (Goodwin, 2005). Morae software, also provided by the TechSmith Company, is used to gain a
deep understanding of customers’ experience through its ability to record user
interactions with an application, site, or product (TechSmith, 2014). Morae records
desktop activity on the user’s computer and makes a camera video of the user. Using
TechSmith Corporation’s patented Rich Recording Technology, the Morae recorder
captures all system events, including the screen, mouse clicks, web page changes, onscreen text, any notes or markers logged by observers and more. Also, Morae can
capture the participant’s face with a Web cam via a Picture-in-Picture mode. b) Think-Aloud Method
c) Constructive Interaction(also known as Co-Discovery Learning)
This method is a think-aloud method with one condition: the condition of having two users (instead of a single user) interacting with an interface together or working together to complete specific tasks (Holzinger, 2005; Nielsen, 1993). The main advantage of employing this technique is that the test situation is much more natural in comparison with the Think-Aloud tests because people are used to verbalizing their thoughts when trying to solve a problem together (Holzinger, 2005; Nielsen, 1993). However, the unnatural settings which are associated with the Think-Aloud method constitute one of the drawbacks of the constructive interaction method.
d) Questionnaires and Interviews
Different types of questionnaire (e.g., closed or open) and interviews (e.g.,
unstructured, semi-structured or structured) are considered useful and simple
techniques that collect data regarding users’ satisfaction with, or preferences for, a user
interface, such as the features and the presentation of websites (Bidgoli, 2004;Rogers
et al., 2011; Rubin, 2008). These could be used as supplementary techniques to the user testing method or they could be used alone. However, if these techniques are used alone then they are considered as indirect usability methods because they do not study the
user interface directly; instead, they reflect users’ opinions about that interface
(Holzinger, 2005; Nielsen, 1993). Various satisfaction/usability questionnaires have been found in the literature that can be used as post-test questionnaires for assessing the usability of and/or satisfaction with websites. Examples of common satisfaction/usability questionnaires are:
System Usability Scale (SUS): This is a common, reliable, simple, low-cost usability scale that can be used for global/general assessments of subjective assessments of a system’s usability (Brooke, 1996; Sauro, 2011). SUS was developed by the Digital Equipment Corporation and consists of 10 questions that are scored on a 5-point Likert scale on strength of agreement (Tullis and Stetson, 2004). SUS yields a single number representing a composite measure of the overall usability of the system being studied. SUS scores have a range of 0 to 100 (Brooke, 1996). Its ease of administration and scoring makes it a popular choice among usability professionals (Finstad, 2006).
They dropped three questions (e.g., “Remembering names and use of
commands”).
Computer System Usability Questionnaire (CSUQ): This is a short and reliable questionnaire that was developed by IBM (Lewis, 1995). CSUQ is composed of 19 questions. Each question is a statement with a rating on a seven-point scale of “Strongly Disagree” to “Strongly Agree” (Tullis and Stetson, 2004). CSUQ measures three factors: system usefulness, informational quality, and interface quality.
Software Usability Measurement Inventory (SUMI): This was developed by the Human Factors Research Group (Kirakowski and Corbett, 1993). SUMI
measures users’ attitudes to specific software systems (Kirakowski, 1995). It
consists of 50 attitude statements, to each of which the user may respond “agree, don’t know, or disagree” and provides an overarching usability rating across
five subscales (Veenendall, 1998). The five subscales are: efficiency, effect, helpfulness, control and learnability.
End-User Computing Satisfaction Questionnaire (EUCS): This was developed by Doll and Torzadeh in 1988. EUCS is a short, reliable, valid and easy to administer questionnaire that can be used as a general measure of user satisfaction with all types of applications (Doll and Torkzade, 1988). EUCS has 12 items that measure five components of end-user satisfaction: content, accuracy, format, ease of use, and timeliness. The questionnaire uses a five-point Likert scale.
Website Analysis and MeasureMent Inventory (WAMMI): This is a web analytics service that measures and analyses user satisfaction with a website (Alva et al., 2003). It is the best tool to assess user experience as it relates to the actual experience visitors have of a website (WAMMI, 2014). WAMMI was created by Nigel Claridge and Jurek Kirakowski; it consists of 20 statements, which were selected from a large range of questions about users' experiences with websites. It is based on five factors: attractiveness, controllability, efficiency, helpfulness and learnability.
e) Eye Tracking
This is a method which aims to record and observe exactly the paths on a computer screen users follow while using the web (Nielsen and Pernice, 2010). In order to employ this method, special eye tracking equipment is needed to be built into the
computer monitor. Also, eye tracking software is required to track the user’s screen.
3. LITERATURE REVIEW
This section summarizes earlier research that evaluated the usability of university websites using different types of user-based usability evaluation methods. For example, some studies employed more than one user testing methods, including observation, in the evaluation of the usability of such websites. Examples of such include the study conducted by Tüzün et al. (2013) who employed five user testing approaches related to observation, questionnaires, interviews, think-aloud, and eye tracking to evaluate the usability of the registration unit sub-site at Hacettepe University. The results showed that the students experienced several usability problems related to the design of the tested sub-site, including: inappropriate design of pages (e.g. long pages), inappropriate design of the menus, poor organization of the sub-site's data, and inappropriate font size (small).
Chaparro (2008) also employed three user testing methods (observation, questionnaires and interviews) to evaluate the usability of a university portal website. The results showed that the website had several usability problems including: having non-obvious links, inappropriate organization of information on the site, inappropriate use of images (icons), and inappropriate page design (having three different search functions on the same page).
Similarly, Alexander (2005) employed three user testing methods (observation, think-aloud and questionnaire) in an evaluation of the usability of 15 university websites. The results highlighted six usability problems that were found on the websites including: poor information architecture, poor content (e.g., insufficient detail), ineffective internal search function, difficulty using PDF documents, poor page design, and broken links.
Other studies were found in the literature that employed only the questionnaire method in the evaluation of university websites. Kasli and Aucikurt (2008), for example, employed only the questionnaire method and asked 54 students to investigate 132 websites of tourism departments at universities in Turkey. The results shed light on the following usability problems: old information, lack of an internal search function, lack of support for foreign languages, and failure to display important information (e.g.,
an academic calendar, FAQs and programs).
Christoun et al. (2006) also investigated students’ overall satisfaction with an
academic website with regard to its technology, usability, aesthetics and content using an online questionnaire. The results showed that the website had usability problems related to: ineffective search function and difficulty in finding information.
Similarly, Lencastre and Chaves (2008) employed only the questionnaire method aimed at students in the evaluation of the usability of an educational website
used by Master’s degree students at Minho University, Portugal. The results showed
Also, the study conducted by Mustafa and Al-Zoua'bi (2008) employed a questionnaire to evaluate the usability of nine Jordanian university websites by 252 students. The results showed that the usability of the tested websites was, in general, good. However, the study of Mustafa and Al-Zoua'bi (2008) provided no details regarding specific types of usability problem that users identified on university sites.
Furthermore, Hasan (2014) asked 237 students to provide ratings for nine Jordanian university websites using usability criteria. The students were also asked to report qualitatively what they liked and disliked regarding the design of the websites. The results showed that the most common weaknesses on the websites included: the design of the sites, the fact that most of the sites were inconsistent in terms of colors and fonts, the Arabic and English language interfaces, the design of the pages, and the lack of support for the Arabic language.
The studies outlined in this section showed that earlier research employed different types of user-based usability evaluation methods in the evaluation of the usability of university websites and proved the usefulness of these methods in highlighting common usability problems that could be found on such websites from the students´ point of view of. The results from those studies outlined above, which employed more than one method in the usability evaluation, stressed the fact that employing more than one user testing method is useful since the methods complement each other and provide a clear picture of usability problems on the tested websites. Unfortunately, these studies did not provide detailed information regarding to what extent the different methods complemented each other in the identification of the usability problems. No examples were offered by these studies regarding common usability problems that were identified by the methods, and/or unique issues that were raised by each of the employed methods. This research aims to address this gap noted in the literature by illustrating the extent to which three supplementary user testing methods (observation, and using both quantitative and qualitative data from the satisfaction questionnaire) complement each other in the evaluation of the usability of university websites. This research provides empirical evidence regarding the specific usability problems that were identified by each of the three methods.
4. METHODOLOGY
In order to employ and compare usability methodologies with regard to university websites, three university websites in Jordan were selected. The selection was based on the results of one of the major international university ranking websites, which is Eduroute (Eduroute, 2011). The three universities, which had the highest rankings provided by Eduroute for the year 2011, were selected as the sample for this research. The universities were: Hashemite University, the University of Jordan, and Yarmouk University. These universities are large public universities offering a variety of disciplines.
questionnaire, which was designed to collect quantitative data to assess users’
satisfaction with the tested sites. The third method related to the open-ended post-test
questionnaire, which was designed to collect qualitative data to assess users’
satisfaction with the tested sites.
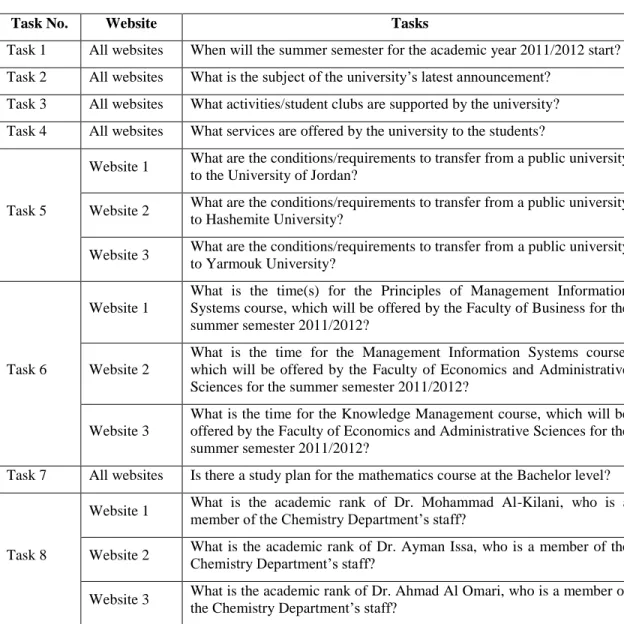
A pre-test questionnaire was developed to gather users’ background information. A task scenario was developed for each of the three websites, as shown in Table 1. This included typical tasks for the three university websites that represented their actual use. The typical tasks were derived from an earlier study, which listed types of pages visited frequently by Jordanian students on a university website (Hasan, 2013). For clarity and simplicity throughout this paper, the titles website 1, website 2 and
website 3 are used to refer to the University of Jordan’s website, the Hashemite
University’s website, and Yarmouk University’s website, respectively.
Table 1: Task scenarios for the three websites
Task No. Website Tasks
Task 1 All websites When will the summer semester for the academic year 2011/2012 start? Task 2 All websites What is the subject of the university’s latest announcement?
Task 3 All websites What activities/student clubs are supported by the university? Task 4 All websites What services are offered by the university to the students?
Task 5
Website 1 What are the conditions/requirements to transfer from a public university to the University of Jordan?
Website 2 What are the conditions/requirements to transfer from a public university to Hashemite University?
Website 3 What are the conditions/requirements to transfer from a public university to Yarmouk University?
Task 6
Website 1
What is the time(s) for the Principles of Management Information Systems course, which will be offered by the Faculty of Business for the summer semester 2011/2012?
Website 2
What is the time for the Management Information Systems course, which will be offered by the Faculty of Economics and Administrative Sciences for the summer semester 2011/2012?
Website 3
What is the time for the Knowledge Management course, which will be offered by the Faculty of Economics and Administrative Sciences for the summer semester 2011/2012?
Task 7 All websites Is there a study plan for the mathematics course at the Bachelor level?
Task 8
Website 1 What is the academic rank of Dr. Mohammad Al-Kilani, who is a member of the Chemistry Department’s staff?
Website 2 What is the academic rank of Dr. Ayman Issa, who is a member of the Chemistry Department’s staff?
In order to gather quantitative and qualitative data from the students regarding their preferences with the tested websites, three specific post-test questionnaires were developed for the purpose of this research, despite the fact that there are many validated satisfaction/usability scales that are available (for examples the ones mentioned in section 2). This is related to the fact that all of the usability questionnaires reviewed in section 2 were developed to measure the overall usability of a system or to measure general usability issues. Thus, they are not comprehensive enough to determine specific usability issues with educational websites. None of them were developed specifically to evaluate the usability of educational websites. Furthermore, the literature review presented above shows that those questionnaires were not used to evaluate the usability of educational websites. Therefore, none in their current state could adequately assess the usability problems specific to an educational website.
Each user responded to the appropriate post-test questionnaire after interacting with each website. The post-test questionnaires were divided into two sections. The first was designed to collect quantitative data using closed-ended questions (Appendix 1), while the second section was designed to collect qualitative data using open-ended questions. The first section was based on specific criteria for evaluating the usability of educational websites that was proposed in an earlier study (Hasan, 2014). This part of the questionnaire included 25 questions which were scored on a 7-point Likert scale on strength of agreement. The questionnaire was organized into five sections: navigation, architecture/organization, ease of use and communication, design, and content. The navigation section consisted of six questions which assessed whether the site included the main tools (e.g. navigation menu, internal search facility) and links which facilitated the navigation of users through the site, enabling them to reach the required information quickly. The architecture/organization section consisted of two questions. These related to the structure of a site's information which should be divided into logical, clear groups; each group should include related information. The ease of use and communication section consisted of four questions, which related to the cognitive effort required to use a website, and to the existence of basic information which facilitated communications with the university in different ways. The design section consisted of six questions that related to the visual attractiveness of the site's design; the appropriateness of the design of the site's pages; and the appropriateness of the use of images, fonts and colors in the design of the site. Finally, the content section consisted of seven questions which assessed whether the information on the site was up-to-date, sufficient, relevant to user needs, and accurate; and whether a site included the information students required (e.g. information about the university, information about the colleges, and information about the departments).
The second part of the questionnaires included two open-ended questions. The first asked the students to list five features on each site they most preferred, while the second question asked the students to list five features they disliked on each site.
procedure. Data were gathered using screen capture software (Camtasia) with four questionnaires and observations of the users working through the tasks. The user session began with the researcher welcoming the user and asking him/her to fill out a pre-test questionnaire in order to obtain information regarding his/her background and experience. Before beginning the tasks related to each website, the user was asked to explore the website for a maximum of 10 minutes. After the exploration, the user was given the tasks for a particular website from the three tested sites. As the user worked on each task, the observer noted the sequence of pages, the time taken to complete each task, and any comments made by the user. After completing the tasks for the tested website, the user was given the post-test questionnaire to fill out in order to get his/her feedback. Then the user took a break before beginning to test the second website. A similar procedure was followed by the user while testing the second and third sites. At the end, the user was thanked. For each session, the order of the three websites that were evaluated was changed so that each website was tested fairly by all the users since, while testing the first website, the user might be slow and unfamiliar with the testing tasks. The user testing methods were deployed between May 2012 and June 2012. No website changes were made by the universities’ web designers during this timeframe.
Descriptive analysis was used to analyze data collected from the pre-test questionnaires. The performance data were summarized in two ways: the tasks’ timings (in seconds) and the tasks’ accuracy. Descriptive statistics were used to obtain the mean time (in seconds) and the standard deviation for each of the eight tasks (Appendix 2). Furthermore, the one-way within subject ANOVA test was employed for each of the eight tasks. The results of this test are presented in Appendix 3. The task accuracy represented the percentage of users who completed each task successfully within the time benchmark. In order to identify the usability problems from the performance data, two steps were used, as suggested by Rubin (2008):
a) Identifying the problematic tasks: all the problematic tasks were considered.
b) Identifying students’ problems and conducting a source of error analysis. In order to
identify users’ problems/obstacles/difficulties with the problematic tasks, and to investigate the usability problems behind these, different sources were examined. These included the in-session observation notes, notes taken from reviewing the
ninety Camtasia sessions, and users’ comments noted during the test.
Data collected from the post-test questionnaires were used to find evidence of usability problems with the sites. Likert scores were calculated for each statement in section 1 of the post-test questionnaire for each site in order to obtain the results concerning the participants’ satisfaction with the sites. A Likert score of 1-3 was regarded as a negative response, 5-7 a positive response, and 4 a neutral one.
Qualitative data obtained from students’ responses to the open-ended questions in the post-test questionnaires were taken into account in determining the usability
problems. Users’ answers were translated into English from Arabic and were then
5. RESULTS
This section presents the findings obtained from the analysis of the different user testing methods. The first subsection presents an overview of the users in terms of their characteristics while the second subsection presents the findings from the performance data and observations. The third and fourth subsections present the quantitative and qualitative results obtained from the analysis of the post-test (satisfaction) questionnaires, respectively.
5.1Participants’ Characteristics
The participant students comprised 16 males and 14 females. They were in general experienced computer and web users; 97% had more than three years of computer experience and 63% had used the Internet for more than three years. The students were also frequent users of the website of their university; 97% of them had
used their university’s website.
5.2Performance Data and Observation
The summary of the performance data is presented in Appendix 2 and Table 2. Appendix 2 presents the mean time in seconds and the standard deviation for each task. Table 2 presents the levels of accuracy for each task across the three websites. It shows that all the tasks were problematic; no task was performed successfully by all the students on any of the three websites. This indicates that it was difficult for the students to perform the typical tasks on the three websites. However, Table 2 shows that the
tasks’ accuracy varied for each website. A one-way within-subjects ANOVA test showed that the time spent performing the majority (six) of the eight tasks was significantly different for the three sites. Appendix 3 shows the results of the ANOVA test for each task.
Table 2: Task accuracy
Task
Accuracy Score
Website 1 Website 2 Website 3
Task 1 73% 13% 87%
Task 2 93% 67% 93%
Task 3 30% 10% 60%
Task 4 13% 43% 63%
Task 5 83% 73% 83%
Task 6 13% 57% 63%
Task 7 10% 10% 80%
The observation notes, the notes generated from reviewing the 90 Camtasia
files, and users’ comments from the user testing were summarized in terms of tasks. This observation summary presents a snapshot of each task and highlights the critical incidents that occurred during each task across the sites. These incidents represent
potential problems with users’ interactions with the sites. Using the observation summary, a large number of usability problems were identified on each website for each task. Similar problems in each site were grouped together to generate a list of problems for each site. The three lists generated were examined to identify similar problems across the three sites. Consequently, 19 common areas of usability problems were identified, which suggested identifying 19 problem sub-themes. These 19 problem sub-themes suggested identifying six problem themes based on the type of problems identified. The six problem themes related to: navigation, design, content, internal search, ease of use and support for the Arabic language, and missing capabilities.
The 19 usability problems were then classified into two types based on their seriousness. The first type was major problems and related to mistakes/errors that a student made and was unable to recover from in order to complete the task on time. The user might or might not have realized his/her mistake/error. The second type related to
minor problems, which included mistakes/errors that a student made but was able to recover from and complete the task, or other difficultiesthat were observed or indicated
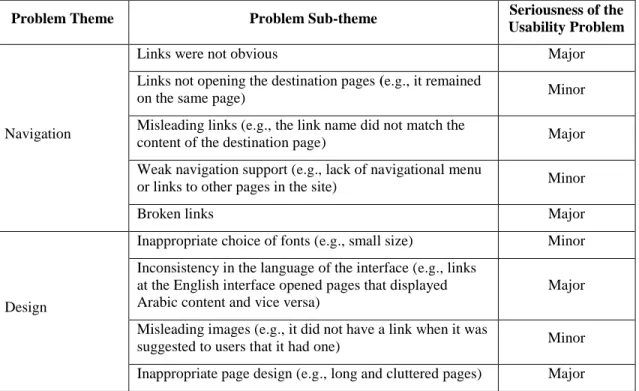
by users’ comments while performing the tasks. Consequently, 12 major usability problems and seven minor usability problems were identified on the websites. Table 3 shows the 19 problem sub-themes, their themes, and the seriousness of each problem.
Table 3: Usability problem themes and sub-themes that students identified by observation, together with their seriousness.
Problem Theme Problem Sub-theme Seriousness of the Usability Problem
Navigation
Links were not obvious Major
Links not opening the destination pages (e.g., it remained
on the same page) Minor
Misleading links (e.g., the link name did not match the
content of the destination page) Major Weak navigation support (e.g., lack of navigational menu
or links to other pages in the site) Minor
Broken links Major
Design
Inappropriate choice of fonts (e.g., small size) Minor Inconsistency in the language of the interface (e.g., links
at the English interface opened pages that displayed Arabic content and vice versa)
Major
Misleading images (e.g., it did not have a link when it was
Ineffective text format (e.g., the information was not
aligned correctly on the site’s pages) Minor
Broken images Minor
Content
No information regarding the type of a file that a link
would open Major
Irrelevant content (e.g., the content of a page was not clear
to users) Major
Old content Major
Empty pages Major
Internal Search Ineffective internal search (e.g., it did not work properly) Major Ease of Use and
Support for the Arabic Language
Difficult interaction with a website Major
Not supporting the Arabic language Major Missing
Capabilities
Missing functions/ information (e.g., no internal search
facility) Minor
The following presents an explanation and examples regarding the major and minor usability problems that were identified on the websites. The 12 major usability problems related to:
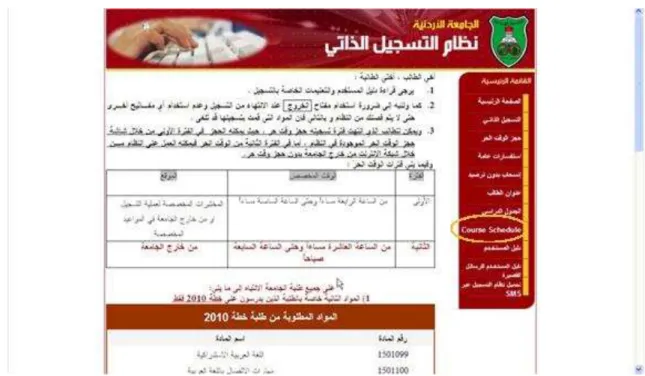
1. Links were not obvious: this problem was identified on website 1 and related to links that were not situated in an obvious location on a page so they could be recognized by students. For example, the link required to change the language of the Home page from English (default) into Arabic was located at the very top right-hand corner of the Home page, as shown in Figure 1. It was observed that this link was not obvious for 20 (out of the 30) students. The observer helped the 20 students to find this link so that they were able to continue the other tasks. It was difficult to interact with the site for most of the students in the English language interface. 2. Misleading links: this related to the fact that the destination page, which was opened
by a link, was not expected by students because the link name did not match the content of the destination page. This problem was found on websites 1 and 3. An example of such a link is the Home Page link which was located in the top menu of the Registration unit sub-site in the two websites. The students expected this link to open the Home Page of the university. However, it opened the Home Page of the sub-site (Registration unit sub-site).
3. Broken links: some broken links were identified on websites 1 and 2, which prevented the students from performing the required tasks successfully. An example of these links was the Study Plans link, which was located at the new student sub-site in websub-site 2.
5. Inappropriate page design: this problem related to pages on the tested websites that did not clearly represent their content; it was found on all three websites. For example, the Self-Registration page in the Registration unit sub-site for website 1, which included the Course Schedule link, was very long and cluttered, as shown in Figure 2. It was observed that most of the students (26 out of 30) (Table 2) could not find the Course Schedule link on this page and therefore could not complete the required task successfully (Task 6).
Figure 1: The Home page of website 1
6. No information regarding the type of file that a link will open: this problem was found on websites 1 and 2, and related to the fact that there was no information regarding the type of file (e.g., PDF) that a link would open. For example, the
Calendar link in the advertisements sub-site on website 2 opened the academic calendar of the university in PDF format. It was observed that the PDF file took a long time to open, which made most of the students think that there was a problem with the link. Most of the students stated qualitatively that there was no file to be opened and therefore, they did not complete the related task successfully (Task 1). 7. Irrelevant content: this problem related to the fact that some pages on the tested
websites displayed an unclear message. This problem was found on all three of the tested websites (e.g., the Course Schedule page on website 3).
This problem was the main reason behind the failure to complete Task 1 successfully on website 2 by most of the students (26 out of 30) (Table 2).
Figure 2: The upper part of the Self-Registration page in the Registration unit sub-site for website 1
9. Empty pages: this problem related to the existence of some pages on website 2 that had empty content. Examples on these pages are: the Services page on the Registration site, and the Clubs and Activities page on the Student Affairs sub-site.
10.Ineffective internal search: this problem related to the fact that the internal search function on all three websites did not work properly.
11.Difficult interaction with a website: this problem related to the fact that it was not easy to visit some pages on the three websites. For example, it was observed that it was difficult for the students to visit the Registration unit sub-site from the Home page of the three websites (Table 2).
The seven minor usability problems that were identified by the observation method related to:
1. Links not opening the destination page: this problem related to a link that did not work properly as expected by the students; it remained on the same page. For example, the Student Gate link, which was located on the Home page of website 1, had this problem.
2. Weak navigation support: this problem related to a page that did not have a navigational menu or links to other pages on the site. This problem was found on the Self Registration page at the Registration unit sub-site on website 1.
3. Inappropriate choice of fonts: this problem related to the use of an inappropriate font size (small size) at websites 1 and 3. For example, the observation showed that the font used for the Arabic link on the Home page of website 1, which was used to change the language of the interface from English into Arabic, was small from the viewpoint of the students (Figure 1).
4. Misleading images: this problem related to the existence of some images on website 1 which did not function as the students expected. For example, such images did not have a link while users expected them to have one (e.g., the logo of the University at the header of the Graduate Studies sub-site).
5. Ineffective text format: this problem related to the existence of some pages on website 2 in which the information, figures and tables were not aligned correctly. Examples included these pages: the Financial Department unit sub-site and the Forms page on the Registration sub-site.
6. Broken images: this problem related to the existence of some images at the Clubs at the Student Affairs sub-site on website 2 which were broken.
7. Missing functions/information: this problem related to the fact that website 2 did not have some functions or capabilities. For example, it did not have an internal search facility at the Registration unit sub-site.
5.3The Quantitative Data from the Post-Test Questionnaires
The analysis of the quantitative data from the post-test questionnaires showed that websites 1 and 2 had usability problems (Appendix 1). The results showed, however, that the students were satisfied with website 3; the Likert scores for all the statements of the post-test questionnaire for this site were more than 5. It is important to
explain the reason behind the students’ satisfaction with website 3, which was clearly identified by the observation. The reason was the support of website 3 for the Arabic language.
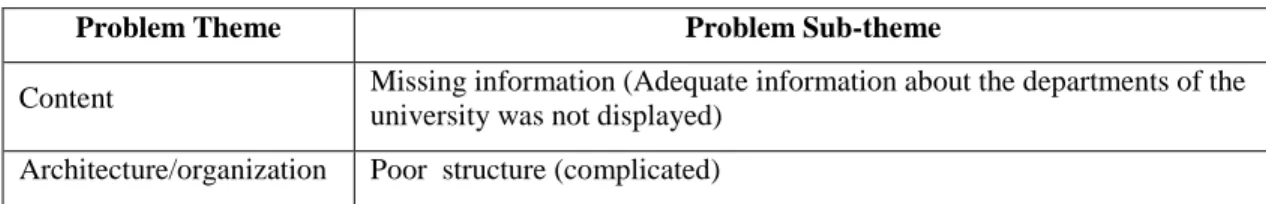
observation method; these related to: misleading links, old content, ineffective internal search, and difficult interaction with a website. However, two statements (Appendix 1, statements 7, 25) identified two new problem sub-themes, relating to poor structure and missing information, respectively. The poor structure problem suggested a new problem theme, which concerns architecture/ organization, while the missing information problem was mapped to the content problem themes. The new problems, as well as their descriptions, are shown in Table 4.
Table 4: New problem themes and sub-themes that were identified by the quantitative data of the post-test questionnaires, together with their descriptions.
Problem Theme Problem Sub-theme
Content Missing information (Adequate information about the departments of the university was not displayed)
Architecture/organization Poor structure (complicated)
However, the results showed that the quantitative data obtained from the analysis of the post-test questionnaires revealed that this method was inaccurate and ineffective in identifying usability problems on university websites. The inaccuracy issue of this method was discovered by making a comparison between the results of this method and the results of the observation. It was found that, despite the fact that this method identified similar types of usability problems (problem sub-themes) that were also identified by the observation method, there were clear differences between the location of three (out of four) of the problems obtained using this method and the location of the usability problems that were identified by the observation method. Specifically:
1. The observation method identified misleading links as major problems on websites 1 and 3. However, the quantitative data of the post-test questionnaires identified this kind of problem on websites 1 and 2.
2. The observation method showed that the three websites had ineffective internal search problems as major problems. However, the post-test data of the questionnaires identified this problem only on websites 1 and 2.
3. The observation method identified difficulty interacting with the three websites as major problems, while the quantitative data of the post-test questionnaires identified this type of problems only on websites 1 and 2.
positive or neutral when most of these types of usability problem were identified by the observation method as major issues (Table 3).
5.4The Qualitative Data from the Post-Test Questionnaires
The analysis of the qualitative data from the post-test questionnaires resulted in the identification of 16 usability problems. These problems were compared and then mapped to the appropriate problem themes and sub-themes identified by the previous two methods (observation, and the quantitative data from the satisfaction questionnaires). It was found that there were no matches between five problems and the identified problem sub-themes. Therefore, five new sub-themes were identified and mapped to four appropriate problem themes (navigation, design, architecture/ organization, and ease of use and support for the Arabic language).
Table 5: New problem themes and sub-themes that were identified by the qualitative data of the post-test questionnaires, together with their descriptions.
Problem Theme Problem Sub-theme
Navigation Orphan pages (pages that did not have any links )
Design
Unaesthetic design (unattractive interface)
Inappropriate choice of colors (e.g. inappropriate combination of background and link colors)
Architecture/Organization Deep architecture (the number of clicks to reach goals was more than 3)
Ease of Use and Support
for the Arabic Language Slow downloading of the site’s pages
The unique identification of the five usability problems by the qualitative data obtained from the post-test questionnaires provided additional evidence regarding the inefficiency of the quantitative data obtained from the analysis of the post-test questionnaires. Despite the fact that there were five specific statements in the post-test questionnaire relating to the five new problems that were uniquely identified by the qualitative method (Appendix 1, statements 6, 8, 9, 13 and 16), the students did not rate these statements negatively and therefore did not identify these problems via the quantitative data.
Regarding the 11 usability problems which were also identified by the other previous methods, it was found that there were similarities between most of them (seven out of the 11) and the usability problems that were identified by the observation method in terms of their locations. Specifically:
The students via this method qualitatively identified usability problems related to inappropriate choices of font on websites 1 and 3; this was also identified by the observation method.
The students identified four other usability problems on the three websites relating to inappropriate page design, irrelevant content, ineffective internal search, and difficult interaction with the websites. These problems were also identified by the observation method as major problems on the three websites (Table 3).
This method identified a lack of support for the Arabic language on websites 1 and 2, which was also identified by the observation method on those websites as a major problem.
However, it was found that there were differences between four (out of 11) of the usability problems that were identified by the qualitative data of the questionnaire method, and the usability problems that were identified, either by the observation or the quantitative data of the post-test questionnaire, in terms of their location. Specifically:
This method identified misleading links on websites 2 and 3, while the observation method identified misleading links on websites 1 and 3. However, the quantitative data of the post-test questionnaire identified the misleading link problem on websites 1 and 2.
The students via this method identified inconsistency in the language on websites of 2 and 3, while the observation method identified this problem on websites 1 and 2.
The students qualitatively identified the problem of empty pages on websites 1 and 2, while the observation method identified this as a major problem only on website 2.
The missing information problem was identified by this method on websites 1 and 2, while it was identified by the quantitative data of the post-test questionnaire only on website 2.
6. DISCUSSION
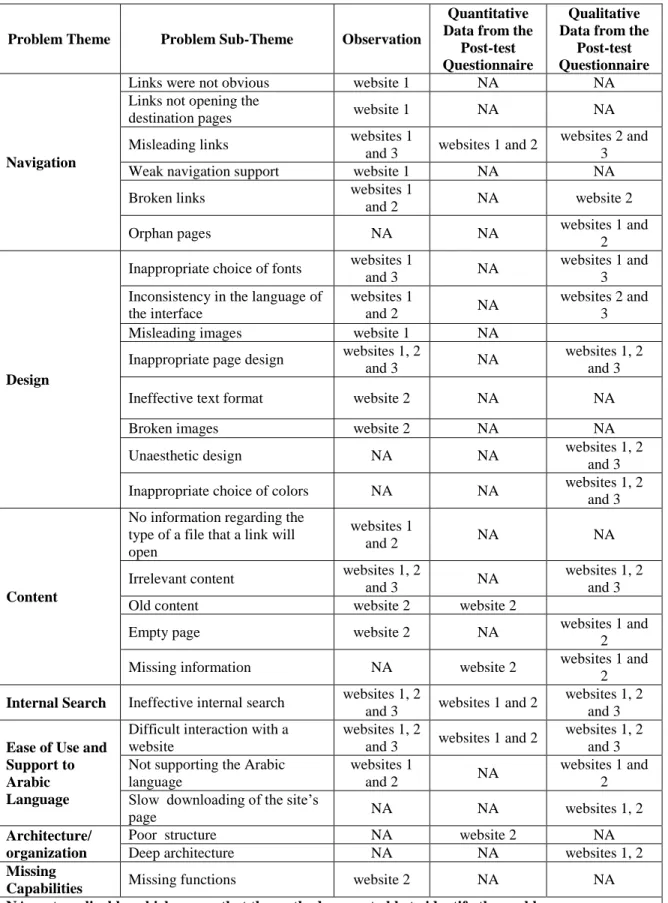
Table 6: Comparison of the output of the three methods.
Problem Theme Problem Sub-Theme Observation
Quantitative Data from the
Post-test Questionnaire
Qualitative Data from the
Post-test Questionnaire
Navigation
Links were not obvious website 1 NA NA Links not opening the
destination pages website 1 NA NA Misleading links websites 1
and 3 websites 1 and 2
websites 2 and 3 Weak navigation support website 1 NA NA Broken links websites 1
and 2 NA website 2
Orphan pages NA NA websites 1 and
2
Design
Inappropriate choice of fonts websites 1
and 3 NA
websites 1 and 3 Inconsistency in the language of
the interface
websites 1
and 2 NA
websites 2 and 3 Misleading images website 1 NA
Inappropriate page design websites 1, 2
and 3 NA
websites 1, 2 and 3 Ineffective text format website 2 NA NA
Broken images website 2 NA NA
Unaesthetic design NA NA websites 1, 2 and 3 Inappropriate choice of colors NA NA websites 1, 2
and 3
Content
No information regarding the type of a file that a link will open
websites 1
and 2 NA NA
Irrelevant content websites 1, 2
and 3 NA
websites 1, 2 and 3 Old content website 2 website 2
Empty page website 2 NA websites 1 and 2 Missing information NA website 2 websites 1 and
2
Internal Search Ineffective internal search websites 1, 2
and 3 websites 1 and 2
websites 1, 2 and 3
Ease of Use and Support to Arabic Language
Difficult interaction with a website
websites 1, 2
and 3 websites 1 and 2
websites 1, 2 and 3 Not supporting the Arabic
language
websites 1
and 2 NA
websites 1 and 2
Slow downloading of the site’s
page NA NA websites 1, 2
Architecture/ organization
Poor structure NA website 2 NA
Deep architecture NA NA websites 1, 2
Missing
It is worth mentioning that Table 6 provides evidence regarding the fact that if just one method is employed to identify usability problems on university websites, it may result in costly developments that may be prove to be misguided. The following illustrates how each set of data provided by each method could be interpreted:
The data obtained from the observation method provided clear indications that all three tested websites had usability problems. Furthermore, as explained earlier, the seriousness of the problems were also determined, which could facilitate giving higher priority to major problems while giving less priority to minor problems during the development of the websites. However, Table 2 shows that this method was unable to identify seven usability problems which were identified by the students using the other methods. These included: slow
downloading of the site’s pages, poor structure, deep architecture, missing information, inappropriate choice of colors, unaesthetic design, and orphan pages.
The data obtained from the quantitative data from the post-test questionnaire provided indications that only websites 1 and 2 had a small number of usability problems. However, the location of these problems was not clear. This would require further efforts to be made by the developer in order to find out which usability problems to fix. Furthermore, the quantitative data obtained from the post-test questionnaire indicated that website 3 had no usability problems when in fact it had major usability problems (e.g. ineffective text format, difficulty interacting with the website), which were identified using the observation methods.
The qualitative data obtained from the post-test questionnaire indicated that the three websites had usability problems and identified usability problems which were not identified by the other methods. However, Table 2 shows that this method was not able to identify specific major usability problems that were identified by the other methods (e.g. links were not obvious, there was no information regarding the type of file that a link would open)
Table 7: Common usability problems on university websites from students’ viewpoints.
Usability Problem Reference(s)
Inappropriate page design Tüzün et al. (2013); Chaparro (2008); Alexander (2005); Hasan (2014)
Inappropriate font size Tüzün et al. (2013)
Non-obvious links Chaparro (2008)
Inappropriate organization of information on a site Chaparro (2008)
Deep architecture Alexander (2005)
Poor content (e.g. lack of clarity, long pages, insufficient details)
Alexander (2005); Kasli and Aucikurt (2008)
Ineffective internal search Alexander (2005); Christoun et al. (2006) Difficulty using PDF format documents Alexander (2005)
Broken links Alexander (2005)
Old information Kasli and Aucikurt (2008) Lack of internal search function Kasli and Aucikurt (2008) Lack of support for the Arabic language Hasan (2014)
Difficulty finding information Christoun et al. (2006) Inconsistency (e.g. colors, fonts, design of the pages) Hasan (2014)
The results of this research, which has made a contribution in terms of highlighting the usefulness of each of three user testing methods regarding their ability to identify usability problems on university websites, stress the usefulness of the observation method in identifying specific usability problems on such websites. This method was the most effective method compared to the other two in terms of the number of usability problems identified and the seriousness of the problems. This method identified 19 specific types of usability problem on university websites; 12 (out of the 19) were major usability problems which related to mistakes/errors that a student made from which he/she was unable to recover and complete the task on time. However, seven (out of the 19) were minor usability problems which included mistakes/errors that a student made but was able to recover from and complete the task, or other difficulties that were observed, or users’ comments while performing the tasks. Section 5.2 summarizes the 19 specific usability problems, which related to six problem areas that were identified by this method. This method, however, could not identify problems related to seven areas: missing information, poor structure, orphan pages, unaesthetic design, inappropriate choice of colors, deep architecture, and slow
downloading of the site’s pages.
the inaccuracy of the questionnaire method. However, Lencastre and Chaves (2008) in their research employed only the questionnaire method in the evaluation of the usability of an educational website, while this research employed three user testing methods, and compared the results obtained from the analysis of the three methods. The results of this research suggest that the quantitative data from the post-test questionnaires was not effective or useful in pointing out specific usability problems on university websites.
The results of this research also showed that the quantitative data obtained from the post-test questionnaire method reflected the students’ overall satisfaction with a site. This result agreed with the indications provided by researchers regarding the
effectiveness of quantitative data in highlighting users’ overall preferences with regard to a site (Holzinger, 2005; Nielsen, 1993). However, this research provided empirical evidence regarding the inability of quantitative data from the post-test questionnaire method to complement the other user testing methods in terms of identifying specific types of usability problem on university websites.
Conversely, the findings of this research suggested the usefulness of using open-ended questions in the post-test questionnaire to identify additional and specific usability problems on university websites, problems which could not be identified using the observation method. Furthermore, this research illustrated the types of specific usability problem that students could identify using this method after their interaction with a university website. Section 5.4 summarizes the five usability problems which were identified by this method; these were related to four main problem areas and were not identified by the observation. This research showed that qualitative data from the post-test questionnaire method have the ability to complement other user testing methods in terms of identifying additional specific usability problem on university websites, which could not be identified by the other methods.
7. CONCLUSIONS
This research has achieved its aim and illustrated the usefulness of three supplementary user testing methods (observation, and using both quantitative and qualitative data from satisfaction questionnaires) regarding their ability or inability to identify specific usability problems on university websites. This research confirms the complementary value of two user testing evaluation methods: observation and qualitative data from the post-test questionnaires; each is capable of identifying usability problems which the other is unlikely to identify. This research also provided empirical evidence regarding the inability of the quantitative data of the post-test questionnaire to complement the other methods and identify specific usability problems on university websites. A final Likert-style questionnaire provided at the end of the evaluation is likely to result in an overall impression of satisfaction with a site, but will not reveal the exact differences between the sites; most certainly it cannot be used alone to make design recommendations
This research has managerial and academic implications. Managerial implications: this research provides empirical evidence for the selected university websites regarding weak design issues on their websites. Also, it is expected to raise awareness among universities regarding how to investigate and improve the usability of their websites by clarifying explicitly the role of specific user testing methods in identifying usability problems. Academic implications: this paper presents an evaluation of the value/contribution of three user testing methods in the evaluation of the usability of university websites, and illustrates what kind of problems each method is capable or not capable of identifying. Also, it provides empirical evidence regarding the usefulness of these methods in the evaluation of the usability of university websites. The results of this research could contribute to the literature regarding the effectiveness of supplementary user testing methods in complementing each other while they are being used to evaluate the usability of websites.
However, this research has certain limitations. The sample used in this research was limited to students of only one university in Jordan. Also, other stakeholders of the selected university websites (e.g. faculty staff, employees, parents) were not taken into consideration while conducting the user testing methods. It is worth mentioning that, despite the fact that this research was conducted in Jordan, where the selected websites displayed Arabic content, it is likely that the results can be useful to other countries because many of the details concerning the specific usability problems may be experienced by users on other university websites in various countries. This was shown in the discussion section which presents an agreement between most of the results of this research and the results of earlier research; it, therefore, highlighted common usability problems that were identified on various university websites from the students´ viewpoint.
Acknowledgment:
REFERENCES
Alexander, D. (2005). How Usable are University Websites? A Report on a Study of the Prospective Student Experience. Technical Report. Monash University.
Alva, M., Martínez, A., Cueva, J.M., Sagástegui, C., and López, B. (2003). Comparison of Methods and Existing Tools for the Measurement of Usability in the Web. In the Proceedings of the 3rd International Conference on Web Engineering (ICWE’03), Spain, Springer, 386-389.
Bidgoli, H. (2004). The Internet Encyclopaedia. John Wiley and Sons.
Brooke, J. (1996). SUS: A Quick and Dirty Usability Scale. In: P.W. Jordan, B. Thomas, B.A. Weerdmeester & I.L. McClelland (Eds.), Usability Evaluation in Industry. London: Taylor and Francis.
Chaparro, B. (2008). Usability Evaluation of a University Portal Website. Usability News, 10(2), 1-7.
Chin, J.P., Diehl, V.A. and Norman, K.L. (1988). Development of an Instrument Measuring User Satisfaction of the Human-Computer Interface. In: Soloway E, Frye D, Sheppard SB, editors. In the Proceedings ofthe SIGCHI Conference on Human Factors in Computing Systems; Washington, DC. New York, ACM Press, 213-221.
Christoun, S., Aubin, H., Hannon, C., and Wolk, R. (2006). Web Site Usability in Higher Education. Information Systems Education Journal, 4(110).
Doll, W.J. and Torkzadeh. G. (1988). The Measurement of End-user Computing Satisfaction. MIS Quarterly, 12(2), 259-274.
Dumas, J. S. and Redish, J. C. (1999). A Practical Guide to Usability Testing, Second Intellect Ltd, Rev Sub Edition.
Finstad, K., (2006). The System Usability Scale and Non-Native English Speakers.
Journal of Usability Studies, 1(4), 185-188.
Goodwin, S. (2005). Using Screen Capture Software for Website Usability and Redesign Buy-in. Library Hi Tech, 23(4), 610-621.
Gray, W. and Salzman, C. (1998). Damaged Merchandise? A Review of Experiments that Compare Usability Evaluation Methods. Human-Computer Interaction, 13, 203-261.
Eduroute. (2011). http://www.eduroute.info. [accessed 14.02.2011].
Harper, B., Slaughter, L., and Norman, K. (1997). Questionnaire Administration via the WWW: A Validation & Reliability Study for a User Satisfaction Questionnaire. In: Lobodzinski S, Tomek I, editors. In the Proceedings ofthe World Conference on the WWW, Internet & Intranet, Toronto, CA. Charlottesville (VA), AACE, 808-818.
Hasan, L. (2014). Evaluating the Usability of Educational Websites Based on Students' Preferences of Design Characteristics. The International Arab Journal of e-Technology (IAJeT), 3(3), 179-193.
Hasan, L. (2013). Heuristic Evaluation of Three Jordanian University Websites.
Informatics in Education, 12(2), 231–251.
Holzinger, A. (2005). Usability Engineering Methods for Software Developers.
Communications of the ACM, 48(1), 92-99.
ISO 9241-11. (1998). International Standard. First Edition, Ergonomic Requirements for Office Work with Visual Display Terminals (VDTs). Part11: Guidance on
Usability. http://www.idemployee.id.tue.nl/g.w.m.
rauterberg/lecturenotes/ISO9241part11.pdf. [accessed 03.04.2010].
Kasli, M. and Avcikurt, C. (2008). An Investigation to Evaluate the Websites of Tourism Departments of Universities in Turkey. Journal of Hospitality, Leisure, Sport and Tourism Education, 7(2), 77-92.
Kirakowski, J. and Corbett, M. (1993). SUMI: The Software Measurement Inventory.
British Journal of Education Technology, (24), 210-212.
Kirakowski, J. (1995). The Software Usability Measurement Inventory: Background and Usage, in Usability Evaluation in Industry, Jordan, P., Thomas, B. and Weerdmeester, B. (eds.), Taylor & Frances, London.
Lazar, J. (2006). Web Usability: A User-Centered Design Approach. Pearson/Education Inc.
Lencastre J. and Chaves J. (2008). A Usability Evaluation of Educational Websites. in the Proceedings of EADTU Conference. France.
Lewis, J.R. (1995). IBM Computer Usability Satisfaction Questionnaires: Psychometric Evaluation and Instructions for Use. International Journal of Human Computer Interaction, 7(1), 57-78.
Mustafa, S. and Al-Zoua'bi, L. (2008). Usability of the Academic Websites of Jordan's Universities. In the Proceedings of the International Arab Conference on Information Technology. Tunisia.
Nielsen, J. (1993). Usability Engineering. London: Academic Press.
Nielsen, J. (2003). Usability 101: Introduction to Usability. Useit.com, http://www.useit.com/alertbox/20030825 .html. [accessed 14.02.2011].
Nielsen, J. and Mack, R. L. (1994). (Eds.). Usability Inspection Methods, John Wiley & Sons. New York.
Nielsen, J. and Pernice, K. (2010). Eyetracking Web Usability. New Riders Press. ISBN 0-321-49836-4.
Rubin, J. (2008). Handbook ofUsability Testing: How to Plan. Design, and Conduct Effective Tests. Wiley Publishing Inc.
Rogers, Y., Sharp, H., and Preece, J. (2011). Interaction Design: Beyond Human-Computer Interaction. Wiley. Third Edition.
Sauro, J., (2011). Measuring Usability with the System Usability Scale (SUS). https://www.measuringusability.com/sus.php#comments. [accessed 24.07.2014].
Stone, D., Jarrett, C., Woodroffe, M., and Minocha S. (2005). User Interface Design and Evaluation. The Open University. Morgan Kaufmann.
TechSmith. (2014). http://www.techsmith.com/morae.html. [accessed 22.07.2014]. Tullis, T. S. and Stetson, J. N. (2004). A Comparison of Questionnaires for Assessing Website Usability, In the Proceedings ofthe Usability Professionals Association (UPA) 2004 Conference, Minneapolis, USA.
Tüzün, H., Akinci, A., Kurtoğlu, M., Atal, D., and Pala, F. (2013). A Study on the
Tasks and Eyetracking. The Turkish Online Journal of Educational Technology (TOJET), 12(2), 26-38.
Van den Haak, M. and de Jong, M. (2005). Analyzing the Interaction between Facilitator and Participants in Two Variants of the Think-Aloud Method. In the Proceedings of IEEE International Professional Communication Conference, 323-327. Veenendall Van E. (1998). Questionnaire based Usability Testing. In: Unknown, editor. EURO & Y2K: The Industrial Impact. In the Proceedings ofthethe European Software Quality Week, Brussels, BE. San Francisco (CA): Software Research, Inc. 1-9.
WAMMI. (2014). http://www.wammi.com. [accessed 22.07.2014].
Appendix 1. Likert scores and standard deviation of the post-test questionnaires.
No. Question Website 1 Website 2 Website 3
Navigation
Likert Score
STD Likert
Score
STD Likert
Score
STD
1 Moving around the website without getting lost was
easy 3.96 1.57 2.66 3.99 5.9 6.16
2 It was easy to go to the home page from any sub page
of the site 4.14 2.73 5.25 4.58 6.42 7.89
3 The site’s internal search function was effective 3.21 4.63 3.23 3.40 5.10 3.93
4 Links are working properly and not misleading so that the user knows what to expect from the destination page
3.93 2.34 3.89 2.45 5.97 5.88
5 The site has no broken links 4.45 3.29 4.32 2.51 6.23 8.66
6 The site has no orphan (dead-end pages) 4.83 3.76 5 3.68 5.83 6.26
Architecture/organization
7 The structure of the site (organization of the site’s
information) was clear 4.21 3.13 3.55 3.02 6.07 5.40
8 The architecture of the site was not too deep (the number of clicks to reach goals was not too large: e.g. it does not require clicking more than 3 links)
4.69 3.48 4.5 3.04 5.87 5.44
Ease of use and communication
9 Quick downloading of the site’s pages 4.31 1.98 4.77 2.51 5.97 6.68
10 Interaction with the website was easy 3.38 2.12 2.73 3.45 6.17 6.02
11 Finding the required information was easy 3.07 3.45 2.59 3.24 5.65 4.58
12 Generally, I was satisfied with the ease of use of the
site 3 3.13 2.53 4.15 5.73 4.96
Design
13 The site was attractive and appealing so that it
impresses the potential student 4.66 2.85 4.3 2.93 5.37 3.95
14 The use of images was appropriate 4.41 3.73 4.86 2.97 5.4 3.35
15 The size of the text made the site easy to read 5.31 4.22 5.42 4.65 6.27 6.52
16 The choice of colors was appropriate 5.41 3.48 5.6 4.89 5.77 4.79
17 The design of the pages was appropriate 4.97 2.15 4.59 3.21 5.48 3.93
18 Page layout or style was consistent throughout the web
site 4.79 2.54 4.59 2.37 5.53 4.61
Content
19 The information presented on the site was up-to-date 5.87 6.60 3.2 4.19 6.6 9.18
20 The information on the site was clear and relevant to
user needs 4.71 3.34 4.2 2.50 6.37 6.80
21 There were no ‘under construction’ pages 5.29 4.47 4.87 3.68 5.48 4.79
22 The information on the site was accurate 4.72 3.13 4.93 2.63 5.83 5.62
23 Adequate and clear information about the university
was displayed 5.41 4.15 4.35 2.51 6.53 8.68
24 Adequate and clear information about the faculties was
displayed 4.90 3.45 4.07 1.80 6.53 7.61
25 Adequate and clear information about the departments
was displayed 4.46 2.99 3.87 1.80 6.42 7.52
Appendix 2: Mean time (in Seconds) for each task across the three
Task Website 1 Website 2 Website 3
Mean Std. Deviation Mean Std. Deviation Mean Std. Deviation Task 1 138.3000 112.6952 159.3333 82.3664 79.8333 73.0716
Task 2 25.2000 22.7390 23.9667 30.6667 21.0333 20.9868
Task 3 130.5667 77.3758 96.5000 64.1640 111.5333 73.9211
Task 4 101.4667 85.0471 54.6000 51.7838 61.2333 65.2918
Task 5 101.5333 83.8104 50.4667 59.7464 69.5333 52.1951
Task 6 172.2000 75.7948 85.3667 56.2320 124.0333 74.8159
Task 7 154.1667 82.3508 123.6333 73.3666 93.4667 107.8475
Task 8 137.0333 66.6170 118.2000 54.9472 75.0000 38.1621
Appendix 3: Result of One-Way within-Subjects ANOVA test for each task among the three sites
Task ANOVA Test (One-Way within-Subjects)
Was there a statistically significant difference among Website1, 2 and 3
Task 1 Yes
F(2,87) = 6.152, p=.003
Task 2 No
F(2, 87) = .217, p=.805
Task 3 No
F(2, 87) = 1.685, p=.191
Task 4 Yes
F(2, 87) = 4.083, p=.020
Task 5 Yes
F(2, 87) = 4.500, p=.014
Task 6 Yes
F(2, 87) = 11.743, p=.000
Task 7 Yes
F(2, 87) = 3.484, p=.035
Task 8 Yes