DOI: 10.4301/S1807-17752017000300003
Manuscript irst received: 2017/Oct/20. Manuscript accepted: 2017/Nov/27 Address for correspondence:
Jeremy Rose, Professor of Informatics, University of Skövde, Skövde, Sweden. E-mail: [email protected]
Mikael Berndtsson, Assistant Professor of Informatics, University of Skövde, Skövde, Sweden. E-mail: [email protected]
Gunnar Mathiason, Assistant Professor in Computer Science, University of Skövde, Skövde, Sweden. E-mail: [email protected]
Peter Larsson, Advectas, Göteborg, Sweden. E-mail: [email protected]
THE ADVANCED ANALYTICS JUMPSTART: DEFINITION, PROCESS MODEL, BEST PRACTICES
Jeremy Rose Mikael Berndtsson Gunnar Mathiason
University of Skövde, Skövde, Sweden
Peter Larsson
Advectas, Göteborg, Sweden
ABSTRACT
Companies are encouraged by the big data trend to experiment with advanced analytics and many turn to specialist consultancies to help them get started where they lack the necessary competences. We investigate the program of one such consultancy, Advectas - in particular the advanced analytics Jumpstart. Using qualitative techniques including semi structured interviews and content analysis we investigate the nature and value of the Jumpstart concept through ive cases in diferent companies. We provide a deinition, a process model and a set of thirteen best practices derived from these experiences, and discuss the distinctive qualities of this approach.
INTRODUCTION
‘A journey of a thousand miles begins with a single step’.
Lao, irst century BC, the Tao Te Ching.
In the wake of the big data revolution, many organizations are experimenting with advanced analytics as a tool to help them stay competitive. Advanced analytics (AA) go beyond traditional business intelligence (BI) solutions based on performance indicators, dashboards and the querying of data warehouses to incorporate algorithmic techniques from machine learning, artiicial intelligence, natural language processing and other computer science disciplines. Gartner deine advanced analytics as follows: ’the autonomous or semi-autonomous examination of data or content using sophisticated techniques and tools, typically beyond those of traditional business intelligence (BI), to discover deeper insights, make predictions, or generate recommendations. AA techniques include those such as data/text mining, machine learning, pattern matching, forecasting, visualization, semantic analysis, sentiment analysis, network and cluster analysis, multivariate statistics, graph analysis, simulation, complex event processing, neural networks.’ (Gartner IT, 2017). Though these techniques are established in some large international companies, and some specialist data and software companies,
they represent a considerable learning challenge for the majority of companies.
AA projects are diferent from typical BI projects. Advanced analysis techniques are diicult to understand, even for the IT professionals in the companies, and represent black boxes for most decision makers. They may exploit external data sources (such as social media) as well as internal databases and unstructured data such as text and video as well as traditional structured data stored in transactional databases and data warehouse. This means that that the fusion of data is complicated by big data concerns (Kumar and Alencar 2016). They sometimes require dedicated hardware such as server clusters, and may use recent advances in database and software infrastructure (NoSQL databases, Hadoop, MapReduce). Many AA techniques depend on algorithmic techniques that can’t easily be understood without specialist mathematical and statistical training - the new profession of “Data Scientist” denotes the specialists with these skills. They often derive patterns and insight autonomously from data (Saltz, 2015), rather than following routines in the software designed by humans. The approaches develop rapidly in their specialist research areas. AA may entail the computation of unfamiliar mathematical models (sometimes too complex for human comprehension) and the results can be presented in probability-based generalizations and new kinds of visualizations (such as scatter plots and confusion matrices). All these characteristics may challenge the understanding and decision-making tradition of business professionals. A further problem is that, although AA techniques can ofer insights not available through conventional analysis (spreadsheets and dashboards, for example), they must carry some degree of trust before they are acted upon, and the analysis has no business value if there is no action resulting from it. Investments can be ‘useless, even harmful, unless employees can incorporate that data into complex decision-making’ (Shah, Horne, & Capellá, 2012).
Kickstart) analogy likens the starting of a car with a dead battery (by attaching jump leads to an external power source) to getting the analytics motor of a company going through adding the energy of a specialist consultancy irm. The jumpstart/kickstart terminology is fairly broadly used in the IT consultancy industry, (such that the Google query ‘jumpstart kickstart advanced analytics big data’ returns 208,000+ hits); however the term here refers to a consultant-driven early-stage experimental project. Many IT consultancies ofer these introductory services, though they don’t always use the jumpstart terminology. After the project (or at some point in the future), the client company should be able to run their own AA program. Though there are a number of recommendations in the literature for becoming a data driven organization (Barton & Court, 2012; Davenport, Harris, & Morison, 2010; Marchand & Peppard, 2013; Mazzei, McShea, & Oakley, 2016; Vidgen, Shaw, & Grant, 2017), most of this research is aimed at organizations experienced with data analytics. There is little research focused on inexperienced organizations in the start-up phase, and we found no investigations into the role of specialized consultancies in start-up. Moreover experience shows that ‘hurdles on the path to efective analytics use are highest right at the start of adoption’ (LaValle, Lesser, Shockley, Hopkins, & Kruschwitz, 2011), so it should not be expected that a Jumpstart is necessarily easy or painless.
We studied the experience of a one such consultancy irm with a Jumpstart program. Advectas is an international company with 140 employees in four countries, with its headquarters in Sweden. They specialize in decision support, business intelligence, and, increasingly, advanced analytics. Our research objective is to investigate and document the Jumpstart concept to provide a reference point
for future research, and to help specialist analytics consultancies to optimize their client experiences.
We followed their Jumpstart project experiences with ive client companies over a period of two years. The study investigates the nature and value of the Jumpstart process, and common enablers and obstacles in the joint consultancy/client projects. We used qualitative research methods, including interviews and content analysis. In the article, we describe the Advectas Jumpstart process, investigate what is known about getting started with advanced analytics in the scientiic literature, report our research method and the ive anonymized cases. Our case analysis leads to a deinition of an advanced analytics Jumpstart, a process model, and thirteen best practices. We draw conclusions for practice
and research.
JUMPSTART AT ADVECTAS
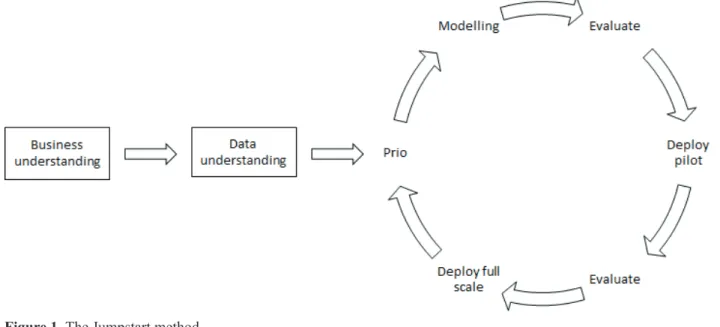
Jumpstart at Advectas is described to clients in terms of a process model, (in reality a modiied version of CRISP-DM (Wirth & Hipp, 2000)). It consists of two initial steps, followed by six steps
in a cycle, Figure 1.
The two initial steps are:
y Business understanding: a two step investigation of (1) the targeted business problem, and (2) what the project should achieve.
y Data understanding: provides an overview of the client’s available information situation.
The six step cycle consists of:
y Prio (short for prioritization): draws on the previous stages to identify a use case or scenario,
the necessary data underpinning and candidate analytics techniques for the Jumpstart. Time
and budget constraints, available staf and access to data should be agreed.
y Modelling: sets up the data and analytics techniques, deining variables and their relationships
y Evaluate: takes the modelling results back to the organization to check their validity and
usefulness.
y Deploy pilot: provides a working prototype which runs the analytics program on a set of relevant data and provides meaningful results.
y Evaluate: takes the prototype results back to the organizations to investigate their usefulness.
y Deploy full scale: implements the prototype with live data and full function coding to a
larger group in the client organization.
This process description provides a starting point for our study of ive Jumpstart projects.
Figure 1. The Jumpstart method
RESEARCH METHOD
In this research we investigate Jumpstart practice for advanced analytics through a rich description of real life experience (Yin, 2013), making it appropriate to adopt an inductive case
study approach. The study is exploratory in nature, aiming to formulate best practices by empirical
exploration set within a theoretical context. Exploratory case studies typically address questions concerning the dynamics of a particular social situation (Eisenhardt & Graebner, 2007), with the objective of developing early understandings. We use a structured case approach (Carroll & Swatman, 2000) with an iterative research cycle: plan, collect data, analyze, relect. We take care to frame our empirical indings with the enfolding literature. The study also involves elements of the multiple case study approach, since we analyze ive smaller projects within the umbrella of the Advectas case. This typically provides a stronger empirical base than a single case study (Benbasat, Goldstein, & Mead, 1987; Yin, 2013), and allows for cross-case comparisons to clarify whether an emergent inding is idiosyncratic, or replicated through several cases. Cause and efect patterns are retrieved by recursive
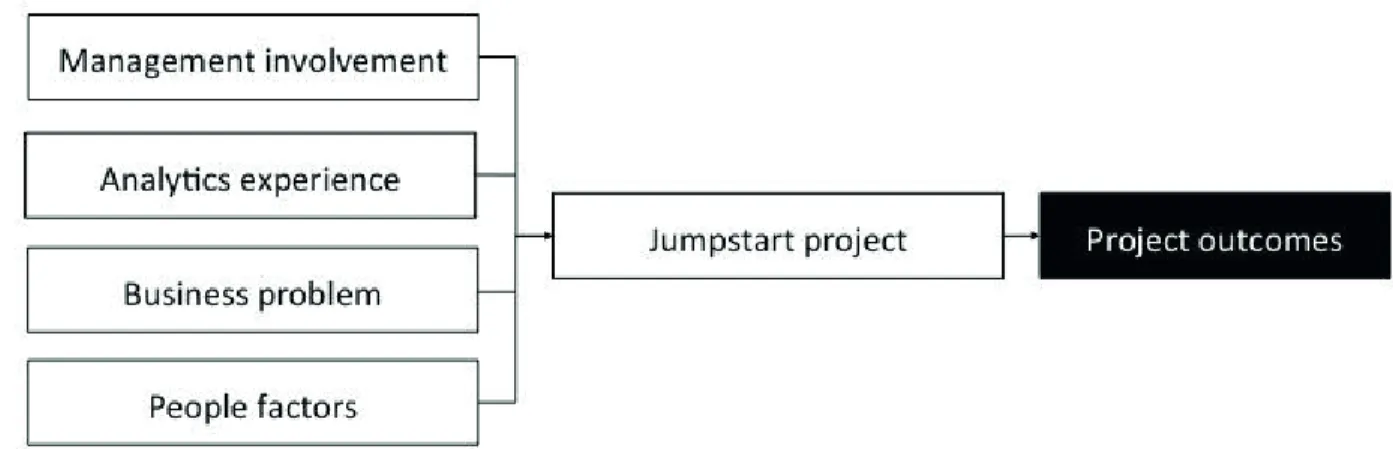
We collected various kinds of data from multiple sources including document inspection, company web-sites, live interviews, semi-structured Skype interviews, company visits meetings and workshops over a two year period (see appendix A). Nine semi-structured interviews lasting 45-60 minutes with consultants and clients were conducted in total, and the interviews were recorded. We used early empirical indings, a case analysis (case A) and a literature study (see next section) to derive a research model (igure 2), since we were not able to ind a suitable model in the literature. The research model structured a reined interview protocol and subsequent data collection.
Figure 2. Research model for structuring of data collection
The model suggests that ive main types of enablers inluence the results of a Jumpstart:
y Management involvement: the degree, extent and type of involvement from more senior
members of the client organization.
y Analytics experience: previous experience and competence with formal analysis of data, for
example through a business intelligence project.
y Business problem: the nature and complexity of the business problem addressed.
y People factors: cultural, political and social inluences (such as teamwork and trust) together with the prior knowledge and personal resources of the people concerned.
y The Jumpstart project: involving the conduct of the project itself, the methodology and tools
used, and the systems, data and algorithmic techniques employed.
Beneicial outcomes can include business insights, information for decision-making, strengthening the client-consultant relationship, providing catalyst efects, and a variety of learning
outcomes related to data and analytics.
The data analysis was conducted with content analysis (Berelson, 1952; Krippendorf, 2004).
Content analysis yields ‘a relatively systematic and comprehensive summary or overview of the dataset as a whole’ (Wilkinson, 1997). In this case it operates by observing patterns of enablers
Categories can be elicited in a grounded way (as in our case) or can originate from an external source such as a theoretical model (Wilkinson, 1997). No quantitative measures for success were adopted; instead the analysis relied on the interviewees’ assessment of the relationship between their project actions and perceived positive or negative outcomes. Three researchers coded the interviews from the original interview recordings, and the results were checked for consistency and concatenated, allowing analytic investigation by theme, by company or by frequency of appearance. A coding example is given in Appendix B. The emerging enablers were discussed and iteratively improved by comparison with the complete dataset, and then taken to a workshop at Advectas for reinement and validation. The best practices listed later represent concatenated normative versions of enablers identiied during analysis.
JUMPSTART ENABLERS
There is a variety of research about business intelligence and big data projects in companies; here we summarise enablers that may be relevant to consultancy-driven AA jumpstarts. These insights
form the starting point for data collection and analysis.
Management Involvement
The literature asserts that support from management is necessary for running any type of
BI-project, including advanced analytic projects. A survey of executives by Brown and Gottlieb (2016) showed that ensuring involvement of senior management was the most signiicant reason for analytics
success. In addition, respondents from successful analytic projects reported more often that they had
received direct sponsorship from the CEO. Senior leaders and CEOs need to be actively involved in advanced analytic projects (Groves, Kayyali, Knott, & Van Kuiken, 2013). For example, Mazzei et al. (2016) suggest that CEOs need to work on four things in order to keep their analytics project on
the right track: i) actively manage C-suite dynamics, ii) chose the right analytics leader, iii) challenge existing mental models, and iv) create an environment of rapid innovation. Involvement of senior
management is also mandatory for any organization that has the ambition to establish an analytics
enterprise-wide initiative, otherwise analytics initiative are likely to remain in siloes within the enterprise (Watson, 2016). Whereas theory suggests that top managers must be involved in enterprise-wide analytics programs, it is much less explicit about start-up experiments, and seldom mentions the involvement of middle management.
Analytics Experience
Analytics are typically categorized as descriptive, predictive, and prescriptive (Davenport, 2013; Turban et al., 2015). Descriptive analytics are widespread even in smaller organizations and
entail the investigation of what happened in the past through structured internal data held in the company’s databases or migrated to a data warehouse solution built for the purpose. However, some degree of maturity in descriptive analytics, even at the level of data mining, does not guarantee success with advanced analytics. Predictive analytics use a variety of computational techniques to infer from historical data what may happen in the future and prescriptive analytics extend these
insights to include decision options and their computed consequences. In addition to the
scale of data), velocity (streaming data) and variety (external and non-structured data such as text and video). Thus the competences required for advanced analytics are many and varied. Analytical competence development within an organization takes place in two categories: technical-oriented competence, and business-oriented competence (Davenport & Patil, 2012). Technical-oriented competence development involves building up skills that resemble those of a data scientist. Business-oriented competence involves developing the ability to utilize analytics for business value. A recent success factor for wider adoption of BI and analytics (for instance within Tetra Pak, former winner of the Gartner BI Excellence Award) has been the introduction of a BI expert. A BI expert acts as a bridge between data scientists and IT-specialists on one side, and business specialists on the other (Ohlsson, 2017). A similar role, business translators, is suggested by Henke, Bughin, and Chui (2016). Maturity models (Lahrmann, Marx, Winter, & Wortmann, 2011) theorize and assess the level of maturity, and an organization with better existing maturity at the start of its analytics Jumpstart is assumed to be more likely to succeed with it. LaValle, Hopkins, Lesser, Shockley, and Kruschwitz (2010) introduced a maturity model for analytics with three levels: aspirational, experienced, and transformed. For each level six factors are investigated: motive, functional proiciency, business challenges, key obstacles, data management, and analytics in action. The model was introduced to help organizations to assess
their analytics maturity. The maturity model does not explicitly focus on progression of analytical
competence within an organization. However, progression can to some degree be deduced from investigating the three factors: motive, business challenges, and key obstacles.
The Business Problem
Chen, Chiang, and Storey (2012) list ive areas where AA are likely to have a big impact: e-commerce and market intelligence, e-government and politics 2.0, science and technology, smart health and well-being, and security and public safety. In practice the business needs of organizations vary considerably, and an early stage in adopting advanced analytics is simply demonstrating their value on a relevant business or organizational problem. Suitable problems explore data, for instance categorizations, predictions, associations, or prescriptions. The organization tends to deal with these problems in a time-consuming manual manner, or regard them as unsolvable. Since AA are normally data driven (Chen et al., 2012), it’s common to select open problems and allow the analytics to automate the search for hidden patterns or trends in the data. Where patterns or trends appear
interesting or unusual the next step is to develop interpretations or models that explain them (He, Zha, & Li, 2013). However Rose and Lennerholt (2017) point out that this style of problem solving makes it hard to focus on a deined problem and to solve it by hypothesis testing. As organizations become more familiar with AA techniques, problem choice becomes simpler, speed to insight improves and use becomes more pervasive (Wixon, Yen, & Relic, 2013).
People Factors
Working with advanced analytics requires that people use analytical tools to investigate and learn about a business problem, in order to improve decision-making. Thus ‘analytical techniques and controlled experiments are tools for thinking’ (Marchand & Peppard, 2013). However it is the
analytics projects: analytics force changes on the C-suite (Mazzei et al., 2016), many business people
(including managers) are uncomfortable working with data (Marchand & Peppard, 2013), managers don’t understand or trust big data based models (Barton & Court, 2012).
The Jumpstart Project
Researchers ofer two conlicting models for getting started with AA. The high impact model suggests the start should be substantial, inluential and pivotal for the whole organization’s future:
‘the challenge should be big, the model insightful and the business vision complete’ (LaValle et al., 2011). The low cost model focuses on the opposite strategy: small-scale experiments through
targeted prototyping for a quick win. According to (Franks, 2012) companies should ‘deine a few
relatively simple analytics that won’t take much time or data to run ... capture some of the data in
a one-of fashion…. turn analytic professionals loose on the data.’ Gust et al. (2017) describe an
internal seed project in a Swiss company with some of the same characteristics as a Jumpstart. As for team coniguration, emphasis should be put on a small mixed team that work well in a test and learn environment. Having a small group of people with mixed competences ofers several advantages in terms of quality, speed and lexibility. The bigger the group is, the longer it may take to complete the project. In an ideal world, a Jumpstart project should mimic a project in a data-driven organization, where business people and data scientists continuously run experiments together in order to learn more about their business (Watson, 2016). This presents challenges both to conventional analytical processes (ask the IT department to prepare a report) and intuition-based decision-making. A method similar to CRISP-DM (Wirth & Hipp, 2000) is often adopted, though some researchers combine this kind of approach with system development methods such as agile development (Larson & Chang, 2016).
FIVE JUMPSTARTS
This section provides a short background to the ive Jumpstarts that were conducted. Company names have been anonymized.
Company A
Company A operates transport services for freight and passengers between the major destinations of Europe. Advectas were invited to work with Company A’s marketing and IT departments as a part of a wider vision to become data driven - a company which made decisions on the basis of data analysis. Advectas cooperated with the marketing department and operated as a specialized resource for the IT department, but the company’s business intelligence group was not much involved. Four Advectas consultants participated and at least ten people from Company A, including relevant
business managers. The project focused on business questions around the passenger loyalty program
(what they buy, how often they travel, what the value of the program is, etc.). The project should develop a test environment and some models that should eventually help marketers to conduct much
more sophisticated data analysis than their simple data queries and excel sheets currently enabled.
y porting data from source systems including the company’s aging customer relationship
management systems and their website usage analysis software,
y integrating it in a data lake based on Microsoft Azure Platform
y developing analysis models including some advanced analytic machine learning, primarily in the PowerBI tool, and Azure Machine Learning
y making the environment available to marketers to run their own custom analyses.
The irst three objectives were achieved but there were many diiculties to solve along the way. The lack of a clear business (marketing) objective led to many diferent demands and foci for the
project. “In the beginning, it was a bit loose … exactly what data should we use ... [move the data] up in the cloud and then run Power BI ... and some machine learning” (Consultant 1). Later there were
rapidly expanding requirements and ambitious expectations. There were many problems with the data, including quality problems, legal problems, and missing data when it came to modelling important problem variables. PowerBI turned out to have limitations in relation to the more advanced models and analytics. There were organizational problems as well, even with simple things like getting hold of necessary software licenses. The marketing department saw the project as an opportunity to bypass the IT department and get the systems they wanted built, but had little expertise in formulating what these systems should look like. At the same time they did not really trust the data or the results they got. Top management was involved in the launch of an enterprise-wide program for data driven decision making, in which the Jumpstart project served as one of the initial steps. However, the overall vision for data driven decision making had uneven commitment from managers and little buy in from staf. Both IT staf and marketers felt threatened by the diferent approach and new competences required - “[they] were very worried that the machine-learning part would continuously run live analysis and generate the same insights as they [the business people] did” (consultant 1). Advectas understandably focused on the technical development and it was unclear who was leading
the necessary organizational change program - “the technical solution, is still rather straightforward and simple, ... but then the other things swelled up” (Consultant 1). The project did not continue to a
production system but had important catalyst efects for Company A. They understood a clear need for
better data quality and analysis competence and appointed a data quality specialist, a mathematician
and a marketing analyst to ill these gaps.
Company B
Company B is a Scandinavian retail chain, with more than 200 shops in Sweden, Norway and Finland. The project had a budget of 100 consultant hours and involved two Advectas data analysts and three IT staf from Company B. The IT department was interested to ind out what could be achieved with data analytics, but had no serious history with them. They hypothesized that sales might vary with the weather (“many opinions for or against [a potential pattern]” (Consultant 2)), though the business staf were not much involved in the project. However, Company B had no appropriate tools to investigate the hypothesis further on their own. The project focus was set to investigate correlations between historical sales data with location and publically available weather data. The analysts from Advectas settled eventually on a model using the random forest algorithm, and were able to illustrate several interesting correlations, through two deliveries. The inal event was a presentation to which senior business managers were invited, which provoked some inspiring discussion and business
it was more constructive discussion”. It is not known whether these suggestions were developed or
implemented in the business. Advectas’ competences were demonstrated and Company B intend to pursue analytics, but there was no follow up cooperation at the time of writing.
Company C
Company C is a recycling company in Sweden. The Jumpstart arose from earlier contacts and projects in sister companies. Five Advectas staf were involved intermittently, and several managers, two in particular, were involved from Company C. The production managers were more enthusiastic for the project than the operators, who were however happy to provide input, and the IT staf were only supericially involved. Company C, wanted an explicit small scale proof of concept which would show that advanced analytics could make the business more efective by optimizing the smelting furnace operation. The furnace operates a continuous cycle which is expensive to run, and where small optimizations save a lot of money and increase production capacity signiicantly. However there are many parameters (temperature, gas, oxygen, impurities in the raw material, ilters) in running the furnace, and various control systems, making it dependent on operator knowledge, skill and experience. Data is provided by 10-15 diferent sensors in the furnace + visual input. A lot of data was provided, but there were consistency and quality problems, diferent operation modes, and some
encrypted data. According to consultant 3, “it became a jouney of a thousand miles to arrange all
that information… we had to put in lots of extra time [to ix data quality problems] .. several months
of delay”. The project was in the model development stage at the time of writing, with good potential to codify and automate the operational experience of the operators.
Company D
Company D operates a large leet of tankers carrying cargoes of petrol, chemicals and liqueied gas all over the world. Since fuel oil is a major cost for Company D, they cooperated in a Jumpstart with Advectas designed to help them predict Worldscale rates 14 days in advance. Worldscale rates are used to calculate freight charges and based on several parameters such as bunker prices, port costs, and market rates. In the beginning, expectations were low - “the [business specialist] who worked with it [manual prediction] was very sceptical that a model would be able to guess
prices 14 days in advance” (Consultant 1). However, a rather successful small-scale Jumpstart saw
the development of a predictive model (random forest model, modiied classiication) based on historical data (oil spot prices, exchange rates, etc.). The model ofered fair (70%) accuracy and good visualization possibilities (e.g. confusion matrix, scatter plot), which were easy to understand and
showed promising results. There was a mixed reception to analytics, some positive, others sceptical. The company was keen to continue and implement a production system in machine learning, but a
number of problems appeared. Expectations had been raised too high, the model didn’t perform so
well with live production data, the historical data had been somewhat manipulated and there were data quality problems which caused the project to drag out over several months. Close cooperation in the project declined as Advectas personnel changed, and Company D staf felt a little threatened as the algorithm seemed to compete with human competences - “we can compare it [the algorithm] with human guesses, but … [the business specialist] did not want to benchmark against the algorithm”.
Meanwhile the senior management had become a bit too enthusiastic: the company made a promotion video claiming that they could predict business conditions (e.g. Worldscale rate, oil prices) fourteen
and the eventual production program ofered considerably more modest results. However it is still operating and used as an input for managers’ decision-making, and the company understood the potential value of predictive analytics to their business. Company D later hired their own data scientist and is clearly making a serious attempt to be a data driven company.
Company E
Company E is a large retail warehouse in Sweden, selling more than 100,000 individual product lines, and attracting customer visits from all over Scandinavia. The company wanted to predict sales for diferent divisions during a day, which in turn could help optimizing allocation of personnel. The inancial managers were involved in the Jumpstart and supplied their own simple sales igure data, but the IT department had their own technologies and solutions and preferred not to be involved. Two of Advectas’ consultants (with assistance from the sales manager) spent about three weeks developing an analysis approach based on neural networks around problems in logistics and personnel allocation. The techniques produced usable results, but were hard to explain to inancial managers more accustomed to working with spreadsheets. According to consultant 4, Company E “did not understand how the
algorithms worked, … we could explain for them how time-series worked but not neural networks”.
Several people at Company E remained sceptical of results generated by the neural networks, and were not willing to compare them with results produced by existing manual techniques.
JUMPSTART ANALYSIS
Management involvement
Although senior management involvement is often assumed to be a pre-requisite for success, there was a varied picture in the project we studied. Company A and Company D had some direct involvement of the top management, where they also had early strategic commitments to more extensive programs. Other projects had little or no top management involvement, for instance the senior management of Company B were invited to the wrap-up event, but were not involved the Jumpstart. Nor was the involvement of top managers always beneicial: the Jumpstart for Company D was a technical success, but the senior management inappropriately raised expectations, contributing to the project running into diiculties. Though some companies showed early indications of a strategic move to enterprise-wide analytics or a data driven culture, this seemed generally beyond the scope of a Jumpstart. However, three out ive Jumpstarts had middle managers with relevant expertise actively and beneicially involved: Company A (business managers), Company C (production managers), and Company E (inancial managers).
Analytics Experience
for existing analytical understandings (what do we know and how do we know it?), or very clear speciications for what was being analysed and why. The learning curve could be steep – sometimes too steep. Company E (more used to simple formulas in spreadsheet analysis) was ofered a predictive model featuring neural networks – however this was efectively a black box that staf weren’t ready to trust. A major obstacle was often the existing information infrastructure – good enough for producing inancial reports but not really designed for extracting and integrating data outputs from multiple
sources.
The Business Problem
A clear, limited and well-focused business problem increased the chances of success. Most of the companies had such a focused business problem requiring predictive analytics as a starting point. Company A worked on a business problem that was less precise and coupled to other marketing goals and the company’s wider analytics ambitions. This encouraged project scope creep and unclear goals, and the involvement of multiple actors (for instance at workshops). It was not so clear that the business problem was solved, or that the projects led to revolutionary business advantage. The analytical models and results provided business insights not previously available, better information for decision-makers and illustrated the potential value of advanced analytics for a real business problem. There was often additional learning about the information and IT infrastructure: data quality, integration, systems, storage, platforms, algorithms etc. The Jumpstart provided a small-scale example of a new way of working where data analytics provide the foundation for decision-making,
and emphasized the importance of the information infrastructure that supplies the data.
People Factors
It was noticeable at some companies that advanced analytics were challenging. The combination of lack of previous experience and a low level of trust in data, IT systems, analytics and consultants may lead to scepticism, lack of conidence, and feelings of being challenged or threatened. Three companies (A, D, E) out of ive, encountered some negative reactions to advanced analytics. These companies also experienced issues related to lack of trust in the project’s results. Company B and C had no obvious negative reactions. A potential explanation is that the Jumpstart in Company B and C, did not, in the short term, challenge the existing workforce. In addition, neither Company B or C had any issues with exaggerated expectations to advanced analytics.
The Jumpstart Project
elsewhere) – this had a negative efect on the project. The Jumpstart at Company A evolved beyond the small-scale experiment - a high level of ambition, expanding requirements, multiple business problems and many people - but this was diicult to handle. Though Advectas’ process model (igure 1) distinguishes between a pilot implementation and a full-scale deployment, this was not a prominent feature the projects we studied, and was not emphasised by Advectas either.
Analysis summary
Most of the projects had the following things in common. They adopted the small-scale experiment model rather than the high impact model. In principal, they were designed with a limited budget, constrained project duration, and few core project members. In this respect they were more proof of concept (show us that we can get something useful from analytics), than a revolutionary business advance. They employed advanced analytics involving some form of machine learning or statistical analysis that was well beyond the experience of the company. Middle managers with relevant business and/or IT experience were active and involved. The client company often saw the projects as an investment in competence building and they were normally satisied when they learned
more about their business, or sometimes if they learned more about their IT systems, the data they
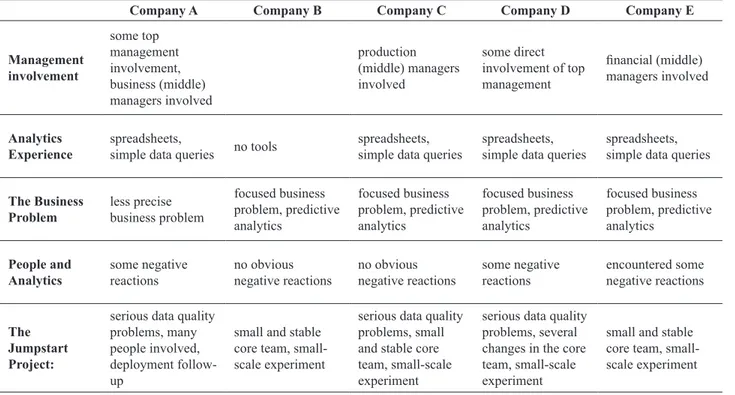
had available and new analysis possibilities. A clear business problem or hypothesis increased the chances of success. Though a pilot was always developed, a full-scale deployment was more likely to be understood as a follow-up project. The analysis is summarised in table 1:
Table 1. Analysis summary
Company A Company B Company C Company D Company E
Management involvement some top management involvement, business (middle) managers involved production (middle) managers involved some direct involvement of top management inancial (middle) managers involved Analytics Experience spreadsheets,
simple data queries no tools
spreadsheets, simple data queries
spreadsheets, simple data queries
spreadsheets, simple data queries
The Business Problem less precise business problem focused business problem, predictive analytics focused business problem, predictive analytics focused business problem, predictive analytics focused business problem, predictive analytics People and Analytics some negative reactions no obvious
negative reactions no obvious negative reactions some negative reactions
encountered some negative reactions
The Jumpstart Project:
serious data quality problems, many people involved, deployment follow-up
small and stable core team, small-scale experiment
serious data quality problems, small and stable core team, small-scale experiment
serious data quality problems, several changes in the core team, small-scale experiment
THE ADVANCED ANALYTICS JUMPSTART: DEFINTION, PROCESS MODEL, BEST PRACTICES
Jumpstart deinition
As a result of this investigation we understand an AA Jumpstart to be an introductory AA project
in a client company inexperienced in analytics, led by a specialist consultancy. The project is designed
as a small-scale experiment, with low costs and low risks for the client and with signiicant interaction between consultants and company staf. Jumpstarts are focused at delivering business value, but also ofer various knowledge transfer and catalyst outcomes. Above all they should stimulate further interest in the client company, inspiring new initiatives and functioning as proof of concept – the client learns enough about the value of AA to wish to continue. The consultancy hopes to develop a relationship with the client and win further business.
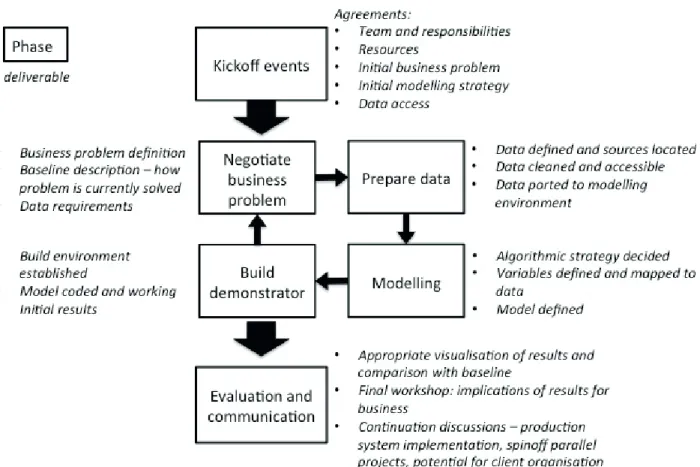
Jumpstart process model
Figure 3 ofers a modiied and ampliied version of Advectas’ Jumpstart process (igure 1) that is in harmony with what we observed in the case examples. Major phases are speciied together with deliverables, such that it could serve as a project management tool for a consultancy managing a
Jumpstart.
Jumpstart best practices
This section takes the form of normative advice for consultants running Jumpstarts derived
from the theoretical and empirical analysis.
Management Involvement
Though management should be involved at various levels, the role of middle management in a
Jumpstart is more critical to its success.
y Ensure that top management are supportive (they’re not necessarily directly involved). Top
management may need to authorize resources for the Jumpstart and show an interest, but the scale of the projects are usually too small for them to be directly involved.
y Actively involve middle management owning the business problem. Local managers are
crucial to the success of the Jumpstart, supplying invaluable knowledge of business needs and data conigurations, driving the project, solving practical problems and shortcutting bottlenecks. They improve their analytics competence (both business-oriented and technical-oriented) in the project, and take responsibility for knowledge transfer and realistic feedback to IT and business managers not directly involved.
y Negotiate realistic expectations for project outcomes with management. Advanced analytics
are currently surrounded by a great deal of hype, and managers can easily be swept away by exaggerated claims and expectations. Small-scale experiments with limited resources are unlikely to change the future of a company, but they can provide valuable insights into speciic business problems, and demonstrate the potential value of analytics. Setting explicit and realistic goals and targets (and achieving them) is better than letting expectations run
and then disappointing the personnel.
Analytics Experience
Many Jumpstart organizations have a low level of analytical sophistication, which has consequences for the ambition-level and conduct of the Jumpstart.
y Understand the company’s analytics maturity and focus on explanation and education
(particularly at kick-of and wrap-up events). Low levels of analytics experience mean that most Jumpstarts must focus on knowledge transfer and competence development in order to succeed. An early Jumpstart task is to assess the starting competence level at the client company, and provide the necessary explanation and education at kick-of to bring project members on board. The wrap-up event should focus on lessons learnt, and highlight advances in analytics understanding.
y Match the analytics complexity of the Jumpstart to the maturity of the company. Many
Business Problem
A focused business problem utilizing predictive analytics was advantageous.
y Choose a limited business problem focusing on predictive analytics. Descriptive analytics
typically require a data warehouse solution (beyond the scope of a Jumpstart), and prescriptive analytics assumes that predictive insights are already available and ready to be automated. A limited business problem involving predictive analytics is the preferred
choice.
y Formulate the business problem as clearly as possible. Small scale projects require a limited
scope and clarity of purpose. A clearly formulated problem reduces the risk of confusion, lack of focus and delays as the project progresses.
y Describe the existing ways of addressing the problem (the baseline). The perceived success
of the project is normally dependent on being able to demonstrate an improvement, or solution to the problem. Briely documenting the existing way of tackling the problem establishes a baseline, though this can be sensitive (since it is sometimes an area of concern in the company). The eventual Jumpstart results should show at least the potential for an improvement to the baseline.
People Factors
Jumpstarts need to deal with negative reactions as well as enthusiastic ones.
y Address expectations and anxiety. The people directly or indirectly involved in a Jumpstart
may be inexperienced with advanced analytics. This can lead to two problems: exaggerated expectations or negative reactions. Negative reactions may include scepticism, distrust, and feeling challenged or threatened. Some may even feel that their jobs are threatened.
Jumpstart teams should recognize and, as far as possible, address these concerns. Most
advanced analytics tools provide better (but not infallible) support for decision makers - they do not replace the decision maker.
y Build trust by patiently explaining issues and techniques, and by showing that the analytics results are reliable and dependable. The data foundation for a Jumpstart is often incomplete
and faulty, the computational techniques involved are diicult to understand, and the models developed are often black boxes. This means that trust in the project’s results can be very low. Jumpstarts need to build trust by explaining the issues involved and how they are tackled, by providing non-mathematical analogies for the techniques used, and by showing a consistent stream of improving results.
Jumpstart Project
The four previous enablers (management involvement, analytics experience, business problem, and people factors) inluence, but do not determine the conduct of the Jumpstart project.
y Design the project as a small-scale experiment, with a constrained business problem, a small (carefully chosen) core project team, and time boxed execution. Projects are more
business problem ensures that the project objectives cannot multiply out of control. A core
project team might include from the consultancy side: project manager, data scientist, data
engineer; from the client side: business specialist (problem owner) with in-depth knowledge of the problem and data, IT person with knowledge of IT feeder systems, manager with the authority to problem solve and organize resources. The project is more efective if the team remains intact and this is easier to achieve if there is time boxing (1-2 months), which also helps to avoid creep in the project scope, and ensures that there are timely results.
y Address data quality early. Since most companies data infrastructure is not organized with
the purpose of providing data for advanced analytics, acquiring and preparing the data can be a diicult and costly. A Jumpstart should negotiate how to proceed in this case, and make
sure the problem is explicit and budgeted for.
y Explain the results carefully in terms that the client can understand, and demonstrate the progress that has been made. It’s not the client’s responsibility to appreciate the power of
advanced analytics, it’s the Jumpstart project’s responsibility to explain its results in terms that business and IT people can understand. The consultancy specialists need to take the lead, and a variety of appropriate visualizations and careful explanations will help. A
wrap-up meeting should also specify the progress that has been made on the baseline, in terms of
business insights, better information for decision makers and analytics learning.
DISCUSSION
The literature we studied deals primarily with business intelligence and big data projects conducted internally in organisations, and here we contrast this with our investigation of AA Jumpstarts. Though involvement from senior management is usually understood to be critical (Brown & Gottlieb, 2016; Groves et al., 2013; Mazzei et al., 2016), we found that the active involvement of middle
management was more important in ensuring Jumpstart success. They provided invaluable business knowledge, smoothed the path of the project in the face of anxieties, were active learners and the initiators of future steps. C-suite executives sometimes authorized resources and provided symbolic backing. All our case studies chose a business problem that explored data using predictive analytics, rather than descriptive or prescriptive analytics. We surmise that descriptive analytics provide too little that is innovative, whereas prescriptive analytics are beyond the reach of inexperienced companies. Jumpstarts tackled a variety of diferent business problems in diferent business areas, and it was not really signiicant which area was chosen – more important was precise focus and limited scope. Advanced analytics can be used in many situations, but there was less involvement with typical big data concerns. Companies were still mainly reliant on their own internal data, though there was some use of external data (e.g. social media), and unstructured data. Jumpstart consultancies worked with
primarily inexperienced companies – typically at the aspirational level of analytics maturity (LaValle
et al., 2010). This relects a situation, even in technologically advanced countries, where a few large
(Wixon et al., 2013). We found evidence that the integration of diverse skill sets was diicult and
important. We found both (positive) enthusiasm and (negative) lack of trust for analytics (not only amongst management), but the scale of a Jumpstart is usually too small to be threatening to senior managers. On some occasions AA showed the potential to automate the functions of operational staf, and given the long history of automation related redundancy with IT, this might be a powerful people factor in the future. Jumpstarts favoured the small-scale experiment project model over the high impact model. There is no particular reason why a consultancy company should not be involved in a major organization change program, for instance the enterprise-wide move to a data driven culture. However the small-scale experiment model is a low risk alternative with good potential for small quick wins. Though project process is sometimes based on CRISP-DM, sometimes on software development (Larson & Chang, 2016), AA Jumpstarts show suiciently distinctive characteristics to warrant independent consideration. A inal observation is that it is unclear in the literature what the step after Jumpstart might be; where should an organization on the AA journey go next?
CONCLUSIONS
In this article we investigated the experiences of ive diferent Swedish organizations starting their journey towards in advanced analytics through the vehicle of a Jumpstart – a consultant-driven introduction project. The common factor in the projects was the consultancy company, which provided specialist expertise in advanced analytics not otherwise available to the companies – we took primarily the consultant perspective in this study. There is no strong theory base in early stage AA introduction, or the role of consultancy companies in these irst steps. We conducted a qualitative investigation of the Advectas experience through interviews, document study and workshops, using content analysis as the primary analysis of the ive cases. We concentrated on ive theory-derived enablers: management involvement, analytics experience, business problem, people factors, and the Jumpstart project itself. The contribution is a deinition, a process model, and set of best practices derived jointly from existing theory and the empirical analysis, which are intended to be of value to practitioners in the ield, and to inform researchers.
We can point to the following implications for practitioners. It is expected that advanced
analytics are here to stay in some capacity in all but the smallest organizations, so the majority of
companies in advanced technological societies will make this transition, if they have not already started. Specialist data analytics consultancies can play an important role in taking the irst steps, with a range of skills including problem selection, data science competence, data management, model construction, result visualization, skillset integration, Jumpstart management, analytics education and beneits management. Jumpstart is efective in the sense that a small number of consultancy irms with specialist analytics expertise, can demonstrate business value and increase trust in AA in a large number of organisations in a relatively short time. Consultants provide the missing expertise for an
initial AA project. They may also jumpstart the organisation along multiple dimensions, rather than
– this is a major factor in the future impact of a successful project. A technically successful project has little impact if its results are not trusted and used. Researchers may care to complement the
extensive research on algorithmic techniques for problem solving with more integrative research that focuses on how to make existing techniques accessible and understandable for practitioners, how to couple them in to real-life data and legacy systems, and practice-based research into how to move organizations through early analytics experience towards data-driven decision-making embedded in
organisational culture.
The Swedish experience, although not expected to be untypical of advanced technological
societies, need to be corroborated in other similar societal contexts, and this research is also limited by focusing on the experience of a single consultancy company. Though other companies run similar
Kickstart and Jumpstart programs it is not known how representative the Advectas cases are. We worked with loose deinitions of AA project success and would like to develop formal deinitions and if possible metrics for this. We also intend to investigate how organizations work with establishing data-driven decision-making practice, and the role of specialized data analytics consultancies in this
progression.
ACKNOWLEDGEMENT
The work is partially supported by the Knoweldge Foundations of Sweden.
REFERENCES
Barton, D., & Court, D. (2012). Making Advanced Analytics Work For You. Harvard Business Review, 90(10), 78-83.
Benbasat, I., Goldstein, D. K., & Mead, M. (1987). The Case Research Strategy in Studies of Information Systems. MIS Quarterly, 11(3), 369-386.
Berelson, B. (1952). Content Analysis In Communicative Research. New York: Free Press.
Brown, B., & Gottlieb, J. (2016). The need to lead in data and analytics. Retrieved from McKinsey &
Company:
Carroll, J. M., & Swatman, P. A. (2000). Structured-case: a methodological framework for building theory in information systems research. European Journal of Information Systems, 9(4), 235-242.
Chen, H., Chiang, R. H., & Storey, V. C. (2012). Business Intelligence and Analytics: From Big Data to Big Impact. MIS Quarterly, 36(4), 1165-1188.
Davenport, T. H. (2013). Analytics 3.0. Harvard Business Review (December).
Davenport, T. H., Harris, J. G., & Morison, R. (2010). Build an analytical culture Analytics at Work: Smarter Decisions, Better Results: Harvard Business Press.
Davenport, T. H., & Patil, D. J. (2012). Data Scientist: The Sexiest Job of the 21st Century. Harvard Business Review, 90(10), 70-76.
Eisenhardt, K. M., & Graebner, M. E. (2007). Theory building from cases: Opportunities and challenges. Academy of management journal, 50(1), 25-32.
Groves, P., Kayyali, B., Knott, D., & Van Kuiken, S. (2013). The ‘big data’ revolution in healthcare. Retrieved from McKinsey Quarterly:
He, W., Zha, S., & Li, L. (2013). Social media competitive analysis and text mining: A case study in the pizza industry. International Journal of Information Management, 33(3), 464-472.
Henke, N., Bughin, J., & Chui, M. (2016). Most Industries Are Nowhere Close to Realizing the Potential of Analytics. Harvard Business Review Web Article.
Krippendorf, K. (2004). Content Analysis. Thousand Oaks: Sage.
Kumar, V. D., & Alencar, P. (2016). Software engineering for big data projects: Domains, methodologies and gaps. Paper presented at the 2016 IEEE International Conference on Big Data (Big Data).
Lahrmann, G., Marx, F., Winter, R., & Wortmann, F. (2011). Business intelligence maturity: Development and evaluation of a theoretical model. Paper presented at the Proceedings of the 44th Hawaii International
Conference on System Sciences.
Larson, D., & Chang, V. (2016). A review and future direction of agile, business intelligence, analytics and data science. International Journal of Information Management, 36(5), 700-710. doi: http://dx.doi. org/10.1016/j.ijinfomgt.2016.04.013
LaValle, S., Hopkins, M. S., Lesser, E., Shockley, R., & Kruschwitz, N. (2010). Analytics: The New Path to Value. Retrieved from MIT Sloan Management Review:
LaValle, S., Lesser, E., Shockley, R., Hopkins, M. S., & Kruschwitz, N. (2011). Big Data, Analytics and the Path From Insights to Value. MIT Sloan Management Review, 52(2), 21-32.
Marchand, D. A., & Peppard, J. (2013). Why IT Fumbles Analytics. Harvard Business Review, 91(1-2),
104-112.
Mazzei, C., McShea, C., & Oakley, D. (2016). How CEOs Can Keep Their Analytics Programs from Being a Waste of Time. Harvard Business Review Web Article.
Miele, S., & Shockley, R. (2013). Analytics: The real-world use of big data. Retrieved from IBM Institute for
Business Value, Said Business School:
Ohlsson, F. (2017). Building a global culture of analytics. Beslutsstödsdagen 2017, Stockholm.
Rose, J., & Lennerholt, C. (2017). Low Cost Text Mining as a Strategy For Qualitative Research. Electronic Journal of Business Research Methods, 15(1), 2-16. http://issuu.com/academic-conferences.org/docs/
ejbrm-volume15-issue1-article447?mode=a_p
Saltz, J. S. (2015). The need for new processes, methodologies and tools to support big data teams and improve big data project efectiveness. Paper presented at the 2015 IEEE International Conference on Big Data (Big Data).
Shah, S., Horne, A., & Capellá, J. (2012). Good data won’t guarantee good decisions. Harvard Business Review, 90(4).
Turban, E., Sharda, R., Delen, D., Aronson, J. E., Lian, T.-P., & King, D. (2015). Business intelligence and analytics : systems for decision support. Harlow, Essex: Pearson Education.
Watson, H. J. (2016). Creating a Fact-Based Decision-Making Culture. Business Intelligence Journal, 21(2),
5-9.
Vidgen, R., Shaw, S., & Grant, D. B. (2017). Management challenges in creating value from business analytics. European Journal of Operational Research, 261(2), 626-639.
Wirth, R., & Hipp, J. (2000). CRISP-DM: Towards a standard process model for data mining. Paper
presented at the Proceedings of the 4th International Conference on the Practical Applications of
Knowledge Discovery and Data Mining.
Wixon, B. H., Yen, B., & Relic, M. (2013). Maximizing Value from Business Analytics. MIS Executive Quarterly, 12(2), 111-123.
Yin, R. K. (2013). Case study research: Design and methods (4th ed.). Thousand Oaks, California: Sage
Appendix B. Coding example
Category Feature Company
A
Company B
Company C
Company D
Company E
T1: Management IT management involvement x x
T1: Management inancial managers involved x
T1: Management top managers involved x x
T1: Management ambition to be data driven/
organisational change x x
T1: Management production managers involved x
T2: Analytics little experience/
immature in analytics x x x
T2: Analytics experience with business
intelligence x
T2: Analytics little trust for analytics x
T3: Business problem results in new decision/change/new hiring x x
T3: Business problem driven by business x x x
T3: Business problem sales x
T3: Business problem clear business problem or
hypothesis x x x
T3: Business problem marketing x
Appendix A. Data collection
Reference Date Organisation Type Purpose
1 March 1 2016 Company A + Advectas On site Introduction to analytics project at Company A
2 May 11 2016 Company A (IT/IS) Phone Introduction to analytics project
3 May 31 2016 (Head of analytics vision)Company A On site In depth vision of analytics project
4 May 31 2016 Company A (IT) On site IT’s role in the analytics project 5 May 31 2016 Company A (Marketing) On site Business’ role in the analytics project 6 October 28 2016 Advectas On site Initial planning of case studies 7 November 22 2016 Advectas Phone Overview of case studies 8 December 16 2016 Advectas Consultant 1 Skype Company D case 9 December 16 2016 Advectas Consultant 1 Skype Company B case 10 December 21 2016 Advectas Consultant 2 Skype Company A case 11 January 10 2017 Advectas Consultant 3 Skype Company E case 12 January 20 2017 Advectas Consultant 4 Skype Company Case