INTELLIGENT INSTRUMENT TO FACILITATE DECISION
MAKING IN THE EVALUATION OF SOIL RESISTANCE
TO ROOT PENETRATION
Ladislau Marcelino Rabello*; Paulo Estevão Cruvinel
Embrapa Instrumentação Agropecuária, R. XV de Novembro 1452, C.P. 741, 13560970 São Carlos, SP -Brasil.
*Corresponding author <[email protected]>
ABSTRACT: This contribution introduces an instrument for decision-making in agricultural processes based on the measurements and mapping of soil resistance to root penetration. Its development was based on a new and advanced instrumentation tool, enabling in almost real-time to acquire the necessary information for spatial variability analysis of plant root penetration resistance in soils, due to natural or artificial soil compaction processes, i.e., not only for an area of soil but also for a soil profile. The system allows soil resistance assays for both laboratory and agricultural fields. Moreover, the development focused on an intelligent instrumentation concept, as well as a microprobe (30º for the spire angle, 1,6 mm for the base diameter, and 30 mm of total length), with a strain-gage transducer sensor. Results have shown that measurements of soil resistance to plant root penetration can be performed up to the limit of (483.47 ± 0.69) N, with a resolution of 15.4 N. Additionally, the versatility of the system is verified for soil resistance data collection and its interpretation to root plant penetration, since they can be presented in table formats, one-dimensional graphs, two-dimensional and three-dimensional maps. Therefore, this system enables users to obtain a quick interpretation of the soil aggregation state in agricultural areas.
Key words: agricultural instrumentation, intelligent systems, signal processing, soil microprobe, soil penetrometer
INSTRUMENTAÇÃO INTELIGENTE PARA AUXILIO À TOMADA
DE DECISÃO NA AVALIAÇÃO DA RESISTÊNCIA DO SOLO
À PENETRAÇÃO DE RAÍZES
RESUMO: Neste trabalho é apresentado um instrumento para auxilio à tomada de decisão em processos que envolvem avaliações da resistência do solo à penetração de raízes. Seu desenvolvimento fundamenta-se na concepção de uma nova ferramenta instrumental avançada, que viabiliza em tempo quase real informações para análise da variabilidade espacial da resistência do solo à penetração de raízes, tanto para área como para perfil, devido aos processos de compactação natural ou artificial do solo. Ensaios para a medida da resistência do solo à penetração de raízes podem ser realizados tanto em ambiente laboratorial como diretamente em campo agrícola. Para o desenvolvimento utilizou-se o enfoque da instrumentação inteligente, bem como uma microsonda (ângulo de cone de 30º, diâmetro de base de 1,6 mm e comprimento total de 30 mm) sensoriada por célula de carga. Resultados mostram que medidas de resistência do solo à penetração de raízes podem ser realizadas até um limite de (483,47 ± 0,69) N com resolução de 15,4 N. Adicionalmente, a versatilidade do sistema é verificada para a coleta de dados e interpretação da resistência do solo à penetração de raízes, uma vez que podem ser apresentados na forma de tabelas, gráficos unidimensionais, mapas bidimensionais e mapas tridimensionais. Desta maneira, o sistema possibilita ao usuário uma rápida interpretação sobre o estado de agregação do solo em áreas de cultivo agrícolas.
Palavras-chave: instrumentação agropecuária, sistemas inteligentes, processamento de sinais, microsonda, penetrômetros
INTRODUCTION
The intensive use of soils, in large scale agricul-tural production, has generated a series of problems including the efficiency of the production capacity
Soil rigidity measurements stem from the force or resistance that the soil displays against the penetration of a metal probe, generally called penetrometer, (Bradford, 1986). Due to its dimensions, it does not have the necessary precision to measure the degree of soil crust compacting and the quantified force that a seed experiences during germination.Small probes have been used to simulate the penetration force of the roots (Taylor & Gardner, 1963, Barley et al., 1965, Waldron & Constantin, 1970, Groenevelt et al., 1984, Grant et al., 1985, Rolston et al., 1991), and also to character-ize soil structure in a laboratory setting.
In this study the evaluation of soil resistance to root penetration is given as a function of the agricultural field coordinates. Besides, based on a friendly com-putational interface, both 2D and 3D real time maps of soil resistance can be obtained, thereby assisting farmers to make decisions.
MATERIAL AND METHODS
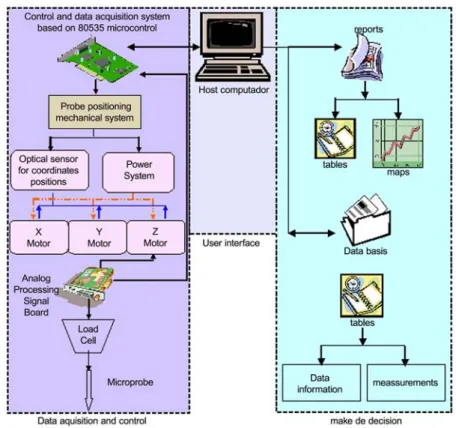
The developed system comprises a mechanical module and an automatic microcontrolled module, re-sponsible for the microprobe positioning control for the measurement of soil resistance to root penetra-tion, as well as a central computer responsible for the general management and interface with the user (Figure 1).
The interface with the user is performed by a com-puter program developed for the following function: communication between the control system and the data acquisition for the central computer to execute the tasks. These tasks consist in receiving the collected data of soil penetration resistance measurements and in organizing the data in a bank for future use.
Data interpretation is supplied to the user in the form of a report, consisting of tables and graphs of the measures in near real time, allowing also the inter-pretation of the data through charts in bi and tri-di-mensional format, which allows the interpretation of spatial and temporal variability of soil resistance to pen-etration of roots.
Microprobe
In the development of the microprobe, consider-ing not only the friction force of the components, but also the calculation of soil resistance to root penetra-tion due to soil parameters such as volumetric soil wa-ter content (θ), bulk density (ρs) and depth (D), and also considering factors such as the height of the metal microcone (hc) and the measurement of the shaft in-strument (ha), the goal was to discover the total me-chanical resistance that the soil offers to root penetra-tion (RSPrm). With addipenetra-tional informapenetra-tion on the nor-mal surface tension of the soil surface (σn), friction coefficient (μ), semi-angle of the cone point (α),
ditional tangential tension (ca) and (microcone) soil penetration resistance (RP), RSPrm is given by:
RSPrm = 6.98ρs2 + [(-1.62 10–1)+ (1.36 10–3) (ha+Rc(RP-σn/((μ.σn)+ca)))].ρs + [(1.98 10–1) - (9.20 10–3)(ha+Rc(RP-σn / ((μ.σn) + ca)))](θ.ρs) + (9.80 10–2) [ha + Rc(RP-σn/((μ.σn) + ca))]-(2.00 10–3)[ha + Rc
(RP-σn/((μ.σn)+ca)] 2
-(10.44 10–3) (1)
The microprobe was constructed based on de-scribed models, using a 1.6 10–3
m diameter and 0.2 m length tungsten rod, which resulted in a final probe of 57 10–3 m in length and a cone point angle of 30º. The microprobe is connected to the load cell through mechanical chuck, (Rabello, 2003).
Mechanical Module
The mechanical module is composed of a XYZ table for the spatial localization of the measurement probe of the mechanical resistance to soil penetration. The XYZ table is sustained by fuses and linear shafts of dislocation localized in a support over the support structure. The XYZ table has two position adjustments to set the sensor, a manual one, only in the direction of the axis X and an automatic one that identifies it at any coordinate inside the limits of the axis.
The support of the structure consists of a 1.13 m by 0.52 m rectangular aluminum frame, comprised by two perforated U shaped pieces of 1.016 m × 0.127 m × 0.0635 m and 0.109 m in length. These two per-forations are joined by two metal bars of 0.52 m × 0.12 m × 0.02 m. All of the suspension is sustained by three adjustable legs, with two at each frame ex-tremity and one that is centralized on the opposite side of the two to facilitate the entire leveling of the struc-ture. Inside the structure support, a base was mounted transversally, also made of aluminum, with dimensions of 0.50 m × 0.15 m × 0.075 m. This base is located inside the metal frame and is sustained by two linear shafts with a diameter of 0.02 m,
The microprobe sliding positioning system over the linear shaft is accomplished by using two 0.02 m lin-ear ball screw blin-earings. The system movement is pos-sible through a stepper motor mounted together with a ball screw that has 8 10–3 m per motor step and 0.018 m in diameter, that transfers the movement to a ball screw nut, which is 10–3
m long. The whole sys-tem provides an increase/decrease of 40 μm by the mo-tor step in the X direction. For system maintenance, a steering wheel was placed opposite to the motor to allow manual movement.
In the lower part of the microprobe positioning system, the whole system was mounted for the move-ment of the Y and Z axis. The movemove-ment in the direc-tion of Y is made over a linear guide, on a ball screw
bearing of step of 5 10–3 m and with a diameter of 14 10–3
m. The movement using the fuse is made with a ball screw nut of step 5 10–3 m, fixed on the other base that sustains the system movement of the Z axis. The movement in the direction of the Y axis is pos-sible by using a step motor located in one of the lin-ear guide extremities with an increase/decrease of 25
μm per motor step. Attached to the movement car of the Y axis is a third base that serves to sustain the whole system movement of the microprobe, which is mounted vertically.
The microprobe movement system comprises two aluminum tubes of different diameters; the internal tube has 50 10–3
m in diameter and the external 60 10–3
m, and allows the internal tube to move freely inside the external tube resembling a telescope. The movement takes place using a ball screw of step 5 10–3 m and diameter of 14 10–3
m, connected to a ball screw bear-ing of step 5 10–3 m, which is fastened to the internal tube. In the upper extremity, the ball screw bearing is connected to a step motor. This is responsible for the microprobe movement with an increase/decrease of 25
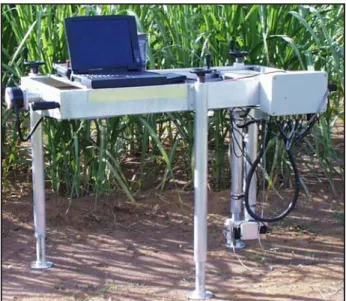
μm per motor step. A junction box is mounted at the extreme opposite to the motor and is composed of load cells, the microprobe and the load cell electric circuits of the conditioning signal. Figure 2 illustrates the field system.
Electronic Module
The electronic module is basically composed of: (i) a central micro-controlled unit mounted on a 80535 microcontroller; (ii) a power circuit unit used to feed and convert signals for the step motors; (iii) general
power supply; (iv) positioning systems, composed by step motors; (vi) load cells to operate the microprobe sensor; circuits for electrical signal processing; (vi) a central computer responsible for the system-user in-terface. The communication with the computer is made through a cable connected to a female DB9 con-nector, standard RS-232.
The power board circuit makes possible the con-version of digital signals in TTL level from the micro-processor circuit board to the necessary signal levels to control the step motor. Also, the X and Z step mo-tors have the following characteristics: a step angle of 1.8º, 200 steps per complete turn, 98 N.m of locking torque, 6 VDc per 3.1A and the number of wires equal to 6. The load cell has the following characteristics: 5.0 kg of capacity and a nominal signal of 2.0 mV/V.
Computational System
The computer program developed for the system is composed of two subprograms. One of them is resi-dent in the memory of the CPU 80535 program and its function is to receive commands from the external computer in order to execute microprobe positioning tasks. It also acquires data of the mechanical resis-tance of the penetration and then sends the collected data back to the external computer. The other subpro-gram is used for the interface with the user and in co-ordination with the user sends the commands to the 80535 microprocessor. It receives the collected data, organizes, processes and stores it in a data bank, gen-erating respective reports.
In the development of this program for the user interface, the application Win32 was used applying the development environment C++ Builder 5 by Borland. The data base implementation used the Borland Data Base Engine to generate the Paradox tables. This type of base has the advantage of foregoing a data-bank system manager but still keeping compatibility with a large range of applications. A practice known as Multithread is used within the capacity of the sys-tem Win32 to permit the same application to execute combined codes. The combined system is used to en-able monitoring the serial communication port in or-der to process and store the data received from the data base. The interface permits the user to directly access all the necessary commands to control the sys-tem. It can also visualize in nearly real-time the col-lected measurement data of soil resistance to root pen-etration in tables and two-dimensional graphs.
Computer program for 2D- and 3D- layer visual-ization of the soil resistance to root penetration
As an analysis tool, this program allows to read the data recorded in the data bases and from tables that have been created by a former discreet program.
Af-ter reading a specific data base or tables the 2D layer visualization tool converts the data into a two-dimen-sional map per penetration layer. It can visualize the forces of layer penetration in a standard 256 levels of gray.
The images generated from the data collection of the soil resistance to root penetration supplies two-di-mensional information by penetration layer of the mi-croprobe. For each analysis, there is a total of 66 sepa-rate maps of 0.1 10–3 m forthe first 40 measurements and 1.0 10–3 m for the remaining 26. In addition, it is possible to group these 2D maps in a three-dimensional subsurface layer perspective. The three-dimensional mapping is obtained by interpolating one or various lay-ers between the spaces of each layer.
The interpolation method consists of simulating in-termediate data from a known data base. For this pro-cess interpolation based on the B-Spline-Wavelets was used (Bradley, 1993); (Donoho, 1993); (Graps, 1995); (Revathy, 2000).
The relationship between the Wavelet Haar ψH and the function B-Spline of first order is represented by
N1:
ψH (x) = N1(2x) – N1 (2x – 1) (2)
and the relationship with the B-Spline of the second order N2 is given by:
ψH (x) = N2(2x) (3)
in this mode, the value of
N
m is given by equation (4):(4)
One can now take the function B-SplineL2 given by L2 (x) = N2(x + 1) where L is defined by eq. 5 in order m and with the sequence of coefficients
c
k such as:(5)
A basic Wavelet is defined as:
ψH (x) = L2(2x – 1) (6)
Following this development, one can obtain Wave-lets-Splines of superior order, or then, generate spaces of superior order by the relationship:
(7)
reso-lution analysis generated by the B-Spline of order m
and W belonging to that is the sequence of or-thogonal complementary Wavelet spaces.
The interpolation by B-Wavelets determines the in-termediate values between sequences of known points. Different from the estimate, the interpolation not only dislocates the generated curve under the influence of known points, but also makes this curve pass through these points.
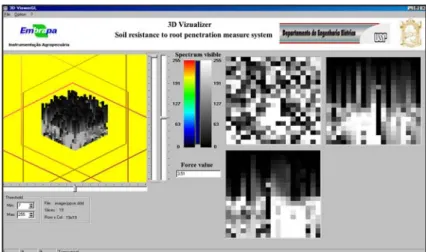
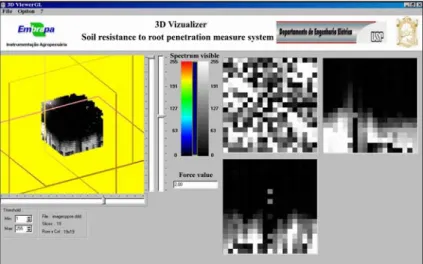
In the volumetric visual interface is an area re-served for the volumetric map visualization where are axes that by mouse movement, enable discerning the frontal, sagittal and transverse planes. Together with the volumetric visual area are three bars with a cur-sor that is used to move the X, Y, and Z axes to allow viewing the map cuts of the complementary window interface.
There are also data filters of the threshold that per-ceive the different values of the soil resistance to the root penetration within the chosen range and use the mouse to initiate rotations and translations above the body of X, Y, and Z axes in a way to see the recon-structed object from different angles.
There are two palettes in the middle of the inter-face; one is a colored spectrum and the other one is in tones of gray, called visible spectrum. In the middle of both ranges there is another one that is used to indicate to the user the threshold range that it intends to analyze in the data base image genera-tor. The color range as well as the tones of gray vary equally inside a scale of 0 to 255 levels. The volu-metric interface also represents a small menu that en-ables accessing the essential control commands in this interface.
Experimental planning to validate and error analysis
The measurement evaluation tests of soil resistance to root penetration were performed by calibrating the electric signals provided by the microprobe and sensed by a load cell using a 20 kg weighing scale in the range 0 to 5 kg.
The microprobe was set in the center of the cen-tral base of the weighing-machine, making afterwards the system to cause small advances of the microprobe against the scale balance, thereby constantly verifying the dislocation of the weight scale pointer in accor-dance to the exerted force. Each increment of the mi-croprobe corresponds to an increment of 0.10 kg, di-vided in the ranges of 0.0 to 1.0 kg; 1.0 to 2.0 kg; 2.0 to 3.0 kg; 3.0 to 4.0 kg and from 4.0 to 5.0 kg. The electric proportional analog signal responsible for the deflection of the weight scale pointer predicts the load cell; it was monitored by a 6 1/2 digit model 34401A, HP multi-gauge.
The measurement test was organized in two phases in the laboratory and one in the field. For the labora-tory trials, two samples were selected. One sample came from a single small soil sample and the other came from a soil block sample in order to measure the profile and spatial variability. To achieve the same objectives, an area was selected for the field tests.
The soil samples from the laboratory tests as well as those from the field were selected from an experi-mental field in São Carlos, SP, Brazil (21º58’ S, 47º50’ W).
The first sample was collected from a pasture area whose soil is a clayey-textured Hapludox. These samples were extracted using a sample cylinder of 72 10–3 m internal diameter and 54 10–3 m height, con-taining a soil mass of 403.73 g. The second group of trial samples was collected from an area of a Paleudalf. The samples were collected in blocks of 0.27 m × 0.27 m × 0.13 m.
Additionally, a third trial was planned with direct measurements under field conditions. The area pre-sents a medium-textured Hapludox located near a sug-arcane field.
RESULTS AND DISCUSSION
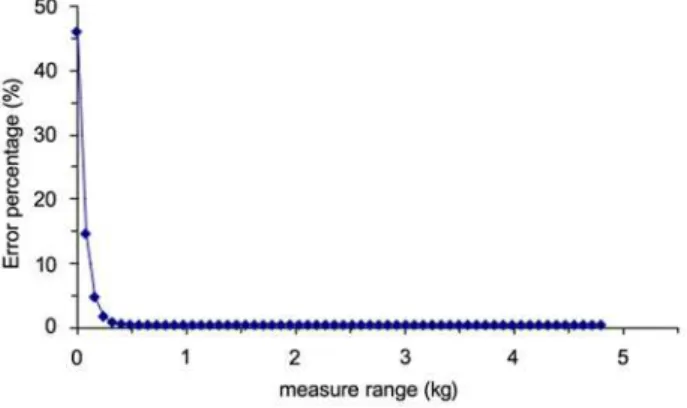
The percentage error of evaluation was estimated in the range of 0.0 kg to 5 kg (Figure 3). The per-centage of errors observed, taking into consideration the medium values presented, were respectively 28.9% for the range between 0.00 to 0.10 kg, 2.2% for 0.20 to 0.50 kg, and below 1% for 0.60 to 5.00 kg. The conversion of values was equal to or above 0.16 kg of the medium percentage error that was below 5%.
The first sample obtained with the sample cylinder was adjusted in the laboratory below the probe and commands of the data acquisition were supplied. Par-tial results of this measurement are illustrated in Fig-ures 4 and 5 with a respective interface showing the options for table or graph data instructions.
The system was positioned on a single point using the extremity of the block soil sample with coordinates X = 300 mm and Y = 50 mm, with increases in the directions X and Y of 10 mm, and final coordinates of X = 480 mm and Y = 230 mm, forming a mea-surement grid of 19 × 19, with 66 measurements per point. The trails with the soil block generated a data base with the dimension of 23,826 lines by six col-umns.
The view of the data of soil resistance to root pen-etration presented in the table format or one-dimen-sional graph is difficult given that the data base in-creases. In these situations, the generation of two-di-mensional maps can be a useful tool. The maps illus-trate the spatial variability of the soil resistance to root penetration at different depths of the test profiles (Fig-ure 6).
Starting with the two-dimensional maps, the volu-metric view of the soil block sample can be obtained
with an interpolation of the planned measurements (Figure 7), as well as the respective frontal, lateral and transversal cuts.
In the field tests the instrument was first lev-eled with the soil surface and then the following instrumentation was utilized: a 12 volt DC car bat-tery with electrical current capacity of 45 Ah, used to supplement the electric power of the measuring instrument as well as of the central computer which was a LapTop PC-Compatible, with a 486 micro-processor operating at 200 MHz, and 32 M bytes of RAM.
The data collection was conducted in a 0.27 m × 0.27 m area, with a distance variation of 0.015 m be-tween them. The starting coordinates supplied by the system are indicated in Table 1. The quantity of data generated with this base of coordinates corresponds to a matrix that is 19 × 19 points by 66 levels of depth and that requires a total of 23826 registers. With the Figure 4 - Interface showing the options of data presentation in the table function.
Table 1 - Field Trail - RSPR Measurement Coordinates
s e t a n i d r o o c t r a t
S Endcoordinates Increase
) m m (
X Y(mm) X(mm) Y(mm) X(mm) Y(mm)
0 0 270 270 15 15
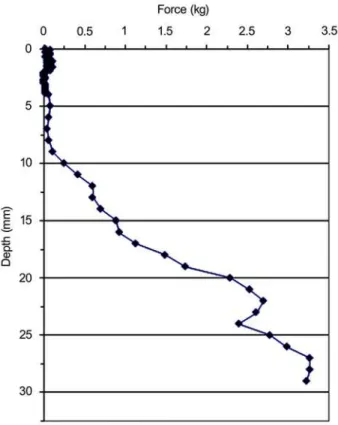
purpose of characterizing the field tests and due to a great number of data, the following coordinates were selected: X = 255 and Y = 105, in order to verify the soil resistance of the root penetration as represented in Figure 8.
For some depths, the force is equal to 0.0 N, even for the readings conducted in the laboratory. This is due to the fact that the microprobe finds empty regions inside the sample. This occurs, for example, due to the presence of internal cracks or holes left by decomposed root material, ants, or other possible species of insects, or plants or natural pores.The sequence of representative two-dimen-sional maps generated in the tests can be observed in Figure 9.
For the test starting at the depth z = 5.0 mm, the beginning of a formation of a greater resistance area at the onset of the microprobe was observed, which could also represent plant roots.
The soil characteristics of the areas where the measurements were carried out have soil bulk den-sities according to the depth (Table 2). The volu-metric soil resistance to root penetration obtained in the field test by two-dimensional maps and their frontal, sagittal and transverse planes, is shown in Figure 10.
FINAL REMARKS
The interface with the user is a user-friendly and viable tool for the analyses of soil resistance to root penetration as it can be seen in tables, graphs, or two-dimensional and three-two-dimensional maps. It facilitates trial reports.
The linearity of the conversion process had a low error rate observed in the long-term. Thais involves the linearity of the tension relationship read as the du-ration of the mechanical force applied to the charge cell and the measurement of the soil resistance to pen-etration. In line with this perspective, the conversion values were equal to or above 0.16 kg of the error per-centage. The average remained below 5%. The instru-ment resolution is therefore characterized by 0.16 kg (15.4 N).
Figure 6 - Visualization of the soil resistance to root penetration in a layer depth of 14.0 mm.
The average error percentage was 28.9% as found during the evaluation of the electronic perfection be-tween the range of 0 to 0.10 kg. This is attributed to the signal/noise of the operational amplifiers LM725 that are responsible for the adequate amplifier signal of the Wheatstone bridge in coordination with the load cell of the microprobe.
The instrument raises the level of variation flex-ibility of soil resistance to root penetration in a soil profile considering the location of the coordinates (x,y). Results are obtained in nearly real time in the form of a table or a graph as well as reports avail-able on standard paper.
The generation of two-dimensional RSPR × Po-sition maps showing the data depth demonstrates the potential of the system in evaluating soil re-sistance to root penetration in an environment that involves spatial variability, as well as making de-cisions based on the concept of agricultural pre-cision. This potential can be seen for the soil pro-file, for laboratory samples, especially as a tool to facilitate decision making, taking into consid-eration real aspects of the heterogeneity, or the lack of it in case of soil samples that are not de-formed.
The generation of RSPR × Position × Depth three-dimensional maps also demonstrates the
Table 2 - Soil density as function of the depth in the profile for the case study
V e K 0 6 t a t n e i c i f f e o c n o i t a u n e t t a r a e n i
L 0.296cm–1 r e b m u n r e n i a t n o
C 1.00
s s e n k c i h t e l p m a
S 6.78cm
e m i t n o i t i s i u q c a a t a
D 90seconds
h t g n e l e l p m a
S 5.00cm
p e t s s t n e m e r u s a e
M 0.50cm
n o i t i t e p e R 1 < e r u t s i o m l i o
S θ> 9.83%
n o i t a c o
L Density
m
c gcm–3
0 .
0 0.979
5 .
0 1.194
0 .
1 1.287
5 .
1 1.256
0 .
2 1.258
5 .
2 1.212
0 .
3 1.176
5 .
3 1.273
0 .
4 1.223
5 .
4 1.224
potential of the system for the evaluation of soil resistance to root penetration in a field environ-ment.
The option to use the Thread showed to be suit-able for the application of Win32. By using an effi-cient synchronized system, even accessing critical areas of memory, the stability, repeatability and op-erational reliability of the system is guaranteed. The integration of the programming system with its dif-ferent parts involves a control algorithm of the mi-cro controller 80535 and the Win32 application. The use of Win32 enabled executing the necessary work of the instrument functions for soil resistance of root penetration measurements and visualization.
The present development of an instrument to fa-cilitate decision making in processes that involve the evaluation of soil resistance to root penetration, con-stitutes a new and advanced tool that allows the analyses in nearly real time, including programming, spatial variability information as well as soil com-paction observed in a natural or artificial laboratory environment, or directly in the field.
The results of the use of this instrument reduce the uncertainty of the measurement methods with respect to soil resistance to root penetration. This, therefore, is fundamentally important in optimizing risks in agricultural processes.
REFERENCES
BARLEY, K.P.; FARRELL, D.A.; GREACEN, E.L. The influence of soil strength on the penetration of a loam by plant roots. Journal of Soil Research, v.3, p.69-79, 1965.
BRADFORD, J.M. Penetrability. In: KLUTE, A. (Ed.) Methods of soil analysis: physical and mineralogical methods. 2 ed. Madison: American Society of Agronomy, 1986. p.463-478. (Agronomy, 9).
BRADLEY, R.A.; DI CHRO, G. The FBI wavelet/scalar quantization standard for gray-scale fingerprint image compression. Los Alamos: Los Alamos National Lab, 1993. (Tech Report LA-UR-93-659).
CLIVATI-McINTYRE, A.A.; McCOY, E.L. Fractional Brownian description of aggregate surfaces within undisturbed soil samples using penetration resistance measurements. Soil and Tillage Research, v.88, p.144-152, 2006.
DONOHO, D. Nonlinear Wavelet Method for Recovery Signal, Densities and Spectra form Indirect and Noisy Data. In: D A U B E C H I E S , I . ( E d . ) Different perspectives on wavelets. Providence: American Mathematical Society, 1993. p.173-205. (Proceeding of Symposia in Applied Mathematics, v. 4 7 ).
DULEY, F.L. Surface factors affecting the rate of intake of water by soils. Proceedings of Soil Science Society of America, v.4, p.60-64, 1939.
GRANT, C.D.; KAY, P.H.; GROENEVELT, P.H.; KIDD, G.E. Spectral analysis of micropenetrometer data to characterize soil structure. Canadian Journal of Soil Science, v.65, p.789-804, 1985.
GRAPS, A. An introduction to Wavelets. IEEE Computacional Science and Engineering, v.2, p.50-61,1995.
GROENEVELT, P.H.; KAY, B.D.; GRANT, C.D. Physical assessment of soil with respect to rooting potential. Geoderma, v.34, p.101-114, 1984.
HANKS, R.J.; THORP, F.C. Seedling emergence of wheat, as related to soil moisture content, bulk density, oxigen diffusion rate, and crust strength. Proceedings of Soil Science Society of America, v.20, p.307-310, 1956.
LINS E SILVA, M.L. Modelagem matemática na estimativa da densidade de um latossolo Vermelho escuro textur argilosa, pelo índice de cone. Campinas: Unicamp, 1999. 161 p. Tese (Doutorado).
LIU, Z.; SHI, B.; SHENG, D. A micropenetrometer for detecting structural strength inside soft soils. Geotechnical Testing Journal, v.29, p.443-450, 2006.
Figure 9 - Representative sequence of two-dimensional maps of the measurement of soil resistance to root penetration for the collected data with Z=0.0 mm, Z=9.0 mm, Z=17.0 mm, Z=22.0 mm, and Z=29.0 mm.
MORIN, J.; BENYAMINI, Y.; MICHAELI, A. The effect of rain-drop impact on the dynamics of soil surface crusting and water movement in the profile. Journal of Hydrology, v.52, p.321-335, 1981.
RABELLO, L.M. Instrumentação avançada para tomada de decisão na avaliação da resistência do solo à penetração de raízes. São Carlos: USP/EESC, 2003. 184p. Tese (Doutorado).
REVATHY, K.; RAJU, G.; PRABHAKARAN, S.R.N. Image zooming by wavelets. Fractals, v.8, p.247-253, 2000.
ROLSTON, D.E.; BEDAIWY, N.A.; LOUIE, D.T. Micropenetrometerfor for in situ measurement of soil surface strength. Journal of Soil Science Society of America, v.55, p.481-485, 1991.
TAYLOR, H.M.; GARDNER, H.R. Penetration of cotton seedling taproots as influenced by bulk density, moisture content, and strength of soil. Soil Science, v.96, p.153-156, 1963. WALDRON, L.J.; COSNTANTIN, G.K. Soil resistance to a slowly
moving penetrometer. Soil science, v.109, p.221-226, 1970.