In the last four decades forest heterogeneity and habitat structure has been suggested to play a key role in structuring avian communities (MACARTHUR et al. 1966, KARR & FREEMARK 1983). Some components of habitat structure or floristic com-position may determine availability of food, nesting sites, or refuge from predators, and habitat features are considered to be crucial components of birds’ niches (PIANKA 1974, WIENSet
al. 1987). Although the effects of habitat heterogeneity on bird populations and communities have received far more atten-tion in temperate regions than in the tropics (REY 1995 but see CINTRAetal. 2006, CINTRA & CANCELLI 2008, BANKS-LEITE & CINTRA 2008), understanding how the structure of tropical forests vary is important to describe the bird assemblages associated to them, and to identify the mechanisms that allow high species coex-istence. Tropical forests, however, are a complex environment and detecting exactly what components of the vegetation af-fect bird distribution and abundance is not trivial.
Human-made disturbed forests are a good example of the importance of forest structure on birds. It has been showed that selective logging produce strong negative effects on the vegeta-tion structure, by reducing or increasing tree density, foliage volume, number of dead trees, amount of leaf litter, and canopy
openness (NEPSTADetal. 1999). Therefore, it is very likely that changes in bird species richness and abundance in disturbed forests are mainly due to changes in some vegetation compo-nents, which could affect the availability of food resource and forest microclimatic conditions (JOHNS 1991, GUILHERME & CINTRA 2001, BARLOWetal. 2006). Even primary forests also show a rela-tively high degree of environmental heterogeneity. The role of this heterogeneity is mostly unexplored, but can also affect the abundance and occurrence of birds and explain why there is such high bird diversity in a given area.
Top predators, such as raptors, are relatively rare in ter-restrial bird communities and are dependent on some compo-nents of the habitats for their breeding activities (THROSTROMet
al. 2000). Nesting habitats and the number of available prey has been demonstrated to affect population density of some raptor species (NEWTONetal. 1977, VAN DAELE & VAN DAELE 1982). Earlier studies have shown, for instance, that cavities in trees can reduce predation and mortality of young raptors (BULLet
al. 1989, BELTHOFF & RITCHINSON 1990). For the spotted owl Strix
occidentalis, nest site location and selection are also related to forest structure, since the mean diameter of trees is greater in nesting sites than in random sites (HERSHEYetal. 1998).
Addi-species (Aves: Strigidae) in the Central Amazon forest
Obed G. Barros
1& Renato Cintra
1, 21 Instituto Nacional de Pesquisas da Amazônia. Caixa Postal 478, 69011-970 Manaus, Amazonas, Brasil. 2 Corresponding author. E-mail: cintra@inpa.gov.br
ABSTRACT. We investigated how forest structure affects the occurrence and abundance of three owl species: the crested owl Lophostrixcristata Daudin, 1800, the Amazon pygmy owl Glaucidiumhardyi Vielliard, 1990, and the tawny-bellied screech owl Megascopswatsonii Cassin, 1849. We surveyed the owls mostly between 07:00 and 11:00 pm from July 2001 to April 2002, in eighteen 8 km transects along trails at the Ducke Reserve, Manaus, Central Amazon, Brazil. We staked out 50 x 50 m plots where the presence and absence of the owls were recorded. We compared some compo-nents of the forest structure between plots where owls were present and plots where they were absent. The spatial variation in these components were related to the occurrence and abundance of the owls using models of multiple logistic and multiple linear regressions analysis, respectively. Lophostrixcristata is rare in many other areas of the Amazon forest, but it was the most abundant in our study area. Lophostrixcristata and G.hardyi were more concentrated along the uplands (central plateau), which divide the reserve into two drainage water-basins. Megascopswatsonii was distrib-uted mainly in the southeastern part of the reserve. Glaucidiumhardyi was more often found in areas with larger canopy openness. In areas with higher abundance of snags, there was significantly higher occurrence of L.cristata and M. watsonii. Megascopswatsonii was also more abundant in areas with higher abundance of forest trees and in areas bearing shallower leaf litter on the forest floor. This study is the first to analyze at large spatial scale the effects of forest structure on neotropical forest top predator nocturnal birds. The results indicate that forest structure can affect the occurrence and abundance of owls in the Amazon forest.
tionally, owls also use dense vegetation to rest during the warm and hot days (BARROWS 1981, SWENGEL & SWENGEL 1992) and to hide from their own predators. Finally, owls use vision more than audition to capture their prey (MARKS etal. 1999) and, therefore, in places where the forest canopy is less dense, more light penetrates to the dark understory, increasing the success of owls in locating and capturing their prey (CALLetal. 1992). In the Amazon forest, studies on the effects of forest struc-ture on the distribution and abundance of owls are still scarce. Although basic information on owl species and their habitats are available in few studies (BORGESal. 2004, CINTRAetal. 2007) and in some very useful local bird lists (e.g. WILLIS 1977, TERBORGHetal. 1984, SERVAT 1996, ZIMMERetal. 1997, COHN-HAFTetal. 1997, BORGES 2003), none of these studies include information on how habitat structure affects owl occurrence and abundance. To our knowl-edge, therefore, the present study is the first to analyze the effects of the Amazon forest structure on owls in a large spatial scale. We investigated how the forest environmental heterogeneity created by the variation in some forest structure components affect the occurrence and abundance of the following three owl species: the crested owl Lophostrixcristata Daudin, 1800, the Amazon pygmy owl Glaucidiumhardyi Vielliard, 1990, and the tawny-bel-lied screech owl Megascopswatsonii Cassin, 1849. More specifi-cally, we tested the effects of forest structural components on owl occurrence and abundance in a pristine Central Amazon forest.
MATERIAL AND METHODS
This study was conducted in the Ducke Reserve, near Manaus (02º55’-03º01’S, 59º53’-59º59’W), Amazonas state, Bra-zil. The reserve has an area of 10,000 hectares, and the mean annual rainfall in the area is 2,286 mm. Most of the rains are concentrated between November and May, and the dry season is between June and October. The soil is mainly oxysol, and small streams are abundant in the area, resulting in a rugged terrain of lowlands intercalated with plateaus reaching an altitude of up to 140 m (RIBEIROet al. 1999). There is a large plateau in the middle of the reserve separating two drainage water-basins, one of black water on the west side, and transparent clear water on the east side (RIBEIROetal. 1999). The vegetation of the area is mainly primary terrafirme forest (RIBEIROetal. 1999). The reserve is connected to a continuous forest on the east side.
We surveyed the owls by walking slowly (1.5 km/h) and quietly along 18 transects, which were parallel 8 km trails, 1 km apart from one another, nine running east-west and nine north-south, located on a trail grid which covers 6,400 ha of the re-serve. All trails are numbered and marked every 100 m. We con-ducted night surveys for the following species: the crested owl
Lophostrixcristata, the Amazon pygmy owl Glaucidiumhardyi, and the tawny-bellied screech owl Megascopswatsonii. Lophostrix cristata is widely distributed in the Americas and probably in the Amazon forest, whereas G.hardyi and M.Watsonii are widely distributed in the Amazon forest (HILTY 2003).
Methods based on vocalizations have been widely used to
estimate occurrence and density of nocturnal raptors, and re-cording their vocalizations has been the most accurate way of detecting them (SPRINGER 1978, ROCHA & RANGEL-SALAZAR 2001). We decided to use a mix of point count and spot mapping tech-niques, recording owl positions by their vocalizations instead of using playback. These procedures were adopted to reduce the chances of recording the same individuals twice, which would overestimate their density. The surveys were done between July of 2001 and April of 2002, during two weeks a month, mostly under open sky conditions and half to full moon. We did some preliminary surveys that indicated that owls were apparently more active and vocalizing during these two phases of the moon. We spent two weeks a month doing surveys to record the owls, walking 4 km every night from 07:00 to 11:00 pm, and covering all 18 transects in the trail grid (see Fig. 1).
During the surveys, we stopped for two minutes every 100 m along transects to listen, locate, identify and record all owls heard within 50 m on either side of the transects. For each owl detected, we recorded the following information: date and hour, owl species, trail number, and owl position along the trail. Sometimes in the same night and sometimes in the following week while passing through to surveys further blocks, we revisited those 50 x 50 m plots where no owls were detected at least twice to listen and check whether any owls were present. Our index of owl abundance represented the total number of individuals recorded for each species.
and converting the distances according to the map scale. Only streams larger than 1 m in width were considered, because the forest is open enough at their banks to permit owls to use or fly
along them. Data on altitude were obtained when the trails were open in 1997, and from topographic cotes recorded by a topo-graphic team using theodolite and clinometer.
Figures 1-3. Occurrence of individuals of three owl species: (1) the crested owl L.cristata; (2) the Amazon pygmy owl G.hardyi; (3) the tawny-belied owl M. watsonii. Each bird recorded represented by a filled circle along the trail system of Reserva Ducke, Brazilian Amazon.
3
The leaf litter depth was recorded by inserting a knife blade on the forest floor and counting the number of impaled dead leaves. We recorded the leaf litter layers at the four cor-ners and the center of twenty-one 1 m2 subplots located 10 m equidistant from one another. Twenty subplots were distrib-uted along the sides, and one was at the center of each 50 x 50 m plot. For the analysis, we used mean values of leaf litter depth per 50 x 50 m plot.
To record variations in the canopy opening, we used a spherical crown densiometer (concave, mode C – Robert E. Lemonn, Forest Densiometer, 5733 SE Cornell Dr. – Bartlesvile, OK, USA). We registered canopy opening four times (one in each direction of the four cardinal points) in each corner and at the center of the 50 x 50 m plots. The raw values recorded in the field were then multiplied by 1.04, as recommended in the technical guide of the spherical crown densiometer. In the analysis, we used the mean values of the percentage of canopy opening per plot.
In the 50 x 50 m plots, we counted all forest logs on the forest floor, which were longer than 1 m and with diameters greater than 20 cm. The total number of logs recorded per plot represented an index of forest log abundance in the analysis. All snags with diameter at breast height (DBH) above 20 cm were counted inside the 50 x 50 m plots. For the analysis, the total number of snags/plot was used as an index of snag abun-dance. All trees with DBH greater than 15 cm were counted in the 50 x 50 m plots. The reason for measuring only trees with diameter at breast height above 15 cm is that they are large enough for owls to perch, rest or nest. In the analysis, the total number of trees/plot was used as an index of tree abundance. For each owl species, we ran Pearson correlation matrix analysis to test for correlations among the forest structure com-ponents (independent variables). The effects of the forest struc-ture components on the occurrence of owls were evaluated with
models of logistic regression using the SYSTAT 8.0 program (WILKINSON 1998). This analysis is indicated in cases where the dependent variable is categorical (owls present = 1 and absent = 0). For this part of the analysis we have included all 60 records of two owl species (Lophostrix and Glaucidium) and 30 records of the other species (Megascops). To analyze the effects of each forest structure component on the abundance of each owl species, we constructed multiple linear regression models, also using the SYSTAT 8.0 pro-gram (WILKINSON 1998). Only those 8 km transects which have minimum of one owl were included in the analysis, therefore 16 transects were considered for Lophostrix and Megascops and 17 transects for Glaucidium. To verify potential problems of residual analysis in multiple regressions we used a graphic method called partial residual plot, available in the statistical program “R”. The same program was also used to evaluate multicolinearity. There-fore, to verify possible linear relationships among predicting vari-ables, we estimated the variance inflation factor which calculates the level of multicolinearity (FOX 2002).
RESULTS
Variation in the forest structure components
The mean abundance of forest trees (> 10 cm DAP) was 135.3 (range 62-235), the mean abundance of logs was 11 (range 3 - 38), and the mean abundance of snags was 5.1 (range 0-11). The leaf litter depth ranged from 1.4 to 4.8 layers, and the mean was 3.4 layers. The mean percentage of canopy opening was 9.3% (range 2.6-19.4%). The mean altitude was 75.6 m (range 38.7-114.7 m). The mean distance to the nearest stream was 209.2 m (range 0 – 571 m). The results of the correlation among all of these variables are presented separately for each owl species in tables I, II, and III, and those significantly correlated were not included together in the same regression models (see below).
Table I. (A) Pearson correlation matrix for the forest structure components recorded in areas with L.cristata along the 18 transects of 8 km length at Ducke Reserve, Central Amazon. (B) Pearson correlation matrix for the forest structure components recorded in 120 areas, 60 of them with and 60 without L. cristata (see methods).
Abundance of trees
Abundance of logs
Abundance
of snags Leaf litter depth
Canopy opening (%)
Altitude (m)
A
Abundance of logs -0.376 **
Abundance of snags 0.273 -0.146
Leaf litter depth -0.250 0.106 -0.328 *
Canopy opening -0.217 0.322 -0.255 -0.107
Altitude 0.187 -0.082 0.136 0.059 -0.128
Distance to the nearest stream 0.046 0.069 -0.019 0.139 0.005 0.502
B
Abundance of logs -0.381**
Abundance of snags 0.225 -0.126
Leaf litter depth -0.169 0.085 -0.315*
Canopy opening -0.167 0.348** -0.286* -0.027
Altitude 0.168 -0.060 0.257 -0.031 -0.181
Table II. (A) Pearson correlation matrix for the forest structure components recorded in areas with G.hardyi along the 18 transects of 8 km length at Ducke Reserve, Central Amazon. (B) Pearson correlation matrix for the forest structure components recorded in 120 areas, 60 of them with and 60 without G. hardyi (see methods).
Abundance of trees
Abundance of logs
Abundance
of snags Leaf litter depth
Canopy opening (%)
Altitude (m)
A
Abundance of logs -0.405*
Abundance of snags 0.364 * -0.144
Leaf litter depth -0.198 0.018 -0.099
Canopy opening -0.231 0.280 -0.460 ** -0.100
Altitude 0.192 0.010 0.403 ** -0.193 -0.092
Distance to the nearest stream 0.234 0.004 0.218 0.057 -0.023 0.361*
B
Abundance of logs -0.371
Abundance of snags 0.224** -0.065
Leaf litter depth -0.064 -0.012 -0.126
Canopy opening -0.168 0.256 -0.430** -0.066
Altitude 0.122 -0.061 0.351** -0.148 -0.101
Distance to the nearest stream 0.131 -0.020 0.207 0.111 -0.070 0.414** * = p < 0.05, ** = p < 0.001 resulting from the Bonferroni probability matrix.
Table III. (A) Pearson correlation matrix for the forest structure components recorded in areas with M.watsonii along the 18 transects of 8 km length at Ducke Reserve, Central Amazon. (B) Pearson correlation matrix for the forest structure components recorded in 120 areas, 60 of them with and 60 without M. watsonii (see methods).
Abundance of trees
Abundance of logs
Abundance
of snags Leaf litter depth
Canopy opening (%)
Altitude (m) A Abundance of logs -0.199
Abundance of snags 0.337 0.097
Leaf litter depth -0.405 * 0.127 -0.459 **
Canopy opening -0.126 0.369 -0.368 0.245
Altitude 0.090 -0.230 0.303 -0.175 -0.451 **
Distance to the nearest stream 0.070 0.021 0.062 0.216 -0.090 0.359 B Abundance of logs -0.250
Abundance of snags 0.242 0.111
Leaf litter depth -0.367 0.197 -0.443**
Canopy opening -0.167 0.386* -0.405* 0.325
Altitude 0.128 -0.253 0.333 -0.263 -0.487**
Distance to the nearest stream 0.174 0.048 0.049 0.221 -0.108 0.390* * = p < 0.05, ** = p < 0.001 resulting from the Bonferroni probability matrix.
Effects of forest structure on the occurrence and
abundance of
L.
cristata
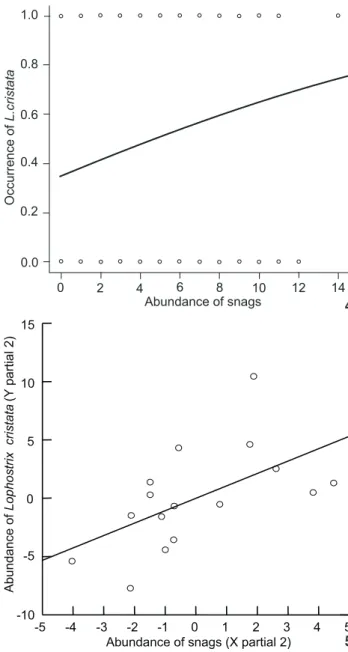
Lophostrixcristata was widely distributed in the reserve and throughout most of the eighteen 8 km transects (Fig. 1, Tab. IV). Most of the individuals occurred in the northeastern (33% in the Tinga drainage water-basin) and southwestern (29% in the Bolivia drainage water-basin) parts of the reserve (Fig. 1). The occurrence of L.cristata was significantly affected by the abun-dance of snags and not significantly affected by the rest of the forest structure components (Fig. 4, Tab. V). The abundance of forest trees was significantly correlated to the abundance of logs (see Tab. I), thus these variables were not included in the same
regression model together with the others forest components. We then run a separated analysis for the abundance of forest trees and found out no significant effects of this variable on L. cristata occurrence (simple logistic regression, MacFadden’s Rho-squared 2 = 0.0009, N = 120, T = -1.231, p = 0.218).
Abundance of snags 0.0
0 2 4 6 8 10 12 14
0.2 0.4 0.6 0.8 1.0
Occurrence
of
L.crist
at
a
abundance of forest trees was significantly correlated to abun-dance of logs (Tab. I). We then run a separated analysis for the abundance of forest trees and found out no significant effects of this variable on L.cristata abundance (simple linear regression, r2 = 0.0001, N = 16, F
1,14 = 0.001, p = 0.992).
Effects of forest structure on occurrence and
abundance of
G.
hardyi
Glaucidiumhardyi also showed ample spatial distribution in the Ducke Reserve (Fig. 2). The occurrence of G.hardyi was not significantly affected by the abundance of snags, distance to the nearest forest stream, abundance of forest logs, leaf lit-ter depth, and altitude (Tab. VI). However, there was a positive and significant relationship between the occurrence of G.hardyi
and the canopy opening (Fig. 6 and Tab. VI). The abundance of forest trees was significantly correlated to abundance of logs and abundance of snags (see Tab. II), therefore, it was not in-cluded in the same regression model together with the others forest components. We then run a separated analysis for the abundance of forest trees and found out no significant effects of this variable on G. hardyi occurrence (simple logistic regres-sion, MacFadden’s Rho-squared 2 = 0.0001, N = 60, T = -0.068, p = 0.946).
We recorded 93 individuals of G. hardyi along the eigh-teen 8 km transects in the reserve, and the abundance ranged from 0 to 11 individuals in each 8 km transect (N = 17). None of the forest structure components have significantly affected
the abundance of the G. hardyi (Tab. VI). Because the indepen-dent variables tree abundance and distance to the nearest stream were significantly correlated with the others as showed by the results of Pearson correlation matrix (Tab. II), we used them in Figures 4-5. (4) Descriptive curve generated by the logistic regression showing the relationship between L. cristata occurrence and abundance of snags (the results corresponds to that in table V). (5) Partial of multiple linear regressions on L.cristata abundance in relation to the abundance of snags. Some numbers in the axes are negative because the partial regression represents the deviation of the expected results if all the other independent variables are kept constant in their observed means. We presented graphs only for those forest components that had significant effects on bird abundance.
4
5
Table IV. Abundance of owls surveyed along the eighteen 8 km transects at Ducke Reserve, central Amazon.
Transect Owl species Total
L. cristata G. hardyi M. watsonii
T1 6 4 2 12
T2 9 5 1 15
T3 4 2 2 8
T4 7 5 2 14
T5 13 9 2 24
T6 22 9 8 39
T7 11 4 3 18
T8 11 7 4 22
T9 0 1 2 3
T10 0 3 2 5
T11 8 11 1 20
T12 10 10 2 22
T13 6 2 2 10
T14 9 5 3 18
T15 13 3 4 20
T16 11 7 8 26
T17 5 6 6 17
Figure 6. Descriptive curve generated by the logistic regression showing the relationship between G.hardyi occurrence and canopy opening (the results corresponds to that in table VI).
two separated simple linear regression models to evaluate their effects on G.hardyi abundance. None of them influenced the abundance of G.hardyi (tree abundance, r2 = 0.171, N = 17, p = 0.099; distance to the nearest stream, r2 = 0.057, N = 16, p = 0.356).
Effects of forest structure on the occurrence and
abundance
M.
watsonii
Most of the 54 individuals of M.watsonii (53%) were re-corded in the southeastern part of the reserve, which corresponds to the area of Ipiranga water-basin drainage (Fig. 3). Since the independent variable leaf litter depth was significantly corre-lated to abundance of forest trees and abundance of snags, and altitude was correlated to forest canopy opening (Tab. III), their effects on M.watsonii occurrence were analyzed in two separate models (see below). The occurrence of M.watsonii was not sig-nificantly affected by the abundance of snags, the abundance of trees, the canopy opening, abundance of forest logs, distance to nearest forest stream (Tab. VII). Note that for this owl species tree abundance and distance to nearest forest stream were not significantly correlated (see Tab. III). Therefore, these variables were included together in the same regression model. However, leaf litter depth was correlated with abundance of trees and snags, and altitude was correlated to forest canopy opening (see Tab. III). Therefore we used leaf litter depth and altitude in separated models, and found out that the occurrence of M.watsonii was not significantly affected by the canopy opening (2 = 0.006, N = 30, T = -0.691, p = 0.490) and altitude (2 = 0.001, N = 30, T = -0.200, p = 0.842). The abundance of M. watsonii ranged from 0 to 8 individuals in each 8 km transect (N = 16). Leaf litter depth was significantly correlated to abundance of forest trees and snags, so it was altitude correlated to canopy opening (Tab. III), they were not included in the same regression models with the others forest components (Tab. VII). There were positive
rela-20
10 30
Canopy opening 0.0
0.2 0.4 0.6
Occurrence
of
Glaucidium
hardyi 0.8 1.0
40 50
Table V. Results of the multiple logistic regression for frequency of use (occurrence) of different sites in the forest by L.cristata (categorical variable 0 = owl absent, 1 = owl present) and results of the multiple linear regression for owl's abundance in relation to the forest structure components and features of landscape.
Occurrence 2 N T p
Model 1
Abundance of trees 0.027 120 -0.205 0.838
Abundance of snags 0.027 120 1.959 0.050
Distance to the nearest stream 0.027 120 0.659 0.510
Model 2
Leaf litter depth 0.021 120 -0.809 0.419
Canopy opening 0.021 120 -1.046 0.296
Altitude 0.021 120 1.099 0.272
Abundance R2 N T p
Model 1
Canopy opening 0.318 16 0.629 0.540
Abundance of snags 0.318 16 2.459 0.029
Model 2
Abundance of logs 0.248 16 0.530 0.606
Leaf litter depth 0.248 16 -1.200 0.255
Distance to the nearest stream 0.248 16 0.609 0.555
tionships between the abundance of M.watsonii and the abun-dance of snags and abunabun-dance of forest trees (Fig. 7 and Tab. VII). There was also a negative relationship between the abun-dance of M.watsonii and the leaf litter depth (Fig. 7 and Tab.
VII). However, the abundance of M.watsonii was not affected by the canopy opening, abundance of logs, and proximity of streams (Tab. VII). Finally the abundance of M.watsonii was influenced by altitude (r2 = 0.209, N = 16, F = 4.240, p = 0.05).
Table VI. Results of the multiple logistic regression for frequency of use (occurrence) of different sites in the forest by G.hardyi (categorical variable 0 = owl absent, 1 = owl present) and results of the multiple linear regression for owl's abundance in relation to the forest structure components and features of landscape.
Occurrence r2 N T p
Model 1
Abundance of trees 0.041 60 0.344 0.731
Abundance of snags 0.041 60 0.175 0.861
Leaf litter depth 0.041 60 0.120 0.904
Canopy opening 0.041 60 2.073 0.038
Distance to the nearest stream 0.041 60 0.094 0.925
Model 2
Abundance of logs 0.007 60 -0.781 0.435
Altitude 0.007 60 -0.244 0.808
Abundance R2 N T p
Model 1
Abundance of snags 0.128 17 0.719 0.484
Canopy opening 0.128 17 1.215 0.244
Model 2
Abundance of logs 0.169 17 -1.271 0.228
Leaf litter depth 0.169 17 -0.484 0.637
Altitude 0.169 17 -0.543 0.597
Table VII. Results of the multiple logistic regression for frequency of use (occurrence) of different sites in the forest by M.watsonii (categorical variable 0 = owl absent, 1 = owl present) and results of the multiple linear regression for owl's abundance in relation to the forest structure components and features of landscape.
Occurrence 2 N T p
Model 1
Abundance of trees 0.037 30 0.203 0.839
Abundance of logs 0.037 30 -0.301 0.764
Abundance of snags 0.037 30 1.236 0.216
Leaf litter depth 0.037 30 -0.179 0.858
Distance to the nearest stream 0.037 30 -0.439 0.661
Abundance R2 N T p
Model 1
Abundance of snags 0.701 17 3.018 0.013
Abundance of trees 0.701 17 -2.185 0.054
Canopy opening 0.701 17 -1.639 0.132
Model 2
Abundance of logs 0.442 17 -0.828 0.425
Distance to the nearest stream 0.442 17 0.788 0.448
DISCUSSION
The results of this study indicate that the environmental heterogeneity produced by isolated or combined effects of for-est structural components can influence the occurrence and abundance of some owl species in Central Amazon forest. How-ever, not all owl species were affected in the same way. The crested owl Lophostrixcristata occurrence was affected only by the abundance of snags, the Amazon pygmy owl Glaucidium hardyi occurrence was affected by the canopy opening, and M. watsonii abundance was affected by snag abundance, forest tree abundance, and leaf litter depth (Tabs V-VII, Figs 4-7). On a larger spatial scale, the relief seems to be important for owl occurrence and abundance. Both L.cristata and G.hardyi oc-curred mainly along the plateaus of the reserve (Figs 1 and 2). Whether these habitat features (forest structure components and local terrain ruggedness) are considered to be crucial com-ponents of birds’ niches (PIANKA 1974, WIENSetal. 1987) needs further investigation. Nevertheless, other bird species abun-dance and changes in bird community compositions in rela-tion to changes in the forest structure in Central Amazon for-est has also been recently documented (see below, and CINTRA & CANCELLI 2008, BANKS & CINTRA 2008).
Owls generally are opportunistic birds in the use of the resources available, and their frequent use of areas with high abundance of snags may be a consequence of the use of dead or alive trees in their activities (BUCHANANetal. 1993). At Ducke Reserve we found that the abundance of both L.cristata and M. watsonii was directly related to the abundance of forest snags, suggesting that these owls seem to use preferentially areas in the forest with higher density of snags. Snags can be used by
owls for building nests in natural cavities (BUCHANANetal. 1993). However, the use of snags for nesting is not always favorable. THROSTROMetal. (2000) found that species that usually build their nests in cavities of snags are negatively affected by nest predation. The authors suggested that nest predators visit snags more often when they are searching for food. For the screech owl Megascopsasio, for example, nest cavity dimension is also important since it has been demonstrated that the deeper the nest cavity, the lower the juvenile predation (BELTHOFF & RITCHINSON 1990).
ROCHA & RANGEL-SALAZAR (2001), studying owls in the La Selva Biological, Costa Rica, found that tree density, forest gaps, and proximity to roads were important variables affecting the abundance of vermiculated screech-owl Megascopsvermiculatus
and L.cristata. Number of fallen trees was important for the mottled owl Strixvirgata, and canopy height for the black-and-white owl S.nigrolineata. ROCHA & RANGEL-SALAZAR (2001) found that detection of L.cristata and S.virgata increased in less illumi-nated areas in the forest. The calling activities of the three owl species were associated with the moon phase, and were also cor-related with the season of the year. In our study area, G.hardyi
seems to prefer more open areas in the forest (Tab. VI, Fig. 6). Some owls’ species may move to other areas when local conditions are limited. For example, the eastern screech owl
the ground. Because areas of shallow litter tend to have less debris (dead twigs and leaves), the detection and capture of preys on the ground would be easier. For some owls’ species in the northern hemisphere, the variation in the amount of ground cover, such as litter and wood debris, was found to be related to the number of the available prey (MCINVAILLE & KEITH 1974, VILLAGE 1982, SMITH & GILBERT 1984, SPARKSetal. 1994).
At Ducke Reserve, M.watsonii was more often recorded in areas with higher abundance of trees, which seems to con-tradict the results mentioned earlier, because areas with more trees would be expected to produce more litter fall. However, most of the tree species in our study area are not deciduous during the dry season (RIBEIROetal. 1999). We believe that this owl species is more frequent in areas of higher tree density because they tend to use more closed and shaded areas and tall trees for nest construction and roosting (MARKSetal. 1990). In fact, vegetation structure seems to be more important for some owl species to select spots for rest and breeding rather than feeding. For instance, the spotted owl Strix occidentalis build their nests in forest areas with higher number of trees and more closed canopy, perhaps to confuse those predators when search-ing for food in tree cavities (GANEY & BALDA 1989, 1994, CALLet al. 1992). The long-eared owl Asiootus builds its nests in areas with closed canopy, and this behavior seems to reduce preda-tion on their juveniles (BULLetal. 1989). The flammulated owl
Otusflammeolus in New Mexico prefers areas under lower num-ber of shrubs around the nests; this behavior is consistence with low profile flights close to the ground while tending to the nest (MCCALLUM & GEHLBACH 1988).The availability of areas for shelter and rest during the day could be another reason why M.watsonii uses areas with higher tree abundance at Re-serve Ducke. Individuals of this species use closed and dense forests more often probably because they are more able than other species to fly maneuvers in areas with many obstacles.
Individuals of M.watsonii were found in most of the south-eastern area of the Reserve (Fig. 3), where the ruggedness of the terrain is accentuated. This is not a particular preference of this species only. In areas of accentuated forest floor inclination, the canopy of a given tree may be closer to the ground than those from plateau areas, and this may help the owl to surprise and, in a short flight, catch more ground preys in these areas. However, this might not be a behavior showed exclusively by tropical owls. In the forested mountains of Arizona, it has been found that spotted owl occurs mainly in forests with closed canopy, which are more common along canyons (GANEY & BALDA 1989, 1994).
The availability of preys and their density may affect den-sity and habitat use by many raptors, including the spotted owl
Strixoccidentalis (CAREYetal. 1992, ZABELetal. 1995, WARDetal. 1998). In the Amazon forest, KILTIE (1981) found that rodents hide seeds and fruits near forest logs, and often return to the same spots to recover them. The increase in rodent movements around forest logs may attract the attention of owls, which may use the areas more often than those without logs because of the
ease of detecting and capturing prey there. Individuals of G. hardyi were widely distributed at Reserva Ducke (Fig. 2), and also occurred more often near streams. The use of areas near forest streams by this species could be related to capture of prey. Forest canopy along the streams is more open and may help long fly-ing and glidfly-ing movements for locomotion and huntfly-ing. At the Reserve, a relatively high number of small, semi-aquatic and ter-restrial rodents, birds, frogs, lizards, and other potentials prey are associated with aquatic environments. In Finland, it was found that the high proportion of bodies of water was related to a higher percentage of rodents (Arvicolaterrestris) in the diet of the Ural owl Strixuralensis (KORPIMÄKI & SULKAVA 1987).
Finally, our results indicate that the environmental het-erogeneity of the forest through its forest structure components at the local and regional levels (large spatial scale) can be de-terminants to explain the occurrence and abundance of owl species in a given area. We also found that the way habitat structure affects owls was species dependent. Although the for-ested area of city around the reserve is decreasing every year due to the rapid urban growth of Manaus, we think that the populations of the three owl species seem to be relatively in-tact. Lophostrixcristata may be one of the least known among the 178 species of owl recognized in the world, and in the Amazon region, it is associated with mature forest (terrafirme
forest) for roosting and nesting. However, the protection of the forest in the reserve, through the prevention of human invasion and deforestation, is important, because habitat loss is probably the main factor affecting populations of tropical rain forest birds (BIERREGAARD & LOVEJOY 1989, JOHNS 1991).
ACKNOWLEDGMENTS
We are grateful to the Instituto Nacional de Pesquisas da Amazônia (INPA) and Conselho Nacional de Desenvolvimento Científico e Tecnológico (CNPq) for their financial support. To Fernando Raeder, Ivo Ghizoni, Cristina Banks, Paulo Stefano, Dalci Oliveira, Belén Aznar, Karina Amaral, Sidnei Dantas, Marlison Ferreira, Cleuton de Andrade, Alexandre Elias dos Santos, João Batista Rocha, Francisco Bezerra who helped us to collect the forest structure data and also in the the owl census. José Toledo helped us with “R” software. O. Barros wants to thank his forest family Nazaré Araújo, Manoel Pereira, Ademir Oliveira, Everaldo Pereira, and José Eremildes for the support at the camp site during the data collection period. We want to thank all employees of INPA’s ecology department, especially Geize Pacheco, the drivers Carlos Moreira, Lourival Santos and João Sá Rodrigues, the Ducke Reserve team and Dona Veronica, all who contributed to the logistics for this study.
LITERATURE CITED
BARLOW, J.; C.A. PERES; L.M.P. HENRIQUES; P.C. STOUFFER & J.M. WUNDERLE. 2006. The responses of understory birds to forest fragmentation, logging and wildfires: an Amazonian synthesis. BiologicalConservation128: 182-192. BARROWS, C. 1981. Roost selection by spotted owls: an adaptation
to heat stress. TheCondor83: 302-309.
BELTHOFF, J.R. & G. RITCHINSON. 1990. Nest-site selection by Eastern Screech Owls in central Kentucky. TheCondor92: 982-990. BIERREGAARD, R.O & T.E. LOVEJOY. 1989. Effects of forest fragments on Amazonian understor y bird communities. Acta Amazonica19: 215-241.
BUCHANAN, J.B.; L.L. IRWIN & E.L. MCCUTCHEN. 1993. Characteristics of Spotted Owls nest trees in the Wenatchee National forest. JournalofRaptorResearch27: 1-7.
BORGES, S. 2003. ListailustradadasavesdoParqueNacional doJaú. Manaus, Fundação Vitória Amazônica, 75p. BORGES, S.H.; L.M. HENRIQUES & A. CARVALHÃES. 2004. Density and
habitat use by owls in two Amazonian forest types. Journal ofFieldOrnithology75 (2): 176-182.
BULL, E.L.; A.L. WRIGHT & M.G. HENJUM. 1989. Nesting and diet of long-eared owls in conifer forest, Oregon. TheCondor 91: 908-912.
CALL, D.R.; R.J. GUTIÉRREZ & V. JARED. 1992. Foraging habitat and home-range characteristics of California Spotted owls in the Sierra Nevada. TheCondor94: 880-888.
CAREY, A.B.; S.P. HORTON & B.L. BISWELL. 1992. Northern Spotted Owls: influence of prey base and landscape character. EcologicalMonographs62: 223-250.
CINTRA, R. & J. CANCELLI. 2008. Effects of forest heterogeneity on occurrence and abundance of the scale-backed antbird,
Hylophylax poecilinotus (Aves: Thamnophilidae), in the Amazon forest. RevistaBrasileiradeZoologia25: 630-639. CINTRA, R.; A.E. MARUOKA & L.N. NAKA. 2006. Abundance of two
Dendrocincla woodcreeps (Aves: Dendrocolaptidae) in relation to forest structure in Central Amazonia. Acta Amazonica36: 209-220.
CINTRA, R.; T. SANAIOTTI & M. COHN-HAFT. 2007. Spatial distribution and habitat of the Anavilhanas Archipelago bird community in the Brazilian Amazon. Biodiversity andConservation 16: 313-336.
COHN-HAFT, M.; A. WHITTAKER & P.C. STOUFFER. 1997. A new look at the “species-poor” Central Amazon: the avifauna north of Manaus, Brazil. OrnithologicalMonographs48: 205-235. FOX, J. 2002. An R and S-Plus Companion to Applied
Regression. London, SAGE Publications, 312p.
GANEY, J.L. & R.P. BALDA. 1989. Distribution and habitat use of Mexican Spotted owls in Arizona. TheCondor91: 355-361. GANEY, J.L. & R.P. BALDA. 1994. Habitat selection by Mexican Spotted owls in northern Arizona. TheAuk111: 162-169. GUILHERME, E. & R. CINTRA. 2001. Effects of intensity and age of selective logging and tree girdling on an understory bird community composition in central Amazonia, Brazil. Ecotropica7: 77-92.
JOHNS, A.D. 1991. Responses of amazonian rain forest birds to habitat modification. JournalofTropicalEcology7: 417-437.
HERSHEY, K.T.; E.C. MESLOW & F.L. RAMSEY. 1998. Characteristics of forest at Spotted Owl in the Pacific Northwest. Journal ofWildlifeManagement62 (4):1398-1410.
HILTY, S.L. 2003. Birdsof Venezuela. Princeton, Princeton University Press, 878p.
KARR, J.R. & K.E. FREEMARK. 1983. Habitat selection and environmental gradients: dynamics in “stabled” tropics. Ecology64 (6): 1481- 1494.
KILTIE, R. 1981. Distribution of palm fruit on a rain forest floor: Why white – lipped peccaries forage near objects. Biotropica 13: 141-145.
KORPIMÄKI, E. & S. SULKAVA. 1987. Diet and breeding performance of Ural owls Strixuralensis under fluctuating food conditions. OrnisFennica64: 57-66.
MACARTHUR, R.; H. RECHER & M. CODY. 1966. On the relation between habitat selection and species diversity. American Naturalist100: 319-332.
MCCALLUM, D.A. & F.R. GEHLBACH. 1988. Nest-site preferences of Flamulated owls in western New Mexico. TheCondor90: 653-661.
MCINVAILLE JR, W.B. & L.B. KEITH. 1974. Predator-prey relations and breeding biology of the great horned owl and the red-tailed hawk in central Alberta. Canadian Field – Nature 88: 1-20.
MARKS, J.S.; R.J. CANNINGS & H. MIKKOLA. 1999. Strigidae. P.34-243. In: DEL HOYO, J. A. ELLIOTT & J. SARGATAL (Eds). Handbook of the birds of the world. Barcelona, Barn Owls to Humminbirds, Linx Editions, vol. 5, 749p.
NEPSTAD, D.C.; A. VERÍSSIMO; A. ALENCAR; C. NOBRE; E. LIMA; P. LEFREVE; P. SCHLESINGER; C. POTTER; P. MOUTINHO; E. MENDONZA; M. COCHRANE & V. BROOKS. 1999. Large-scale impoverishment of Amazonian forests by logging and fire. Nature398: 505-508.
NEWTON, I.; M. MARQUISS; D.N. WEIR & D. MOSS. 1977. Spacing of Sparrow Hawk nesting territories. Journal of Animal Ecology46: 425-441.
PIANKA, E.R. 1974. Niche overlap and diffuse competition. ProceedingoftheNationalAcademyofScienceUSA1: 2141-2145.
REY, P.J. 1995. Spatial-temporal variation in fruit and frugivorous bird abundance in olive orchards. Ecology75: 1625-1635. RIBEIRO, J.E.L.S.& M.J. G.HOPKINS; A. VICENTINI; C.A. SOTHERS; M.A. COSTA; J.M. BRITO; M.A.D. SOUZA; L.H.P. MARTINS; L.G. LOHMANN; P.A.C.L. ASSUNÇÃO; E.C. PEREIRA; C.F. SILVA; M.R. MESQUITA; L.C. PROCÓPIO. 1999. Flora da Reserva Ducke – Guia de identi-ficação das plantas vasculares de uma floresta de terra-firme na Amazônia Central. Manaus, INPA-DFID, 816p. ROCHA, P.L.E. & J.L. RANGEL-SALAZAR. 2001. Owl occurrence and
Submitted: 16.XI.2007; Accepted: 10.III.2009. Editorial responsibility: Glauco Machado
SERVAT, G.P. 1996. An annotated list of birds of the Biolat Biological Station at Pakitza, Peru, p. 555-575. In: D. WILSON & A. SANDOVAL (Eds). Manubiodiversity ofsoutheastern Peru. Washington, Smithsonian Institution Press, 679p. SMITH, D.G. & R. GILBERT. 1984. Eastern Screech-Owl home
ran-ge and use of suburban habitats in southern Connecticut. JournalofFieldOrnithology55: 322-329.
SPARKS. E.J.; J.R. BELTHOFF & G. RITCHISON. 1994. Habitat use by eastern Screech Owl in central Kentucky. JournalofField Ornithology65: 83-95.
SPRINGER, M.A. 1978. Foot surveys versus owl calling surveys: a comparative study of two Great Horned Owl censuring techniques. InlandBirdBandingNews50: 83-93. SWENGEL, S.R. & A.B. SWENGEL. 1992. Roosts of northern Saw-wet
Owl in southern Wisconsin. TheCondor94: 880-888. TERBORGH, J.W.; J.W. FITZPATRICK & L. EMMONS. 1984. Annotated
checklist of birds and mammal species of Cocha Cashu Biological Station, Manu National Park, Peru. Fieldiana Zoology21: 28.
THROSTROM, R.; J.D. RAMOS & C.M. MORALES. 2000. Breeding biology of Barred Forest-falcons Micrastur rufficollis) in northeastern Guatemala. TheAuk117 (3): 781-786. VAN DAELE, J. & H.A.VAN DAELE. 1982. Factors affecting the
productivity of Ospreys nesting in west-central Idaho. The Condor84: 292-299.
VILLAGE, A. 1982. The home range and density of kestrels in relation to vole abundance. JournalofAnimalEcology51: 413-428.
WARD JR, J.P.; J.R. GUTIÉRREZ & B.R. NOON. 1998. Habitat selection by Northern Spotted owls: the consequences of prey selection and distribution. TheCondor100: 79-92. WIENS, J.A.; J.T. ROTENBERRY & B. VAN HORNE. 1987. Habitat
occupancy patterns of North American shrubsteppe birds: the effects of spatial scale. Oikos48: 132-147.
WILKINSON, L. 1998. Systat: Thesystemforstatistics. Evansto, SYSTAT Inc.,1086p.
WILLIS, E.O. 1977. Lista preliminar das aves da parte noroeste e áreas vizinhas da Reserva Ducke, Amazonas, Brasil. Revista BrasileiradeBiologia37 (3): 585-601.
ZIMMER, K.J.; T.A. PARKER III; M.L. ISLER & P.R. ISLER. 1997. Survey of a southern Amazonian avifauna: the Alta Floresta region, Mato Grosso, Brazil. OrnithologicalMonographs48: 887-918. ZABEL, C.J.; K. MCKELVEY & J.P. WARD JR. 1995. Influence of primary