IDENTIFYING AT-RISK STUDENTS IN HIGHER EDUCATION
ABSTRACT
The successful implementation of quality management systems in higher education relies on the ability to address topics meaningful to stakeholders. A topic that is moving to the top of many higher education institutions agendas and is meaningful to students, faculty and management is student dropout. Alongside its social and personal consequences, dropout impairs cost efficiency and the institution's image. This paper shows that in spite of the complex web of factors influencing student dropout, simple models for the identification of at-risk of dropout students can be derived and used to support decision making. The paper starts with an introduction to dropout models, next, the difficulty in implementing quality management systems in higher education is addressed; details about a process for the identification of at-risk students are presented. A case study is used to show that it is possible to identify at-risk students using only academic data and administrative records. Finally, the advantage of including an at-risk student identification process within the framework of a higher education quality management system is discussed.
Keywords:
Higher education, student dropout, quality management system, academic analytics
INTRODUCTION
According to a European University Association survey to over 200 HEIs from 36 countries, by 2010 the majority of the institutions already had an internal quality assurance system (Loukkola, 2010). In Europe this owes much to the 1999 Bologna Declaration and to the subsequent definition, in 2005, of guidelines for the development of institutional quality management systems (ENQA, 2005). The scientific literature presents many different examples of how quality principles can be applied to the benefit of HEIs management (Min, 2012; Nadiri, 2009; Owlia, 1996; Vauterin, 2011, Yeo, 2014); specific processes that are frequently addressed within the framework of HEIs quality management are related to administrative services (e.g., frontoffice, backoffice, library), to internationalization, and, obviously, to the teaching and learning. When it comes to the key teaching and learning macro-process several researchers have reported difficulties in implementing quality management principles (Brennan, 2000; Chen, 2014; Hoecht, 2006; Newton, 2002; Quinn, 2009). This has been largely attributed to faculty resistance to changes, however, we believe the way quality systems have dealt with the teaching and learning process is responsible too for the difficulties found. The processes used to address the teaching and learning must be meaningful to the stakeholders, and research results show that this is not always the case for faculty, which often associate quality with bureaucracy, shift towards managerialism and related problems of trust, control and autonomy loss.
designed without compromising innovation in teaching and, at the same time, should promote faculty empowerment; two critical factors when implementing total quality management principles in HEIs (Jauch, 1997).
Dropout prevention is a topic that is meaningful to stakeholders, is related to the teaching and learning process and is moving to the top of many HEIs' agendas. There are several reasons behind the attention student dropout is receiving; a very important one is the need to comply with governmental targets of student population and the adverse funding consequences student dropout entails (Sultan, 2010); but changes in student characteristics are also important, namely those resulting from the promotion of lifelong learning, which led to a significant increase of the adult student population. For mature part-time commuter students, with less time to socialize with peers and faculty, a much more consumer centered attitude towards education applies; adult students' view of education is closer to that of a product to be consumed: if they are not satisfied with their experience, the chances of dropout are significantly increased.
The paper starts with an introduction to dropout models and to the variables/constructs commonly used in these models. Next, the difficulty in implementing quality management systems in HEIs is briefly addressed; the feasibility of including a process for at-risk student identification within the framework of quality management is also discussed. A case study is then used to show that it is possible to identify at-risk students using only academic and administrative records. Finally, the advantage and consequences of including an at-risk student identification process in a HEI’ quality management system is discussed.
DROPOUT MODELS
The dropout problem has been addressed by HEIs in different ways, with the adoption of preventive measures ranging from tutorial programs or mentoring to encompassing programs that take into consideration cognitive, social and institutional factors (Blanc, 1983; Swail, 2004; Valentine, 2011). These programs share the goal of reducing the gap that prevents students from developing their competences at the institution, and provide additional support for at-risk groups (e.g., financial aid, improving study or time management skills). Dropout programs implement solutions that have proven adequate for problems in specific institutions and/or contexts, their focus is on action. Dropout models, on the other hand, address the dropout problem from a theoretical standpoint.
it considers student dropout as a result of dynamic and reciprocal interactions that take place over time between the students’ personal characteristics, HEI’s characteristics and the elements of the outside community that surround the student (e.g., family, friends and business and economic contexts). According to Tinto, an initial commitment to enrol and persist in higher education can be related with family background, the individual values and previous secondary school experience. Contributing to the strengthening of the institutional experience are the student’s academic integration – related to grade performance and intellectual development – and the student’s social integration – related with interactions with peers and with faculty. According to Tinto, the extent to which a student is academically and socially integrated in the HEI will determine his commitment to graduate and his commitment to the HEI. This in turn influences the student’s decision to dropout, or not to dropout (to persist).
Tinto’s model has been quite successful in raising awareness of HEIs’ management of the topic of student dropout and of the importance of dropout prevention programs. This awareness promotion is, in fact, the main virtue of the existing dropout models.
grades (GPA), Tharp (1998) and Metzner (1987) report that a measure of contact between the student and the institution is also especially significant when studying dropout among adult students and commuter HEIs.
These results emphasize the difference between the complex dynamics of the dropout process and the somewhat strait forward correlations that can be used to identify the dropout outcome. Studies dealing with the identification of at-risk students which aim at predicting the dropout outcome, can restrict to the use of strait forward correlations.
INTEGRATING DROPOUT PREVENTION AND QUALITY MANAGEMENT Due to its time cycle and to the complex interrelations between teacher, student and institutional environment, the teaching and learning process is among the most complex to be managed. It is therefore no surprise that researchers report difficulties with the implementation of this process within the framework of HEIs’ quality management systems (Owlia, 1996; Newton, 2002; Hoecht, 2006). Frequent justifications for failure are teachers' culture and autonomy, or the lack of supporting leadership, however, if one takes a closer look, the failure also stems from the difficulty quality systems have had in delivering tools that address stakeholders specific problems. Finding topics that are meaningful, tools that empower stakeholders, and implementing processes that promote the right balance between academic freedom and accountability is paramount for the successful implementation of quality management systems in HEIs.
would address a meaningful topic, would empower teachers (and students too) without direct and prescriptive instructions influencing the teachers' autonomy. Such a process could contribute to reduce the resistance teachers may have towards the implementation of quality management principles in HEIs. However, to implement such a process, student administrative and academic data needs to be available.
Fortunately, the availability of student data in HEI has grown considerably as a consequence not only of the technological development but also of the external pressure for accountability (Hawkins, 2008). In Europe, the 2005 guidelines for the introduction of institutional quality management systems in HEIs (ENQA, 2005) specify the use of information system capable of collecting and analyzing relevant information. The availability of student data has even justified the emergence of the “educational data mining” (Backer, 2009) and “academic analytics” (Goldstein, 2005) research fields, which aim at data-driven decision making, at all levels of the HEI.
An example of the use of academic analytics for the identification of students needing assistance is presented by Campbell (2007). Using data gathered from a HEI information system, Campbell is able to relate students’ grades with patterns of students’ past academic record, intensity of use of the information system, and demographic characteristics. From these relations and from the digital track students leave, it is possible to detect those that need assistance and it is possible to trigger adequate actions.
Figure 1. Process of at-risk student identification.
A data warehouse holding students’ academic and demographic records, and records of the use of the different HEI electronic platforms (at institutional, course and class levels), provides the necessary data. Statistical techniques can then be used to identify patterns of students’ characteristics and behaviors associated with dropout. This constitutes the data mining stage. Using the relations discovered during the data mining stage it is possible to identify at-risk students – the predictive modelling stage –, produce alarms and reports highlighting students’ “trajectories”.
The integration of the above described process in a HEI quality management system contributes to commit the leadership to management based on facts and to a positive image of quality management systems in the HEI.
CASE STUDY
The main doubt regarding the implementation of the process described in Figure 1 is the ability to obtain simple correlations between students' data and the dropout outcome. Although the bibliographic research suggested this would be possible, differences in students characteristics may occur. To evaluate the possibility of such correlation at Instituto Politécnico de Setúbal (IPS), Portugal, a case study was used.
A technological course designed for adult students was selected for the study. Data gathered (solely) from the institutional information was used to characterize the students. The sample considered of a total of 293 students of a four years Technology and Industrial Management graduate course. The sample included all students enrolled between the academic years of 2007-2008 and 2010-2011. The majority of the students were adults (85%), male (82%), employed full-time (98%) and 59% of them had children. All students commuted to attend classes.
The following variables were considered in the study:
- Measure of student persistence: number of enrollments (in the course);
- Measure of student background: a composite index that considers the student’s performance (number of enrollments) at fundamental modules (e.g., mathematics and physics).
The measure of student persistence relates to student commitment. A higher number of enrollments imply more opportunities to socialize with peers and faculty and more opportunities to interact with the institutional environment. The measure of student efficiency relates to the student cognitive ability, however, links to other factors such as student’s background or even interaction with the institutional environment could be considered. The measure of student background is related to competences acquired in secondary school. This composite index considers the students’ proficiency at first year, first trimester modules whose theoretical nature ask for competences that are distinct from the experiential competences common among adult students.
To study the relation between student dropout (the nominal dependent variable) and the variables above (the independent variables) a logistic regression was performed. PASW Statistics 18 software package was used in this analysis.
Students that left the course with zero examination attendances (the majority with minimum or no contact at all with the HEI) were removed from the sample. Outliers and influential cases were also removed. The working sample included 254 students.
the Logit of the probability of dropping out (Wald2
1 0.133; p=0.715). The modelwas adjusted without the background variable and the new logistic regression model
proved statistically significant with statistics 2
2 211.853
G , p<0.001;
8 6.043 2
HL
, p=0.642 (Lameshow & Hosmer); and with Cox & Snell, Nagelkerke
and McFadden coefficients of determination 2 0.566
CS
R , 2 0.803
N
R and
683 . 0 2 MF
R , respectively.
When the regression model was used to classify the sample subjects, 90.9 % of the subjects were correctly classified (significantly above the percentage computed from the proportional classification criteria, 58.5%). The model sensitivity and specificity was also determined: 93.3% (12 false-negatives) and 85.5% (11 false-positives), respectively. These good results agree with those reported by Tharp (1998) that uses a similar sample (adult students, urban commuter HEI) and concludes that “two particular variables, first semester hours [enrolled] and first semester grade point average, were significant in their ability to predict dropout.”
Figure 2. Probability of dropping out (Y = 1) as a function of student efficiency and a measure of student persistence (number of course enrollments, in years).
Figure 2 clearly shows that the probability of dropout lowers after the third enrollment (triangles). If a student enrolls four or more years (plus and cross signs), regardless of the efficiency, the probability of dropout will be quite low. The number of enrollments may lead inefficient students to believe they have come too far to turn back on the opportunity to graduate.
below 50% and 30%, respectively.
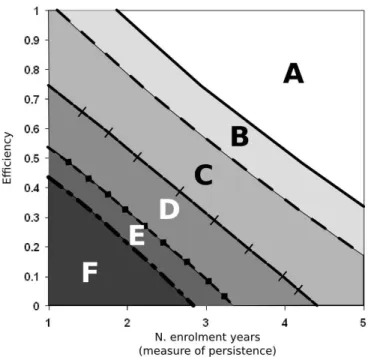
To reduce the model sensitivity (reduce false negatives) 95% and 80% confidence intervals of the regression coefficients were used to define areas above and below the 50% predicted probability of dropout line, as shown in Figure 3. Combinations of efficiency and measure of persistence that fall in region A are associated with low dropout potential; region F is associated with high dropout potential.
Figure 3. Regions of dropout potential: From high (region F) to low (region A) potential.
Figure 3 helps decision makers select the appropriate preventive actions and contributes to IPS’ quality management team objective of promoting management based on facts.
CONCLUSIONS AND FUTURE WORK
and control, students life projects can be unnecessarily jeopardized and lead, especially for adult students, to hasty decisions to quit higher education studies.
The results presented in the previous section show that HEIs’ administrative action isn’t limited by the complex dynamics of the dropout process. For the adult population considered in the case study a simple correlation using data available from the institutional information system enabled the identification of at-risk students and the prediction of the dropout outcome.
Results from simple tools can be used by decision makers to support systematic dropout preventive actions, plan investments, manage the resources; gain some control over the dropout process. Faculty too is empowered with the implementation of a tool that simplifies the follow-up of students’ academic “trajectory”.
The benefits of implementing such a process within the framework of HEIs quality management systems are obvious:
- it contributes to commit leadership to management based on facts;
- it contributes to contradict frequent criticisms to quality management in HEIs, showing that it is possible to further empower (already empowered) teachers and, at the same time, improve the teaching and learning process without prescriptive instructions that compromise innovation in teaching or teachers' autonomy.
Teaching and learning problems aren't addressed head-on; instead, existing problems are made visible through the public display of data on specific outcomes of the teaching and learning macro-process. For the specific process of at-risk student identification the outcome is simply student dropout or student persistence.
It is possible that different cultural contexts allow or ask for more prescriptive methods or tools when addressing problems related to the teaching and learning macro-process. For the specific case of IPS, the philosophy underlying the implemented quality management system always relied on increasing knowledge about the variables with impact on the outcomes; and, “stimulat[ing] disequilibrium with information” (Snyder, 2000, p. 320). This philosophy gave monitoring – not prescriptive instructions – a fundamental role within IPS' quality management system. We believe processes such as the identification of at-risk students contribute to the acceptance of quality principles in the teaching and learning process of HEIs.
The research work done so far can be continued along two main lines of action: (i) The alert mechanism presented in Figure 1 could gain visibility whenever at-risk students are identified (see Arnold, 2010); (ii) At-risk student identification can be extended to other courses and to different student populations.
List of references
Backer, R., Yacef, K. (2009). The state of educational data mining in 2009: A review and future visions, Journal of Educational Data Mining, 1(1):3-17.
Blanc, R. A., DeBuhr, L. E., Martin, D. C. (1983). Breaking the Attrition Cycle: The Effects of Supplemental Instruction on Undergraduate Performance and Attrition, The Journal of Higher Education, 54(1): 80-90.
Brennan, J., Shah, T. (2000). Quality Assessment and Institutional Change: Experiences from 14 Countries. Higher Education, 40: 331-349.
Campbell, J. (2007). Utilizing Student Data within the Course Management System to Determine Undergraduate Student Academic Success: An Exploratory Study. PhD
Dissertation. West Lafayette, Indiana: Purdue University.
Chen, C.-Y., Chen, P.-C., Chen, P.-Y. (2014). Teaching quality in higher education : An introductory review on a process-oriented teaching-quality model. Total Quality Management & Business Excellence, 25(1); 36-56.
ENQA (2005) Standards and guidelines for quality assurance in the European higher education. European Association for Quality Assurance in Higher Education.
Hawkins, B. L. (2008). “Accountability, Demand for Information, and the Role of the Campus IT Organization,” in R. N. Katz (Ed.), The Tower and the Cloud, pp.:98–104.
Hoecht, A. (2006). Quality assurance in UK higher education: Issues of trust, control, professional autonomy and accountability. Higher Education, 51: 541–563.
Jauch, L., Orwig, Robert. (1997). A Violation of Assumptions: Why TQM won't Work in the Ivory Tower. Journal of Quality Management, 2(2): 279-292.
Kanji, G., Malek, A., Tambi, A. (1999). Total Quality Management in UK Higher Education Institutions. Total Quality Management, 10(1): 129-153.
Loukkola, T., Zhang, T. (2010). Examining Quality Culture: Part 1 – Quality Assurance Process in Higher Education Institutions. European University Association (Technical
Report).
Metzner, B. S., Bean, J. P. (1987). Estimation of a conceptual model of nontraditional undergraduate student attrition. Research in Higher Education, 27(1): 15-38
Min, S., Khoon, C., Tan, B. (2012). Motives, expectations, perceptions and satisfaction of international students pursuing private higher education in Singapore. International Journal of Marketing Studies, 4(6): 122-138.
Newton, J. (2002). Barriers to effective quality management and leadership: case study of two academic departments. Higher Education, 44:185–212.
Owlia, M., Aspinwall, E. (1996). Quality in higher education — a survey. Total Quality Management, 7(2):161–171.
Quinn, A., Lemay, G., Larsen, P., Johnson, D. (2009). Service Quality in Higher Education, Total Quality Management & Business Excellence, 20(2): 139-152.
Snyder, K.J., Acker-Hocevar, M., Snyder, K.M., (2000), Living on the Edge of Chaos: Leading Schools into the Global Age, ASQ Quality Press, Milwauke, Wisconsin.
SPSS (2009). PASW Statistics 18.0 Statistical Algorithms, SPSS, Inc.: Chicago, IL.
Sultan, P., Wong, H. (2010). Service Quality in Higher Education – A Review and Research Agenda. International Journal of Quality and Service Sciences, 2(2): 259-272.
Swail, W. S. (2004). The art of student retention: A handbook for practitioners and administrators, Educational Policy Institute. Texas Higher Education Coordinating Board - 20th Annual Recruitment and Retention Conference, Austin, Texas.
Tinto, V. (1975). Dropout from higher education: A theoretical synthesis of recent research. Review of Educational Research, 45(1): 89-125.
Valentine, J. et al. (2011). Keeping At-Risk Students in School: A Systematic Review of College Retention Programs. Educational Evaluation and Policy Analysis, 33(2): 214-234.
Vauterin, J., Linnanen, L., Marttila, E. (2011). Issues of delivering quality customer service in a higher education environment. International Journal of Quality and Service Sciences, 3(2): 181-198.