Abstract—Numerical simulations based on Computational Fluid Dynamics (CFD) are performed to investigate the fluid-structure interaction of trees subjected to wind loads. Pressure and velocity fields including mechanical effects on tree trunks are compared between gentle breeze and severe tropical storm conditions and it is observed that tree damage is likely to occur for the latter.
Index Terms—Wind loads, atmospheric boundary layer flows, CFD, fluid-structure interaction, trees, turbulence
I. INTRODUCTION
HE implications of tree windthrow are far-reaching as the damage it causes results in significant economic losses due to reduction of timber value and destruction of public amenities, fatalities and even upsets the balance of ecosystems in forests [1]-[3]. Windthrow arises predominantly during storms [4], hence it is desirable to establish the key factors leading to its occurrence. Majority of previous investigations on windthrow have employed wind-tunnel (WT) experiments taking into account mechanical stability and other factors such as geographical, topographical, seasonal and meteorological influences [5], [6].
Fig. 1. Uprooting of several roadside trees at Kelana Jaya, Malaysia after a severe tropical storm.
Numerical simulations have effectively been employed in the past to study the interaction between the atmospheric boundary layer flow and trees, with various modeling
Manuscript received December 5, 2013.
C. J. Gan is a student with the Department of Engineering Design and Manufacture, Faculty of Engineering, University Malaya, 50603 Kuala Lumpur Malaysia. (Email: edwardgancj@gmail.com)
S. M. Salim is with the School of Engineering and Physical Sciences, Heriot-Watt University Malaysia Campus, 62100, Putrajaya, Malaysia (Phone: 603 – 8881 0918; fax: 603 – 8881 0194; e-mail: m.salim@hw.ac.uk).
techniques explored. For example, Gross [7] and Tiwary et al. [8] investigated the airflow around a single tree and through a vegetative barrier represented by a row of bushes. These studies expressed the obstacles as porous media with the addition of drag coefficients and speed resistance factors. On the other hand, others like Salim et al. [9], Buccolieri et al. [10] and Gromke et al. [11] modeled trees as porous media and accounted for their internal structures through the use of WT acquired pressure loss coefficients, λ (m-1). They investigated the influence of trees on the surrounding airflow and pollutant dispersion.
However, a numerical study to investigate the imposed aerodynamic loads and resulting mechanical effects on trees during storms has yet to be established and is the aim of the present research.
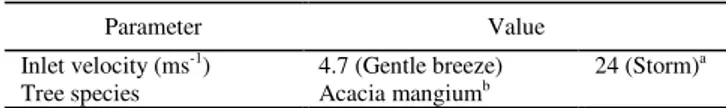
In this paper, velocity and pressure fields around a tree are numerically predicted using Reynolds Stress Model (RSM) turbulence closure scheme based on steady-state Reynolds-averaged Navier-Stokes (RANS) equations. Typical Malaysian meteorological conditions [12] and roadside tree species [13] are taken into account where a baseline (gentle breeze) wind speed of 4.7 ms-1 and extreme wind speed of 24 ms-1 (for a severe tropical storm) are investigated. These are summarized in Table 1 below.
TABLEI.VALUES USED IN PRESENT STUDY
Parameter Value
Inlet velocity (ms-1) 4.7 (Gentle breeze) 24 (Storm)a Tree species Acacia mangiumb
aStorm value is obtained from the extreme wind speed analysis for 100 year return period in Ipoh, Malaysia [12]
bAcacia mangium is a tree species commonly found at the roadsides of Malaysia [13]
The imposed wind loads experienced by the trees are then extracted from ANSYS FLUENT and imported into ANSYS Mechanical to perform structural analysis based on the Finite Element Method (FEM). This enables the prediction of the likelihood of windthrow to occur by considering both the prevailing wind conditions and structural integrity of the trees.
II. METHODOLOGY
A. Computational Domain and Boundary Conditions Numerical flow simulations are performed in ANSYS FLUENT, employing the simulation techniques and best practices of Salim et al. [9]. Validation and selection of a suitable numerical model are initially achieved using the WT experiments by Gross [7] as benchmark.
Numerical Analysis of Fluid
-
Structure
Interaction between Wind Flow and Trees
C. J. Gan, S. M. Salim
Fig. 2. Configuration of computational domain and setup
In order to mimic a typical urban atmospheric boundary layer flow, the inlet wind is assumed to follow the power law profile
(1)
where u is the vertical velocity profile, z is the vertical distance and the profile exponent, = 0.3 while uH is the
free-stream velocity (= 4.7 ms-1, 24 ms-1) at reference height, H = 0.12 m for gentle breeze and storm inlet conditions, respectively. This follows the established settings used in [9]-[11] validated against WT experiments.
Fig. 3. Top view of computational grid used in flow simulation of present study
The computational grid illustrated in Fig. 3 is generated using approximately 1.1 million hexahedral elements and complies with recommendations based on the wall y+ approach [14]. Resolution is enhanced progressively at the vicinity of the tree (at the center) to maximize numerical accuracy at regions of high solution gradients and reduce computational cost.
An inlet boundary condition is defined at the entrance while a pressure outlet is imposed at the exit of the domain to evacuate air. The top and sides of the computational domain are set as symmetry to represent slip condition while the floor is considered non-slip to correspond to typical conditions in open space. A summary of the 3D
computational domain and implemented boundary conditions are illustrated in Fig. 2.
B. Tree Modeling
The tree geometry is idealized into 5 separate cuboids with attempts to resemble the Acacia Mangium, a common roadside tree in Malaysia [13].
TABLE2.TREE SPECIFICATIONS
aMechanical properties of tree are obtained from field measurements [13]
The tree trunk is modeled as a solid obstacle while the crown is set to be permeable with a porosity of Pvol≈ 96 %.
This is numerically defined as a momentum sink comprising of the viscous and inertial loss terms (refer to equation (2)). The porosity is accounted for through a pressure loss coefficient (λ = 200 m-1). The tree specifications are summarized in Table 2.
∑ ∑ (2)
where is the source term for the ith (x, y or z) momentum equation while is the magnitude of velocity, C and D are prescribed matrices.
C. Numerical Setup
The steady-state RANS solutions are obtained using RSM turbulence model and the convergence criterion for all flow properties are set to 1 x 10⁻⁶ for both wind conditions. The solution methods employed are summarized in Table 3.
Parameter Value
Tree species
Largest width of crown (m) Largest height of crown (m)
Acacia mangium 27
27
Trunk height (m) 9
TABLE3.SOLUTION METHODS
2nd order upwind scheme is selected to minimize numerical diffusion
D. Mechanical Analysis
The resulting wind loads derived from ANSYS FLUENT are mapped, interpolated and exported to ANSYS Mechanical as face pressures. The material of the tree trunk is set to match the mechanical specifications from Table 2 [13] and the crown is assumed to be rigid. In order to solely investigate the aerodynamic effects resulting from interaction between the wind flow and structural behavior, the tree is assumed to be massless.
III. RESULTS AND DISCUSSIONS A. Flow Simulations
The numerical solutions obtained from CFD simulation are presented and compared in this section followed by results from the static structural analysis. Results for both CFD simulations and static structural analysis are based on non-dimensionalized distances based on a 1:18 scale. Fig. 4 presents the velocity contours for (a) gentle breeze and (b) storm conditions. It is observed that the airflow tends to go around the tree rather than through it. The magnitudes of the flow field and ensuing recirculation region are much stronger for the storm condition in comparison to the gentle breeze.
Fig. 5 quantitatively illustrates the vertical velocity profiles that develop for the two wind conditions. It is
observed that the velocity difference between the windward and leeward sides of the gentle breeze are negligible compared to the storm condition.
The larger velocity drop that is generated by the storm condition presents a larger pressure difference, which as a consequence implies that larger wind loads are experienced. In fact, just behind the tree (at x/H ≈ 10), the storm condition experiences a negative drop in velocity, demonstrating a very strong recirculation region which can visually be observed in the velocity contours presented in Fig. 4.
Fig. 5. Profiles of x/H velocity 1 H above ground along symmetry axis comparing between gentle breeze and storm inlet conditions
Parameter Scheme
Scheme Simple
Gradient Least Squares Cell Based
Pressure Standard
Momentum 2nd Order Upwind
Turbulent Kinetic Energy 2nd Order Upwind Turbulent Dissipation Rate 2nd Order Upwind Reynolds Stresses 2nd Order Upwind
(a)
XY Plane XZ Plane
(b)
Fig. 6. Profiles of static pressure 1 H above ground along symmetry axis comparing between gentle breeze and storm inlet conditions
The profiles and contours of pressure fields for the two conditions are presented in Fig. 6 and 7, respectively. These supports the observations derived from the velocity fields, where it is deduced that the pressure difference experienced during the storm conditions are much larger than those during gentle breeze, resulting in greater wind forces on the trees.
The recirculating region generated during the storm
condition introduces a negative pressure field immediately behind the tree, which increases the net force exerted. The negative pressure drop is attributed to the separation, reversal of airflow and formation of vortices. Fig. 5 further illustrates this, where the velocity is seen to dip below zero momentarily before accelerating as the flow attempts to reattach again.
In summary, it is clear that during high wind speeds the wind loads on trees are much higher due to the greater pressure differences experienced; hence the likelihood of structural damage is significantly increased as shall be discussed in the following section.
B. Mechanical Analysis
The pressure field developed around the tree is used to perform a structural analysis to determine the mechanical effects.
Tree damage commonly occurs due to trunk breakage or failure in the root anchorage, when the forces exceed the structural resistance of the trunk or support system in the case of anchorage. In the present study, only the former is considered.
Table 4 below summarizes the results obtained from the structural analysis carried out in ANSYS Mechanical, where the flexural modulus and modulus of rupture are based on published data [13] (see Table 2).
TABLE4.STATIC STRUCTURAL RESULTS
Parameter Value
Flexural modulus, E
(Pa) 5.8E+9
Modulus of rupture, R
(Pa) 6.2E+7
Inlet Velocity (ms-1) 4.7 24
Min Max Min Max
Total Deformation 0 4.4E-1 0 1.2E+1 Equivalent Elastic
Strain
2.6E-11
7.7E-1
4.5E-3
2.2E+6
1.7E-9
8.4E+1
4.4E+3
5.7E+7 Equivalent Stress (Pa)
(a)
XY Plane XZ Plane
(b)
Winds typically induce a turning moment on the tree trunk hence flexural modulus rather than Young’s modulus is determined. For the purpose of this investigation, failure by virtue of breakage of trunk is assumed to occur when the exerted stresses from the wind loads exceed the modulus of rupture. Additional forces due to gravity when the trunk deflects substantially are neglected in order to identify and
quantify the aerodynamic effects only. The deformation values in this section are based on non-dimensionalized lengths employed for the computational domain.
Fig. 8 demonstrates the deformation of the tree when subjected to the two wind conditions. It can be seen that the (b) storm condition produces a larger deflection on the tree as compared to the (a) gentle breeze.
(a)
XY Plane (From bottom of tree) XZ Plane
(b)
Fig. 8. Contours of the total deformation for (a) 4.7 ms-1 (gentle breeze) and (b) 24 ms-1 (storm)
(a)
XY Plane (Cross-section view of trunk) XZ Plane
(b)
The resulting stresses from the imposed wind loads are shown in Fig. 9. Generally, it is observed that the stresses are at a minimum at the core of the trunk and increases outward. This suggests that at the time of trunk damage resulting from wind loads, failure is most likely to first occur on the outside and gradually propagates inwards. On the leeward side of the trunk (i.e. back of tree), the stresses can be seen to progressively increase as it moves farther from the ground (fixed support); where the magnitude of deflection is proportional to the resulting stresses.
From the simulated results, during a storm condition, windthrow by trunk breakage can be expected; with the values far exceeding the modulus of rupture for the given material.
IV. CONCLUSION
The wind loads and mechanical effects of two different wind conditions on trees are investigated for a typical baseline scenario based on gentle breeze and a severe case of tropical storm. Flow solutions (i.e. velocity and pressure fields) obtained from ANSYS FLUENT is used to perform a structural analysis in ANSYS Mechanical to determine the deflection and stresses likely to be experienced by trees due to wind loading.
During storm condition, the pressure difference between the windward and leeward sides are much larger than during gentle breeze because of a more prominent recirculating region which produces a negative flow field. This implies that the wind forces exerted on the tree are larger and as a consequence the trunks experiences higher deformation and stresses, increasing the likelihood of structural failure. Windthrow by trunk damage is expected to occur for storm conditions as the maximum equivalent stresses due to bending exceed the rupture modulus of the material.
REFERENCES
[1] N. G. Ulanova, “The effects of windthrow on forests at different spatial scales: a review,” Forest Ecology and Management, vol. 135, pp. 155 – 167, 2000.
[2] P. Duelli, M. K. Obrist, and B. Wermelinger, “Windthrow-induced changes in faunistic biodiversity in alpine spruce forests,” Forest, Snow
and Lanscape Research, vol. 77, no. ½, pp. 117 – 131, 2002.
[3] F. E. Putz, P. D. Coley, K. Lu, A. Montalvo, and A. Aiello, “Uprooting and snapping of trees: structural determinants and ecological consequences,” Canadian Journal of Forest Research, vol. 13, no. 5, pp. 1011 – 1020, 1983.
[4] D. S. Sinton and J. A. Jones, “Extreme winds and windthrow in the Western Columbia River Gorge,” Northwest Science, vol. 76, no. 2, pp. 173 – 182, 2002.
[5] H. M. Peltola, “Mechanical stability of trees under static loads,”
American Journal of Botany, vol. 93, no. 10, pp. 1501 – 1511, October
2006.
[6] E. Brudi and P. van Wassenaer, “Trees and statics: Non-destructive failure analysis,” in How trees stand up and fall down., Illinois, 2002, pp. 53 – 70.
[7] G. Gross, “A numerical study of the air flow within and around a single tree,” Earth and Environmental Science, vol. 40, pp. 311 – 327, 1987. [8] A. Tiwary, H. P. Morvan, and J. J. Colls, “Modelling the
size-dependent collection efficiency of hedgerows for ambient aerosols,”
Journal of Aerosol Science, vol. 37, pp. 990 – 1015, 2005.
[9] S. M. Salim, A. Chan, and S. C. Cheah, “Numerical Simulation of Atmospheric Pollutant Dispersion in Tree-lined Street Canyons: Comparison between RANS and LES,” Building and Environment, vol. 46, pp. 1735 – 1746, 2011.
[10] R. Buccolieri et al., “Analysis of Local Scale Tree- Atmosphere Interaction on Pollutant Concentration in Idealized Street Canyons and Application to a Real Urban Junction,” Atmospheric Environment, vol.
45, pp. 1702 – 1713, 2011.
[11] C. Gromke, R. Buccolieri, S. Di Sabatino, and B. Ruck, “Dispersion Study in a Street Canyon with Tree Planting by Means of Wind Tunnel and Numerical Investigations – Evaluation of CFD Data with Experimental Data,” Atmospheric Environment, vol. 42, pp. 8640 – 8650, 2008.
[12] M. S. Sapuan, A. M. Razali, and K. Ibrahim, "Forecasting and Mapping of Extreme Wind Speed for 5 to 100-years Return Period in Peninsula Malaysia," Australian Journal of Basic and Applied Sciences, vol. 5, no. 6, pp. 1204 – 1212, 2011.
[13] M. H. Sahri, Z. Ashaari, R. A. Kader, and A. L. Mohmod, "Physical and Mechanical Properties of Acacia mangium and Acacia Auriculiformis from Different Provenances," Pertanika Journal of Tropical Agricultural Science, vol. 21, no. 2, pp. 73 – 81, 1998.
[14] S. M. Salim, M. Ariff, and S. C. Cheah, "Wall y+ Approach for Dealing with Turbulent Flows over a Wall Mounted Cube," Progress


![Table 4 below summarizes the results obtained from the structural analysis carried out in ANSYS Mechanical, where the flexural modulus and modulus of rupture are based on published data [ 13] (see Table 2).](https://thumb-eu.123doks.com/thumbv2/123dok_br/18260826.343388/4.892.74.433.68.581/summarizes-results-obtained-structural-analysis-mechanical-flexural-published.webp)

