www.biogeosciences.net/bg/2/141/ SRef-ID: 1726-4189/bg/2005-2-141 European Geosciences Union
Biogeosciences
Submarine groundwater discharge to a small estuary estimated
from radon and salinity measurements and a box model
J. Crusius1, D. Koopmans1, J. F. Bratton1, M. A. Charette2, K. Kroeger2,*, P. Henderson2, L. Ryckman3, K. Halloran4, and J. A. Colman5
1US Geological Survey; Woods Hole Science Center; Woods Hole, MA 02543, USA
2Woods Hole Oceanographic Institution, Dept. of Marine Chemistry and Geochemistry, Woods Hole, MA 02543, USA 3Univ. of Pennsylvania; Dept. of Env. Studies; Philadelphia, PA 19104, USA
4Bucknell University, Lewisburg, PA 17837, USA 5US Geological Survey, Northborough, MA 01532, USA
*present address: US Geological Survey, St. Petersburg, FL 33701, USA
Received: 27 December 2004 – Published in Biogeosciences Discussions: 10 January 2005 Revised: 2 June 2005 – Accepted: 2 June 2005 – Published: 24 June 2005
Abstract. Submarine groundwater discharge was quantified by a variety of methods for a 4-day period during the early summer of 2004, in Salt Pond, adjacent to Nauset Marsh, on Cape Cod, USA. Discharge estimates based on radon and salinity took advantage of the presence of the narrow channel connecting Salt Pond to Nauset Marsh, which allowed con-structing whole-pond mass balances as water flowed in and out due to tidal fluctuations. The data suggest that less than one quarter of the discharge in the vicinity of Salt Pond hap-pened within the pond itself, while three quarters or more of the discharge occurred immediately seaward of the pond, ei-ther in the channel or in adjacent regions of Nauset Marsh. Much of this discharge, which maintains high radon activi-ties and low salinity, is carried into the pond during each in-coming tide. A box model was used as an aid to understand both the rates and the locations of discharge in the vicinity of Salt Pond. The model achieves a reasonable fit to both the salinity and radon data assuming submarine groundwa-ter discharge is fresh and that most of it occurs either in the channel or in adjacent regions of Nauset Marsh. Salinity and radon data, together with seepage meter results, do not rule out discharge of saline groundwater, but suggest either that the saline discharge is at most comparable in volume to the fresh discharge or that it is depleted in radon. The estimated rate of fresh groundwater discharge in the vicinity of Salt Pond is 3000–7000 m3d−1. This groundwater flux estimated from the radon and salinity data is comparable to a value of 3200–4500 m3d−1predicted by a recent hydrologic model (Masterson, 2004; Colman and Masterson, 2004), although the model predicts this rate of discharge to the pond whereas our data suggest most of the groundwater bypasses the pond Correspondence to:J. Crusius
(jcrusius@usgs.gov)
prior to discharge. Additional work is needed to determine if the measured rate of discharge is representative of the long-term average, and to better constrain the rate of groundwater discharge seaward of Salt Pond.
1 Introduction
In recent years it has become increasingly clear that subma-rine groundwater discharge (SGD) has a significant impact on the coastal ocean (Moore, 1996; Burnett et al., 2003). Some of the earliest research on SGD sought to quantify its role in the delivery of nutrients to the coastal ocean (e.g. Va-liela et al., 1990; Giblin and Gaines, 1990), and this con-tinues to be an important focus, particularly in places where domestic wastewater is treated by septic systems. However, because the influence of SGD on the ocean has only recently been recognized, there has also been a need to study the pro-cesses (e.g. redox, microbial, mixing of fresh and saline wa-ters) that affect elements in the “subterranean estuary” (sensu Moore, 1999) (e.g. Charette and Sholkovitz, 2002). In addi-tion, there has been a need for basic research aimed at im-proving our understanding of the contribution of SGD to the marine budget of certain elements (e.g. Fe, Ba, Ra, U).
Fig. 1. Aerial photo of Salt Pond and Nauset Marsh system taken in April, 2001 (Office of Geographic and Environmental Informa-tion (MassGIS), Commonwealth of Massachusetts Executive Office of Environmental Affairs) (Cape Cod location on inset). Shore-perpendicular seepage meter locations in Salt Pond are shown as red lines. The sampling raft location is indicated by a red dot at the NW end of the channel (69.97063 N, 41.83432 W).
this paper we will address what various tracers can tell us about the fresh and saline components of SGD.
Quantifying SGD remains challenging, despite our in-creased awareness of its importance, because discharge is diffuse and heterogeneous and occurs below the water sur-face, where direct observation and measurement are diffi-cult. Nonetheless, three primary methods have arisen in re-cent attempts to quantify SGD: 1) groundwater flow models; 2) seepage meters and 3) natural tracers, including radioiso-topes (radon and radium) and salinity.
In some locations, groundwater flow models are suffi-ciently well developed that they can be used to predict the delivery of fresh groundwater to the coast. While in these settings the hydrologic budget may be well constrained such that total discharge over a large coastal area is well known, the precise location of discharge of that freshwater in the coastal zone is often not known. This can be important, because groundwater and nutrients discharged directly to a coastal pond, for example, will have a much greater impact on the pond than groundwater discharged directly into the adjacent ocean. Furthermore, it is worth noting that one re-cent study from the Northeast Gulf of Mexico (Smith and Zawadzki, 2003) concluded that model-based fresh ground-water discharge estimates were much lower than field-based estimates based on radioisotopes and seepage meters unless the hydraulic conductivity was much higher than considered in the model. Hence, there is a need for more comparisons between modeled and measured discharge estimates, and a need for additional methods to measure the locations, and the rates of discharge.
Seepage meters have been used to quantify groundwa-ter discharge below the wagroundwa-ter surface for many years (Lee, 1977). However, at their best, seepage meters only yield an average discharge rate spanning the small area of deploy-ment (typically<1 m2). Because discharge is often hetero-geneous, many seepage meters are needed to yield discharge estimates representative of a large area.
Yet another approach for quantifying the flux of SGD in-volves the use of natural tracers. Foremost among these are the radioisotopes radium and radon. Each of these el-ements has been used as a tracer of groundwater discharge in the coastal zone because each is enriched in groundwa-ter, relative to surface wagroundwa-ter, often by two to three orders of magnitude (Burnett and Dulaiova, 2003). Both radium (Ra) and radon (Rn) are members of the238U decay series. Spanning the most recent tens to hundreds of thousands of years, the lineage of radon and radium is as follows: 230Th (t1/2=75 000 years) decays to226Ra (t1/2=1600 years) which in turn decays to222Rn (t1/2=3.8 d). In this work we focus on the use of radon, primarily because radon behaves conserva-tively spanning the salinity range from freshwater to seawa-ter. This simplifies coastal zone interpretations where large salinity gradients are common. Furthermore, the short half life of radon ensures that groundwater-derived radon, unlike low-salinity water, will only persist close to the location and time of actual discharge. Finally, by quantifying the flux of radon to coastal waters and the radon content of the local groundwater, an estimate of SGD can be derived, as will be elaborated later in this paper. One strength of this approach is that measurements of the radon flux to surface waters inte-grate over a large area; hence, SGD estimates inferred in this way integrate over the same large area.
It is worth noting that the use of radon as a tracer of groundwater discharge to surface waters is not new, dating to work by Ellins et al. (1990). However, the field has been ad-vanced in recent years by new technologies permitting con-tinuous radon measurements using the RAD7 radon analyzer (Burnett et al., 2001; Burnett and Dulaiova, 2003).
This paper describes an intercomparison of several meth-ods of quantifying SGD, carried out in a small coastal pond. We first derive independent estimates of SGD based on a simple salt mass balance for the pond, based on radon, and based on seepage meter data. Each of these constraints is further evaluated with a box model that attempts to recon-cile rates, and locations of discharge, with careful accounting of sources and sinks of radon and salt. In addition, nutrient fluxes from groundwater to Salt Pond are estimated and com-pared with fluxes from other locations.
2 Sampling locations and methods
area of 82 200 m2, a maximum depth of roughly nine me-ters and a mean depth of 3.4 m (Anderson and Stolzenbach, 1985). There is no surface runoff to the pond, however there is a storm drain that extends from below Highway 6, near the pond. Salt Pond is connected to Nauset Marsh by a chan-nel that is roughly 30 m wide at low tide, 350 m long, and 0.6 m deep at the thalweg (low point) at low tide. The tidal range is roughly 1.5 m. At low tide, some of Nauset Marsh is subaerial, but a region south of the channel, Salt Pond Bay, remains inundated.
The following brief summary of the hydrogeologic set-ting of Salt Pond is derived from Masterson (2004) and Col-man and Masterson (2004)1, to which we refer the reader for greater detail. Annual rainfall on the outer Cape aver-aged 122 cm yr−1(Masterson, 2004). Roughly 45% of this is presumed lost to evapotranspiration prior to reaching the water table (Masterson et al., 1998). Groundwater flow to Salt Pond is derived from the Eastham lens of the Lower Cape Cod aquifer, which is hosted by sediments deposited during the last glacial period that range in size from clay to boulders. The hydraulic conductivities range from 0.0035 cm s−1 in clay to 0.07 cm s−1in gravel, with the ratio of hor-izontal to vertical conductivity ranging from 5:1 in coarse material to 100:1 in fine-grained material. The average hy-draulic gradient between the top of the Eastham lens and Salt Pond is 0.0017 m m−1. The gradient adjacent to Salt Pond is presumed to be significantly larger than this figure, however (Colman and Masterson, 2004), due to slopes adjacent to the shoreline.
Between 28 June and 2 July 2004, radon, salinity, tem-perature and water depth were measured within the channel between Salt Pond and Nauset Marsh. Radon measurements were carried out from a raft that was anchored at the northern end of the channel (Fig. 1) using methods similar to those de-scribed in Burnett et al. (2001). Briefly, the method involves pumping water at a flow rate of∼2 L min−1, equilibrating the radon between the water and gas phases, and measuring 218Po, a decay product of radon, using a RAD7 radon detec-tor (Burnett et al., 2001).
The pump failed on a few occasions when an inline strainer (0.5 mm pore size) clogged due to the presence of significant algal biomass. As a result, no radon data were obtained during these intervals when there was no water cir-culation. However, the precise times when the pump failed could be determined after the experiment as times when the temperature measurements of the water pumped for radon measurements (thermistor exposed to air during pump fail-ure) differed from temperature measurements from the CTD (in the channel) by more than a few tenths of a degree.
A weather station (Onset HOBO), also attached to the raft, recorded wind speed at 5-min intervals using a propeller-type 1Colman, J. A. and Masterson, J. P.: Transient nutrient load
simulations for a coastal aquifer and embayment, Cape Cod, Mas-sachusetts, Environ. Sci. Technol., submitted, 2004.
anemometer mounted at a height of 2.3 m above the water surface. Wind speeds were converted to a height of 10 m following the method of Donelan (1990), assuming a neu-trally stable boundary layer, a logarithmic wind profile and a drag coefficient at 10-m height of 1.3×10⁻¹ (Large and Pond, 1981).
Salinity (S) and temperature (T) were measured in a va-riety of locations and times. The salinity, temperature and depth of the water in the channel were measured and logged every 5 min using a YSI 600XLM Sonde positioned 23 cm above the channel bottom in water∼0.6 m deep at low tide, roughly 8 m towards Nauset Marsh from the raft position. The calibration of the YSI salinity data was carried out using discrete samples analyzed at the Woods Hole Oceanographic Institution (WHOI) CTD calibration facility using a Guild-line Autosal 8400-B. Vertical profiles of salinity and temper-ature were assessed hourly within the channel during a 12-h period on 1 July. Vertical profiles of temperature, salinity and dissolved O2 concentrations within the pond were also carried out on four separate days during the study.
Groundwater samples were collected using a drive-point piezometer. Water was pumped using a peristaltic pump at flow rates of ∼200 mL min−1, and S, T and dissolved oxygen values were measured using a YSI 600XLM Sonde and recorded. Radon samples were collected, unfiltered, in 250 mL glass bottles by overflowing with three times the bottle volume. Radium samples were collected by pump-ing 5–10 L of water through MnO2-coated fibers (Moore, 1976). Groundwater nutrient samples, as well as surface-water nutrient samples, were collected in a syringe and fil-tered through a 0.45µm filter into a 15-mL bottle. All nutri-ent samples were kept on ice after collection and were frozen within 10 h. All apparatus for collection, filtration and stor-age of nutrient samples were acid-washed prior to use.
Radon analyses of groundwater samples were carried out using a RAD7 radon detector equipped with a sample sparg-ing device that attached directly to the sample bottles. These measurements were carried out typically within a few hours, but no later than two days, after collection. All activities were decay-corrected to that of the sampling date and time. Radium analyses were carried out using a well-type gamma detector on combusted samples, calibrated versus a standard prepared from a226Ra solution from NIST.
17 19 21 23
0 1 2
0 1 2 3 4 5
T (°C)
Tidal Height
(m) Day
T
tide c)
29.5 30 30.5
31
0 1 2
0 1 2 3 4 5
S HeightTidal
(m) Day
S
tide b)
0 100 200 300
0 1 2
0 1 2 3 4 5
Rn
(Bq m-3
)
Tidal Height (m) Day
Rn
tide a)
0 5 10
0 1 2 3 4 5
U
10
(m s-1
)
Day d)
29 30
0 1 2
0 1 2 3 4 5
S HeightTidal
(m) Day
S
tide e)
August 4-6, south end of channel
Fig. 2. (a)Radon,(b)salinity,(c)temperature, and(d)wind speed data from 28 June to 22 July 2004, from the channel between Salt Pond and Nauset Marsh (location shown in Fig. 1). Also shown are salinity data from the period 4–6 August,(e)collected at the south end of the channel. The integer day values correspond to midnight. Channel water depth at the measurement point (a measure of tidal height) is also shown on a-c as a dashed line.
to those described by Shaw and Prepas (1989). Due to the limited number of seepage meters, no measurements were carried out in locations where water depth at low tide was greater than 1 m.
3 Results
The tidal range varied from 0.7 to 1.5 m during the course of the study (Figs. 2a–2c), with spring tides occurring one day after completion of the study (2 July). Wind speeds were low, typically less than 6 m s−1(U
10=wind speed at 10 m height) during the day, decreasing to extremely low values at night (Fig. 2d).
Salt Pond was weakly stratified during the study, with the pycnocline depth of roughly one meter and surface water salinities ranging from 30.4 to 30.8, typically 0.1–0.5 psu less saline than the deep waters of the pond. Surface water temperatures ranged from 22 to 24◦C, while bottom-water temperature was close to 19◦C. The bottom water remained
oxic throughout the study, with dissolved oxygen concentra-tions close to 4 mg L−1(50% of saturation).
Radon activities were measured every half hour in the channel. Values reached maxima of 250–300 Bq m−3(15– 18 dpm L−1)after low tide, decreased rapidly to minima of ∼80 Bq m−3(5 dpm L−1)near high tide, and reached inter-mediate values of 100–150 Bq m−3 (6–9 dpm L−1)during the falling tide (Fig. 2a). Salinity values in the channel con-sistently reached minimum values of 29.5–29.8, on average, 53±10 min after low tide. Salinity increased rapidly with ris-ing tide to maxima of∼30.8–31.1 at high tide, and decreased to values of∼30.5 during the falling tide (Fig. 2b). It is worth noting that the radon maxima occurred∼19±7 min after the salinity minima due to a combination of time required for equilibration of the radon signal in water with the radon in air and time required for ingrowth of218Po (t1/2≈3 min), the radon decay product that is actually measured (see Burnett et al., 2001). This type of delay in achieving equilibrium of the 218Po signal has been discussed elsewhere, as well (Dulaiova et al., 2005). For the purpose of consistency with salinity and other data we shifted the time of each radon measurement throughout this work to a value 20 min earlier than measured to correct for this delay. As will be apparent later in this work, this shift has no significant impact on our interpreta-tions. Changes in channel temperatures were less consistent than changes in salinity and radon values. Typically, wa-ter inflowing from Nauset Marsh was colder than outflowing water, but values were heavily influenced by daytime heating and nighttime cooling.
Temperature and salinity data both suggest the channel was well-mixed vertically at virtually all times. Spanning the four-day study, water temperatures measured ∼23 cm from the bottom of the channel were indistinguishable from the temperature measurements carried out on water pumped from a depth of 30 cm, with the exception of the intervals when the pump stopped due to clogging. In addition, during a 12-h period of hourly vertical profiles of temperature and salinity in the channel, surface-water salinity was demonstra-bly lower than deep water salinity during only one of the pro-files. This occurred just after high tide, when surface-water maintained salinity 0.1 psu lower than deep water.
A total of 57 groundwater samples were collected near the sites of seepage meter deployment (Fig. 1). Fresh groundwater samples (S<1) maintained radon activities of 9400±4200 Bq m−3 (1 sigma), while saline groundwater samples (2<S<30) maintained activities of 4000±1900 Bq m−3)(Fig. 3).
4 Discussion
some unanticipated complexities. Some minutes after low tide, there is consistently a minimum in salinity and a maxi-mum in radon activity, which strongly suggest inflow of low-salinity groundwater. There are three pieces of evidence that suggest this event is caused by groundwater discharge to a site south of the pond (either the channel or adjacent Salt Pond Bay, or both), rather than to the pond. First, seepage directly into the channel was observed at more than one lo-cation during low tide, in the form of visible water flow from exposed sediments. Second, the salinity minimum, measured within the channel near Salt Pond, occurred 53±10 min af-ter the low tide, when the tide had risen 9±3 cm. This sug-gests that the low-salinity, high-radon water was accumulat-ing throughout the channel and/or Salt Pond Bay at low tide and was displaced only when the incoming tide carried high-salinity, low-radon water into Salt Pond from Nauset Marsh. Third, during a later sampling period (4–6 August), similar salinity minima were observed roughly 30 min after low tide at the southern end of the channel (Fig. 2e). This may also suggest that some of this freshened discharge is occurring in adjacent Salt Pond Bay.
4.1 Multiple constraints on SGD
Any attempt to quantify SGD benefits from estimates derived by a variety of independent means because every approach has strengths and weaknesses. In this work, we estimate SGD using simple calculations based on salinity, radon and seepage meters. We later use a box model to reconcile dif-ferent estimates. For the approaches using radon and salt, we take advantage of the narrow channel connecting Salt Pond to Nauset Marsh (Fig. 1) to optimize the accuracy of the mass balances for the pond. This approach recognizes that we can more reliably measure the flux of radon and salt to and from the pond through the channel, than the influx of radon, or low-salinity water to the pond via groundwater, which is dif-fuse and spread out over a large area.
The flow of water in and out of Salt Pond was assumed to be driven solely by tidal fluctuations, which was estimated by multiplying the measured tidal height variations by the sur-face area of the pond. The pond sursur-face area changed accord-ing to the bathymetry presented in Anderson and Stolzen-bach (1985), extrapolating the relationship between area and tidal height to the high tide mark. Current speed was esti-mated from this flow estimate and the cross-sectional area of the channel, solely for the purpose of estimating the im-pact on gas exchange (this turns out not to be important, as will be shown later). This approach ignores the effects of wind, which is known to affect circulation in shallow estu-aries. However, the presence of a narrow constriction at the mouth, such as exists in Salt Pond (Fig. 1) greatly dimin-ishes any impact of the wind on water flow in and out of an estuary (Geyer, 1997). Furthermore, wind speeds were low during the study (Fig. 2d).
0 10,000 20,000
0 10 20 30
Rn
(Bq m- 3)
Salinity mean, fresh
mean, saline
Fig. 3. Groundwater radon activities plotted versus salinity. One-sigma error bars are indicated for both freshwater (S<1) samples (red) and saline (S>2) samples (blue). It is worth noting that the mean for freshwater samples collected within 1.5 m of the sediment surface was 7200±800 Bq m−3(not shown).
4.1.1 Salt balance calculations
One constraint on the discharge of fresh groundwater to the pond is derived from the salt balance. The discharge of fresh groundwater to the pond itself would result in reduced salin-ity of outflowing water compared to inflowing water. The four-day experiment spanned more than two pond residence times (∼1.5 d as defined by pond volume/daily outflow), hence the change in salt storage should have little impact on the average difference. If we ignore evaporation for the mo-ment and assume that fresh groundwater is the only source of fresh water to the system, we can estimate the fresh ground-water discharge for each period of tidal outflow according to:
fresh groundwater discharge(m3d−1)
= Sin−Sout
Sin
•outflow(m3d−1)
where:
– Sinis the volume-weighted salinity of the inflowing wa-ter;
– Soutis the volume-weighted salinity of the outflowing water;
– “outflow” is the outflow of water from Salt Pond (m3 d−1).
0
100
200
300
30 31
0 1 2 3 4 5
Rn
(Bq m-3
) S
Day S
Rn
b) 30 31
0 1 2
0 1 2 3 4 5
S HeightTidal
(m)
Day S
tide a)
Fig. 4. (a)Channel salinity data highlighting waters during outflow from (blue circles) and inflow into (red triangles) Salt Pond, assum-ing flow direction is entirely determined by tidal height.(b) Chan-nel radon and salinity data plotted on the same figure, with radon axis reversed to highlight similarities between radon and salinity datasets.
to the mean salinity of∼30 suggests a number of things: 1) clearly water is fairly well mixed in the pond, since this small difference is observed; 2) neither the slight stratification of the pond, nor the influence of evaporation, can necessarily be neglected when evaluating fresh discharge to the pond via this salt balance approach. We will re-examine these issues with the box model later in this work, yet for the moment we will accept the mean estimate of fresh discharge thus de-rived of 400 m3 d−1. Stratification could reduce this esti-mate, while evaporation within the pond could increase it.
It is important to note, however, that this approach assumes that water starts flowing into the pond just after low tide. This salt balance calculation therefore includes with the incoming water the vast majority of the prominent salinity minima that clearly reflect discharge of freshened groundwater (Fig. 4a). Because the salinity values during these minima are the low-est observed, and because they maniflow-est themselves just af-ter every low tide, they clearly reflect discharge of freshened groundwater occuring in the vicinity of the channel during each low tide. It is possible that this low-salinity discharge occurs at other times as well. Thus, the above calculation overlooks the input of this groundwater, yet this water is clearly cycled through Salt Pond. This current treatment is therefore very sensitive to assumptions of where this salinity minimum originates. We will address this complication later in this paper, and demonstrate that our estimate of the overall discharge in the vicinity of the pond is not very sensitive to assumptions regarding whether the salinity and radon fluctu-ations observed are driven by groundwater discharge to the pond, the channel or Salt Pond Bay.
4.1.2 Radon-based SGD estimate
In principle, we should be able to do a radon mass balance, much as we did for salt. However, the absolute timing of the radon fluxes to the water column is difficult to determine precisely because of uncertainties in the time required for
equilibration of the RAD7 signal (see methods section). Fur-thermore, because radon was measured only every 30 min, and the radon maxima are brief, any attempt at a radon mass balance would be subject to some errors caused by the use of 30-min averages. However, the similarity in shape be-tween radon and salinity data (Fig. 4b) strongly suggests both are controlled by the same processes, and that the volume-weighted radon activity of the inflow is similar to that of the outflow (outflow activities slightly lower due to gas exchange and decay losses). This means that the high-radon water ob-served during inflow, just after low tide, is the primary source of radon to the pond. This water mixes with the low-radon water flowing in near high tide to yield the intermediate-radon water exported from the pond. This means, in turn, that the radon inputs to the Salt Pond system, and the radon-based discharge estimate (calculated below), reflect inflow of reasonably low-salinity groundwater.
We can constrain the salinity of the discharge causing the salinity minima from the data. The sharp salinity minima near low tide clearly indicate this discharge is substantially fresher than the ambient water. If we accept for the mo-ment that this groundwater discharge is fresh, the typical salinity depression of 0.7 psu (2.3% of 30), and the typi-cal Rn activity increase of 150 Bq m−3, would require that the radon content of groundwater be roughly 6400 Bq m−3 (150×100/2.3). This figure is only slightly lower than that observed in the shallowest fresh groundwater samples (7200 Bq m−3at depth≤1 m) and suggests that this radon-bearing discharge could be entirely fresh. However, a larger dis-charge of brackish water with lower radon content could achieve the same effect. We can place a reasonable upper limit on the salinity of this discharge in the following way. For a given kilogram of water, achieving the typical radon increase of 150 Bq m−3 observed just after low tide would require an inflow of 0.038 kg of the saline groundwater end-member (with 4000 Bq m−3). Achieving the typical ob-served salinity depression of 0.7 psu from this inflow would require the salinity of the inflowing groundwater to be 11 psu. Thus, this discharging groundwater must have a salinity less than 11, and it could have a salinity of zero.
simple. Assuming discharge is fresh,
SGD (m3d−1)=tidal outflow×Rnoutflow/Rngw =170 000 m3d−1×130 Bq m−3/9400 Bq m−3 =2350 m3d−1.
Note that this value would increase (by less than 50%, as will be examined later) if corrections were applied for gas exchange or decay, and it would decrease (as a measure of discharge to the pond itself) if some of the radon in the pond was derived from the channel or from Salt Pond Bay, or if some of the radon was cycled repeatedly into and out of the pond through the channel. Assuming this discharge is saline (5<S<30), the discharge estimate would rise to 5500 m3d−1, based on the fairly constant radon activity of saline groundwater of 4000 Bq m−3(Fig. 3) (also not yet corrected for decay or gas exchange). No matter how these numbers are corrected for gas exchange and decay, the radon-based discharge to the waters in the vicinity of Salt Pond is clearly considerably greater than the freshwater discharge estimated based on the salt balance. We will revisit these figures later with the aid of a box model.
4.1.3 Seepage meter results
Seepage meter data from Salt Pond offer an additional con-straint on groundwater discharge. Seepage meters have been criticized as prone to artifacts (Shaw and Prepas, 1989; Shinn et al., 2002). However, recent intercomparisons between seepage meters and other means of estimating SGD suggest seepage meters can give reasonable SGD estimates when used properly (Corbett and Cable, 2003; Lambert and Bur-nett, 2003; Taniguchi et al., 2003).
In this work, a total of ten seepage meters were deployed on two successive days. On the first day, seepage meters were deployed in three transects parallel to the shore, at an average water depth of 0.5 m below low tide (transect spread over∼10 m within∼5 m of shore at low tide). On the sec-ond day, the seepage meters were deployed in three transects perpendicular to shore, at water depths ranging from∼0.2 to ∼0.7 m below low tide (all within∼8 m of shore at low tide; Fig. 1). One important feature of the data is that there was considerable variability among the meters (Figs. 5a and 5b), particularly when the seepage meters were deployed in three transects perpendicular to the shore (Fig. 5b). Another fea-ture of note is that there is always discharge into the pond, even when the tidal height is 0.5 m above low tide. How-ever, for many of the seepage meters, but not all, discharge increases slightly at low tide (Figs. 5a and 5b). One impor-tant trend from the transects perpendicular to shore helps to explain some of the variability. In two of the three tran-sects, greater discharge (≥20 cm d−1)occurred at shallow sites (closer to shore) than at deeper sites (farther from shore) (Fig. 5c). Flow was greatly diminished (to<10 cm d−1)at
0 10 20 30 40 50
0 10 20 30 40 50 60 70
Fl
o
w
(
cm
d
-1 )
water depth (below low tide, cm) c)
0 10 20 30 40 50
0 0.2 0.4
10:00:00 12:00:00 14:00:00 16:00:00
Perpendicular to Shore
Fl
o
w
(
cm
d
-1 )
ti
d
a
l
h
e
ig
h
t
(m
)
tidal height
b) 0 10 20 30 40 50
0 0.2 0.4
9:00:00 11:00:00 13:00:00 15:00:00
Parallel to Shore
Fl
o
w
(
cm
d
-1 )
ti
d
a
l
h
e
ig
h
t
(m
)
a)
tidal height
Fig. 5.Groundwater flow velocity estimated using seepage meters aligned in transects parallel to shore(a), and perpendicular to shore (b). Also shown is tidal height (a, b). The dependence of the aver-age seepaver-age velocity on water depth (below low tide) is also shown from transects perpendicular to shore(c), with each transect noted by a different color symbol.
inflow outflow
Salt Pond
Nauset Marsh gas
exchange
decay groundwater
1 2 3
4 5
Salt Pond Bay
Fig. 6.Schematic indicating the delineation of boxes for the model and the major sources and sinks of radon in Salt Pond. The sources and sinks in the other boxes are treated as well by the model, but are not illustrated.
did no seepage meter measurements in either the channel or Salt Pond Bay. At this point we thus have three independent constraints on the discharge of groundwater which we will try to reconcile with a box model.
4.2 Seven-box model
For the purposes of the model, the Salt Pond system is di-vided into seven boxes (Fig. 6). Salt Pond itself is treated as one box, while the channel connecting Salt Pond to Nauset Marsh is represented by five adjacent boxes. The five boxes are included to allow for a realistic, gradual transition be-tween Salt Pond, with reduced salinity, and Nauset Marsh, with higher salinity (note that this treatment is different from the 2-box model used in a previous version; see Crusius et al., 2005). A final box is included to represent the volume of Nauset Marsh water immediately adjacent to the channel (referred to as Salt Pond Bay) that can be flushed into Salt Pond during incoming tides. Water flowing out of the pond to Nauset Marsh also passes through this box; thus, this box also allows recycling of outflowing pond water back into the pond, and is a possible location of groundwater discharge that can be carried into Salt Pond. The volume of this box will be constrained from the fit of the data to output from model sensitivity tests. Nauset Marsh seaward of Salt Pond Bay is not actually modeled; rather, it is treated as an infinite reservoir of high-salinity, low-radon water adjacent to and further seaward of Salt Pond Bay.
4.2.1 Model assumptions
Salt Pond surface area varies with tidal height in the model, based on the bathymetric map of Anderson and Stolzenbach (1985), according to: Salt Pond area (m2)=838t h2−15 700t h+71 714, where t h=tidal height (m) above low tide. The total volume of the pond is as-sumed to be 250 000 m3at low tide and 380 000 m3at high tide. The channel is 350 m long (70 m/box) and 0.6 m deep at the thalweg (low point). The cross-sectional area of the channel was measured at different tidal heights at the
lo-cation of the RAD7 monitor (Fig. 1). In the model this is parameterized according to: channel cross-sectional area (m2)=7.11cd2+14.26cd, wherecd=channel depth (m) at the low point (thalweg). This relationship is assumed for the full length of the channel. The volume of the channel is roughly five times greater at high tide than at low tide.
This treatment ignores the weak stratification observed within Salt Pond. While this is certainly an oversimplifica-tion, we felt that this was a more defensible modeling strat-egy than to divide Salt Pond into a shallow and deep box and try to model, within the limitations of a simple box model, the complex processes of mixing and entrainment that ex-change water between the surficial and deep waters. How-ever, we did create just such a model that could reproduce the observed weak stratification. The discharge estimates from this model with a weakly stratified Salt Pond were only 15% lower than those we will present for the well-mixed pond model, a difference that is within the uncertainty estimate for this approach.
We can summarize the key model assumptions as follows (an error analysis is presented later). Pond inflows and out-flows are driven entirely by tidal height fluctuations (which were measured). The radon content and salinity of Nauset Marsh waters are assumed constant (see Appendix 1 for a full list of parameter values). Each of the five channel boxes is assumed well-mixed (see results section). For the sake of initial simplicity, groundwater salinity is assumed to equal zero (this assumption will be assessed later). The average radon activity measured in fresh groundwater (9400±4000 Bq m−3) is assumed representative of groundwater inflow (n=∼20). It is worth noting that there was less uncertainty in the fresh groundwater radon activities collected within 1.5 m of the sediment surface (7200±800 Bq m−3, n=7), but for now we will assume the average value of all fresh ground-water estimates. Radon diffusion from sediments is assumed to be negligible, which will be demonstrated later. Evapora-tion is assumed constant at 72 cm/year, the figure estimated for July 2004 by the NOAA climate prediction office. We ignore precipitation, which was negligible during the study. We also ignore changes in radon and salt storage within Salt Pond during the four-day study. The short residence time of the pond, together with the very consistent salinity and radon data measured within the channel, suggest that no major stor-age changes occurred.
considered cumulative, and:
k600 current=1.719w0.5h−0.5,
wherewis the water current (cm s−1)andhis the depth (m). k600 wind=0.45µ1.6(Sc/600)−a,
(Turner et al., 1996), whereµis wind velocity (m s−1),Sc is the Schmidt number for radon at the measured water tem-perature, anda is a variable exponent that equals 0.6667 for
µ≤3.6 m s−1and equals 0.5, whenµ>3.6 m s−1. The num-ber 600 is the Schmidt numnum-ber for CO2at 20◦C, a common reference point.
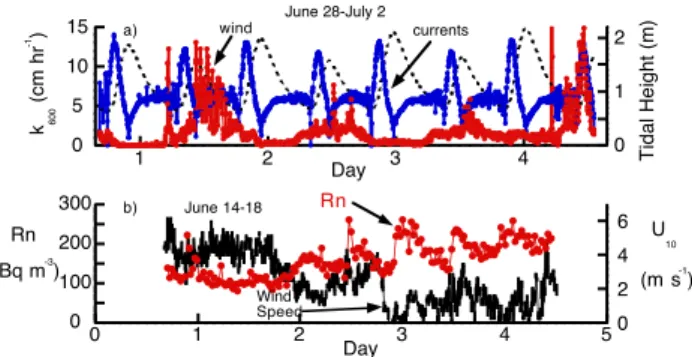
In the channel, where estimated current speeds reached values of 63 cm s−1, the average gas transfer velocity due to currents is roughly three times that predicted due to wind (Fig. 7a). In the pond and in Salt Pond Bay, gas exchange was assumed to be due solely to wind and was estimated using the wind speed and Schmidt number dependence mentioned above. This is admittedly an oversimplification. However, the water depth is greater, and current speeds much smaller, in Salt Pond and Salt Pond Bay, compared to the channel. Each of these features would serve to diminish significantly gas transfer due to currents. Hence, we are fairly confident that our estimates of gas transfer velocity are not far off. Furthermore, radon measurements carried out on Salt Pond surface waters reveal a strong inverse relationship between radon activities and windspeed (Fig. 7b), which implies an important impact of wind speed on gas transfer velocities.
The model equations are summarized below. Model pa-rameter values are based primarily on measurements and ob-servations. The true unknowns include the magnitude of the groundwater flows to the pond, the channel and Salt Pond Bay, and the size of any region seaward of the channel (Salt Pond Bay) that is flushed towards the pond on incoming tides. For bookkeeping purposes, each location modeled is given a number according to:gw=1, pond=2, channel=3–7, Salt Pond Bay=8, Nauset=9.
dS2
dt =(Q32(S3−S2)+Q23(S2−S3)+Q12(S1−S2))/(V2) (1)
dRn2 dt =
Q32(Rn3−Rn2)+Q23(Rn2−Rn3)+ Q12(Rn1−Rn2
−λRn2V2− −kA2Rn2)/V2 (2) dS3
dt =
Q43(S4−S3)+Q23(S2−S3)+Q13(S1−S3)
/V3 (3)
dRn3 dt =
Q43(Rn4−Rn3)+Q23(Rn2−Rn3)+ Q13(Rn1−Rn3)−λRn3V3−kA3Rn3
/V3 (4)
. . . .
dS8 dt =
Q87(S8−S7)+Q78(S7−S8)+Q18(S1−S8)
/V8 (13)
0 100 200 300
0 2 4 6
0 1 2 3 4 5
Rn
(Bq m-3)
U 10 (m s-1
)
Day Rn
Wind Speed b) June 14-18
0 5 10 15
0 1 2
1 2 3 4
k 600
(cm
hr
-1 )
Tidal
Height
(m)
Day
a) wind currents
June 28-July 2
Fig. 7. (a)Gas transfer velocities, corrected to Sc=600, as estimated for the channel and the pond (see text). (b) Surface-water radon data, and wind speeds (10-m height) from the center of the pond, from the week of 14–18 June.
dRn8 dt =
Q87(Rn8−Rn7)+Q78(Rn7−Rn8) +Q18(Rn1−Rn8)−λRn8V8−kA8Rn8
/V8 (14)
whereSi=salinity in boxi.
Rni=radon activity in boxi(Bq m−3).
Qij=water flux from boxito boxj(m3d−1), estimated from
the measured tidal height changes and the volume functions described above for the pond and the channel.
λ=222Rn decay constant=0.181 d−1.
Vi=volume of boxi (m3), varying with tidal height as
de-scribed above.
k=gas transfer velocity (m d−1).
A2=surface area of Salt Pond = 82 200 m2at low tide. A3−7=surface area of channel box (m2).
A8=surface area of Salt Pond Bay (m2). timestep=2.5 d (5 d led to numerical instability).
For simplicity we also ignore the impact of precipita-tion. A total of 2.5 mm of rain fell on 29 June. This may have contributed to low salinity values observed during that day. However, the precipitation measurement was carried out many kilometers away, hence it may not be representative of the rainfall at our sampling site. Furthermore, we do not know how much direct runoff there was to the pond, nor do we know the timing and magnitude of inputs from runoff and shallow groundwater flow. For these reasons we ignore the effect of rainfall.
29 30 31
0 1 2
1 2 3 4
Salinity
Tidal
Height
(m)
Day c)
0 100 200 300 400
0 1 2
1 2 3 4
Rn
(Bq
m
-3 )
Tidal
Height
(m)
Day b)
29 30 31
0 1 2
1 2 3 4
Salinity
Tidal
Height
(m)
Day a)
0 200 400
0 1 2
1 2 3 4
Rn
(Bq
m
-3 )
Tidal
Height
(m)
Day d)
Fig. 8. Box model simulation of channel salinity and radon data assuming:(a), (b)Fresh groundwater is discharged to the channel at tidal heights within 10 cm of low tide, at a rate of 300 m3d−1, with no discharge to the pond;(c), (d)Fresh groundwater is discharged to the pond at all tidal heights at a rate of 400 m3d−1, and to the channel at a rate of 300 m3d−1, only within 10 cm of low tide. The data are indicated by black symbols, the channel simulations by red lines, while the “Salt Pond Bay” simulation is indicated by blue lines and diamonds. Tidal height is shown by a dashed line.
4.2.2 Model results
We will use the model as an aid to quantification of the fluxes of submarine groundwater to Salt Pond, to the channel, and to Salt Pond Bay, based on model fits of the measuredSand Rn data. There are several aspects of the data that can be used to test the “fit” of any given simulation: 1) the magnitude of the salinity decrease and radon increase near low tide; 2) the timing of this feature. In the data, theS minimum occurs ∼50 min after low tide, during the incoming tide. If this event occurs too early in model, the modeled flow under-represents the true inflow of SGD-influenced water, because it occurs as the flow is increasing with incoming tides. If this event oc-curs too late, the modeled flow over-represents the true flow;
0 100 200 300 400
0 1 2
1 2 3 4
Rn
(Bq
m
-3 )
Tidal
Height
(m)
Day
b) 28.5
29 29.5
30 30.5
31
0 1 2
1 2 3 4
Salinity
Tidal
Height
(m)
Day
a)
Fig. 9. Box model simulation of channel salinity and radon data assuming:(a), (b)Fresh groundwater is discharged to the pond at all tidal heights at a rate of 2100 m3d−1, and to the channel at a rate of 300 m3d−1, only within 10 cm of low tide. The data are indicated by black symbols, the channel simulations by red lines, while the “Salt Pond Bay” simulation is indicated by blue lines and diamonds. Tidal height is shown by a dashed line.
3) the difference between the volume weightedSinandSout. This is related to the timing of theSminimum; 4) the change from high-S, low-Rn water at high tide to lower-S, higher-Rn water during falling tide. This difference reflects the subma-rine groundwater discharge to either the pond or to waters that are carried into the pond during tidal inflows. Two ad-ditional features of the data that will be explained later also offer insight into processes, including: 5) the relative heights of the successiveSmaxima at high tide; and 6) the slope ofS
during the falling tide. Note all parameters are summarized in Appendix 1.
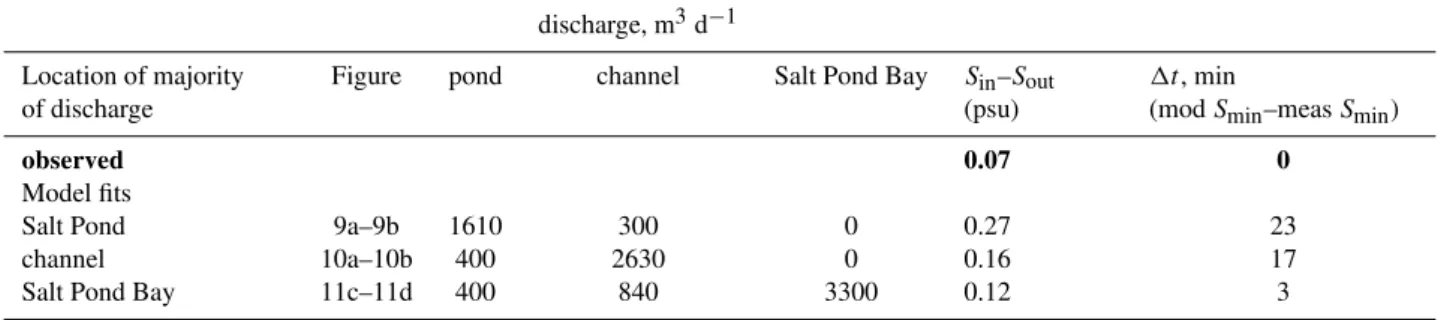
Table 1.Comparison between: a) the observed and modelled values of the volume-weightedSin–Sout, and b) the time difference between measured and modelledSminimum.
discharge, m3d−1
Location of majority of discharge
Figure pond channel Salt Pond Bay Sin–Sout (psu)
1t, min
(modSmin–measSmin)
observed 0.07 0
Model fits
Salt Pond 9a–9b 1610 300 0 0.27 23
channel 10a–10b 400 2630 0 0.16 17
Salt Pond Bay 11c–11d 400 840 3300 0.12 3
Table 2.Error analysis for radon flux from pond (and thus the SGD estimated based on this figure).
Radon budget term (Salt Pond) Value, Bq m−2d−1 Uncertainty, Bq m−2d−1 % uncertainty
pond outflow 250 50
average gas exchange loss 53 27
average decay loss (uncertainty in residence time) 74 25
radon content of groundwater * 190 50
degree of repeated Rn recycling * 190 50
Total Rn flux and uncertainty 380 270 70
* The impact of uncertainties in the radon content of groundwater and in the degree of repeated radon recycling are given as percentage uncertainties for the overall flux estimate. These are translated into units of Bq m−2d−1based on the total radon flux value and included in the overall propagation of errors.
Model simulations invoking groundwater discharge to the pond as well, at a flow rate of 400 m3 d−1 (0.5 cm d−1)
implied by the salinity balance, achieve a slightly better fit (Figs. 8c and 8d), but clearly overestimate the salinity and underestimate the radon activity of the outflowing water. Model simulations with significantly higher discharge to the pond (1900 m3d−1; 2.5 cm d−1), fit both the magnitude of the low-tide event and the change between high tide and typ-ical outflow conditions (Fig. 9). However, the apparent good fit of these features could be misleading, because the timing of the S minima and Rn maxima are 23 min earlier in the model run than observed, and the modeled value ofSin–Sout is 0.27, much higher than the observed value of 0.07 (see Ta-ble 1). Both of these points suggest either that: 1) this timing difference results from an oversimplification of our model simulation, in which case greater discharge to the channel (and less to the pond) would be implied than accounted for in the model, or 2) greater discharge is occurring in Salt Pond Bay, and is brought into the pond with the incoming tide, than is modeled here.
One possible source of additional discharge seaward of the pond is the channel. We therefore ran a series of model runs assuming greater discharge occurred to the channel than as-sumed in Figs. 8c and 8d, by allowing discharge at all tidal
heights2. This model simulation invoking discharge of 400 m3d−1to the pond (0.5 cm d−1)and 2600 m3 d−1 to the channel (25 cm d−1)(Fig. 10) achieved a reasonable fit to: 1) the magnitude of theSminima and Rn maxima after low tide; 2) the difference inSand Rn values between high tide and ensuing outflow; 3) the downward trend inS values of-ten (but not always!) observed during falling tides. This fea-ture arises because the impact of discharge onSis progres-sively more pronounced as the flow is reduced; 4) the relative heights of theS maxima. These vary in the model, despite constantSassumed for Nauset Marsh, because the Salt Pond Bay box is better flushed, and hence more “Nauset-like”, dur-2The original submission of this manuscript (Crusius et al.,
0 200 400
0 1 2
1 2 3 4
Rn
(Bq
m
-3 )
Tidal
Height
(m)
Day
b) 28.5
29 29.5
30 30.5
31
0 1 2
1 2 3 4
Salinity
Tidal
Height
(m)
Day
a)
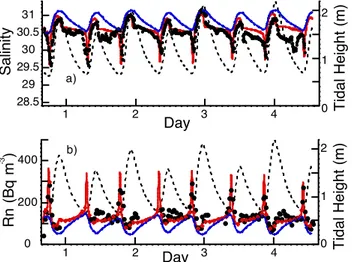
Fig. 10. Box model simulation of channel salinity and radon data assuming: (a), (b)Fresh groundwater is discharged to the pond at all tidal heights at a rate of 400 m3d−1, and to the channel at all tidal heights at a rate of 2600 m3d−1. The data are indicated by black symbols, the channel simulations by red lines, while the “Salt Pond Bay” simulation is indicated by blue lines and diamonds. Tidal height is shown by a dashed line.
ing an especially high tide, compared to a moderately high tide. Note that the results would not be significantly different if all 3000 m3d−1were discharged to the channel. Discharge required for a reasonable fit is greater than for the model run involving discharge primarily to the pond. This is because when discharge is primarily in the channel, some of this dis-charge is assumed flushed to Nauset Marsh during outgoing tides and lost from the system. These model fits (Fig. 10) still suffer from the same flaws mentioned earlier, that the
Sminimum occurs earlier than observed (now 17 min), and the modeled value of Sin–Soutis 0.16, still higher than the observed value of 0.07 (Table 1).
It is worth noting that the channel salinity does not behave in a consistent manner during falling tides and hence is diffi-cult to model with consistent model parameters. Sometimes salinity increases during the falling tide (day∼1.7), some-times it remains constant (day∼1.1, ∼2.7) and sometimes it decreases (day∼2.1, ∼3.2, ∼3.8). Decreases in salinity could be explained by the larger impact of groundwater dis-charge at lower tides, as flow decreases. However, if this were the correct explanation one would expect increases in radon activity at the same time. While gaps in the radon data limit our ability to assess this possibility fully, one in-terval of gradually lowering salinity during falling tide near day 3.8 shows no such corresponding increase in radon ac-tivity. Thus, the reasons for the inconsistent trends in salinity during the falling tides remain unclear.
Because discharge to the channel led to salinity minima earlier than measured, additional model simulations (Figs. 11 and 12) were carried out assuming discharge to Salt Pond
29 30 31
0 1 2
1 2 3 4
Salinity
Tidal
Height
(m)
Day
c) 0 200 400 600
0 1 2
1 2 3 4
Rn
(Bq
m
-3 )
Tidal
Height
(m)
Day
b) 29 30 31
0 1 2
1 2 3 4
Salinity
Tidal
Height
(m)
Day
a)
0 100 200 300 400
0 1 2
1 2 3 4
Rn
(Bq
m
-3 )
Tidal
Height
(m)
Day
d)
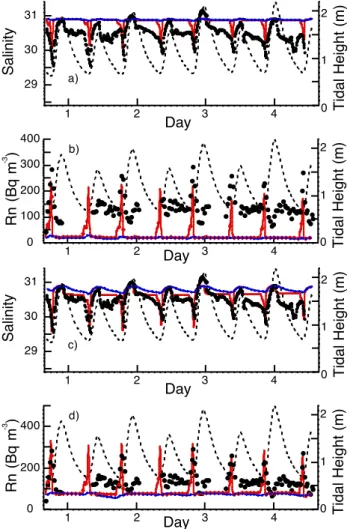
Fig. 11. Box model simulation of channel salinity and radon data assuming discharge to the pond, the channel and Salt Pond Bay, according to: (a), (b)fresh groundwater is discharged, at all tidal heights, to the pond at a rate of 400 m3d−1, no discharge to the channel and to Salt Pond Bay at a rate of 6000 m3d−1, Salt Pond Bay volume=5000 m3;(c), (d)fresh groundwater is discharged, at all tidal heights, to the pond at a rate of 400 m3d−1, to the channel at a rate of 840 m3d−1 and to Salt Pond Bay at a rate of 3300 m3d−1, Salt Pond Bay volume=15 000 m3. The data are indicated by black symbols, the channel simulations by red lines, while the “Salt Pond Bay” simulation is indicated by blue lines and diamonds. Tidal height is shown by a dashed line.
and Salt Pond Bay was∼7000 m3d−1(Appendix 1). We are reluctant to over-interpret such subtleties of the model fits to the data. However, taken at face value, this last result may suggest that some of the discharge is occurring seaward of the channel, in Salt Pond Bay.
One last model parameter that can influence the fit of the data, the degree of recycling of water between Salt Pond and Salt Pond Bay and the model-predicted flux estimate of SGD, is the volume of this Salt Pond Bay water seaward of the channel. This was also evaluated in a sensitivity test, vary-ing this volume from 5000 m3to 150 000 m3. These model results allow us to rule out the extremes of this range, either because the required model parameters are wildly unrealis-tic or because the model fits were poor. Model fits as well as parameter values are very reasonable when the Salt Pond Bay volume is in the range of 15 000–50 000 m3(Figs. 11c and 11d; Figs. 12a–12b). This volume range is thus most consistent with our observations.
It is worth noting that comparable fits to the data for each fresh groundwater discharge scenario above can be achieved assuming the salinity of the discharge is∼11 (not shown, in the interest of brevity). The required groundwater discharge increases by nearly a factor of two for these scenarios. These model-based discharge estimates, again, would be similar to the simple calculations made earlier based on the radon data, if we use the saline groundwater endmember radon activity in the calculations. Whether this discharge is fresh or brack-ish would affect the geochemical impacts of this discharge; however, it would not impact our assessment of the discharge rate of fresh groundwater, since this larger brackish discharge ultimately has a component of fresh discharge.
4.3 Reconciling the different SGD estimates
We can now summarize, and attempt to reconcile, the var-ious constraints on groundwater discharge to the Salt Pond “system”. The salt-balance estimate yields an estimate of freshwater discharge to the pond itself, and is thus the lowest value. Seepage meters reflect discharge only to the pond, and only to shallow sediments. That the seepage meter estimate is higher than the salt balance approach may indicate this shallow-water discharge is brackish, rather than fresh. The radon-based SGD estimate is even higher because it reflects discharge to the pond, as well as discharge to the channel and possibly Salt Pond Bay, that is carried into the pond with incoming tides. The box model reproduces both theS and radon data assuming only fresh groundwater discharge. Dis-charge of brackish groundwater (S<11) cannot be ruled out, however. The model-inferred discharge is higher than even the radon-based approach because it factors in the discharge to the channel and Salt Pond Bay that outflows to Nauset Marsh during outgoing tides, in addition to the discharge that flows into the pond with incoming tides.
The discharge rates based on radon and the box model-ing are reasonably similar, given the uncertainties in each
29 30 31
0 1 2
1 2 3 4
Salinity
Tidal
Height
(m)
Day
c) 0 100 200 300 400
0 1 2
1 2 3 4
Rn
(Bq
m
-3 )
Tidal
Height
(m)
Day
b) 28.5
29 29.5
30 30.5
31
0 1 2
1 2 3 4
Salinity
Tidal
Height
(m)
Day
a)
0 100 200 300 400
0 1 2
1 2 3 4
Rn
(Bq
m
-3 )
Tidal
Height
(m)
Day
d)
Fig. 12. Box model simulation of channel salinity and radon data assuming discharge to the pond, the channel and Salt Pond Bay, ac-cording to: (a), (b)fresh groundwater, at all tidal heights, to the pond at a rate of 400 m3d−1, to the channel at a rate of 1400 m3 d−1and to Salt Pond Bay at a rate of 5000 m3d−1, Salt Pond Bay volume=50 000 m3;(c), (d)fresh groundwater, at all tidal heights, to the pond at a rate of 400 m3d−1, to the channel at a rate of 210 m3d−1and to Salt Pond Bay at a rate of 12 000 m3d−1, Salt Pond Bay volume=150 000 m3. The data are indicated by black sym-bols, the channel simulations by red lines, while the “Salt Pond Bay simulation is indicated by blue lines and diamonds. Tidal height is shown by a dashed line.
0 200 400 600 800
0 1 2
1 2 3 4
Rn
loss
(Bq
m
-2 d -1 )
Tidal
Height
(m)
Day b) channel
0 200 400 600 800
0 1 2
1 2 3 4
Rn
loss
(Bq
m
-2 d -1 )
Tidal
Height
(m)
Day a) pond
Fig. 13. The radon loss terms for the pond(a)and the channel(b) assuming discharge to the pond, the channel and Salt Pond Bay, as in Fig. 11. Shown are losses due to outflow (red), gas exchange (blue), and decay (green), as well as the tidal height (dashed line
intermediate values compared to the full thirty-year record (data not shown). This may suggest that discharge during the period of our study was representative of the long-term mean used in the hydrologic model, although further work is necessary to evaluate this.
4.4 Error analysis
Model uncertainties are difficult to evaluate. However, we can attempt an assessment of the uncertainties in this ap-proach for estimating discharge from the uncertainties in each term that contributes to the overall radon mass balance. Uncertainties in the radon loss due to decay (due to uncer-tainties in pond residence time) and due to gas exchange do not contribute significantly to our overall uncertainty (Ta-ble 2), because these loss terms are fairly minor in the overall budget for the pond and for the channel (Fig. 13). It is worth noting that radon loss (in units of Bq m−2d−1)by gas ex-change and by decay from the channel is almost insignificant because of the very short residence time of water in the chan-nel, despite the fact that the gas transfer velocities (in units of cm h−1)assumed for the channel are considerably larger than for the pond (Fig. 7a). The largest uncertainties in the overall radon budget stem from the groundwater radon end-member (±50%) and from our estimate of the degree of recycling of Salt Pond water within Salt Pond Bay. We estimate an over-all uncertainty (1σ) of roughly 70% for the radon discharge estimate from the pond and therefore for the radon-derived groundwater discharge estimate for the waters that flow into the pond.
The loss terms for the pond and the channel must be com-parable in magnitude to the source terms for radon, in or-der to achieve mass balance. It is thus worth noting that typical diffusive inputs of radon in geologically similar
ar-eas are on the order of 1–10 Bq m−2 d−1 (Hussain et al., 1999; Schwartz, 2003), much lower than the overall inputs (Fig. 13a). We thus conclude that diffusive inputs from sediments are negligible. Recent work in a number of set-tings where groundwater advection is significant has come to similar conclusions (Lambert and Burnett, 2003; Schwartz, 2003).
4.5 Groundwater-derived nutrient discharge
merely add to the growing body of knowledge illustrating that groundwater-derived nutrient loads are a serious envi-ronmental problem on Cape Cod.
5 Summary and conclusions
Radon, salinity and seepage meter data collected during the early summer of 2004 all imply significant submarine groundwater discharge in the vicinity of Salt Pond, near Nau-set Marsh (MA). The narrow channel connecting Salt Pond to Nauset Marsh affords a means to construct mass balances for salt and radon that help to quantify this discharge. The salt balance implies discharge of 400 m3d−1or less to the pond. Simple radon outflow measurements, along with box model-ing, suggest either fresh groundwater discharge in the vicin-ity of∼3000–6000 m3 d−1, or brackish discharge (S<11) nearly twice as high. Much of the uncertainty in these es-timates stems from uncertainty in the volume of water just seaward of the pond from which waters can flow in during incoming tides. We conclude that this larger estimate of fresh discharge based on radon cannot be due to discharge of saline groundwater, because the simultaneous radon
Appendix 1 Salt Pond box model parameters.
Channel Channel Channel Chan Pond ChanPond ChanPond ChanPond ChanPond
only pond Hi-flo pond all z SPB5000 SPB50000 SPB150000
Figure 8a–8b 8c–8d 9a–9b 10a–10b 11a–11b 11c–11d 12a–12b 12c–12d
initial conditions
Pond Rn starting conc (Bq m−3) 20 70 120 100 110 110 120 145
PondSstartingS, psu 30.9 30.6 30.45 30.65 30.45 30.45 30.35 30.45
Salt Pond Bay startingS, psu 30.9 30.8 30.6 30.5 30.1 30.1 30.6 30.1
Salt Pond Bay starting Rn (Bq m−3) 20 70 90 130 100 100 90 100
Nauset Rn conc. (Bq m−3) 20 80 80 40 40 40 0 0
NausetS, psu 30.9 30.9 31 31.2 31.05 31.05 31.3 31.7
adjustable parameters
Rn,gw(Bq m−3) 9350 9350 9350 9350 9350 9350 9350 9350
S,gw 0 0 0 0 0 0 0 0
gw inflow to channel, m d−1at time of discharge 0.2 0.25 0.2 0.25 0 0.08 0.13 0.2
gw inflo, pond, m d−1at time of discharge 0 0.006 0.02 0.006 0.006 0.006 0.006 0.006
gw inflow to Salt Pond Bay, m d−1at time of discharge 0 0 0 0 1.2 0.22 0.1 0.08
evaporation, cm yr−1 72 72 72 72 72 72 72 72
water depth (m) above low tide for discharge to channel 0.1 0.1 0.1 all z all z all z all z all z
water depth (m) above low tide for discharge to pond − all z all z all z all z all z all z all z
water depth (m) above low tide for discharge to Salt Pond Bay − − − − all z all z all z all z
gw inflow to channel, m3d−1 300 370 300 2600 0 840 1370 2100
gw inflow to pond, m3d−1 0 400 1600 400 400 400 400 400
gw inflow to Salt Pond Bay, m3d−1 0 0 0 0 6000 3300 5000 12 000
combined gw input, pond + channel + Salt Pond Bay, m3d−1 300 770 1900 3000 6400 4500 6700 14 500
Salt Pond Bay area, m2 50 000 50 000 50 000 50 000 5000 15 000 50 000 150 000
Salt Pond Bay depth, low tide, m 1 1 1 1 1 1 1 1
Acknowledgements. For assorted logistical support we thank J. Portnoy and N. Finley of the National Park Service and H. Lind and his crew from the Eastham, MA Dept. of Natural Resources. We thank the summer fellowship program of WHOI for support of L. Ryckman and the MBL summer fellowship program for support of K. Halloran. Thanks to A. Rago (WHOI) and to S. Baldwin and J. Palardy for help in the field, and to J. Warner for discussions of estuarine mixing processes and model-ing. Financial support was provided by the US Geological Survey and by National Science Foundation grant #OCE-0346933 to MAC.
Edited by: B. Burnett
References
Anderson, D. M. and Stolzenbach, K. D. : Selective retention of two dinoflagellates in a well-mixed estuarine embayment: The importance of diel vertical migration and surface avoidance, Ma-rine ecology progress series, 25, 39–50, 1985.
Borges A. V., Vanderborght J. P., Schiettecatte L. S., Gazeau F., Ferron-Smith S., Delille B., and Frankignoulle M.: Variability of the gas transfer velocity of CO2in a macrotidal estuary (the Scheldt). Estuaries, 27, 4, 593–603, 2004.
Burnett, W. C., Kim, G., and Lane-Smith, D.: A continuous monitor for assessment of Rn-222 in the coastal ocean, J. Radioanalyt. Nucl. Chem., 249, 167–172, 2001.
Burnett, W. C. and Dulaiova, H.: Estimating the dynamics of groundwater input into the coastal zone via continuous radon-222 measurements, J. Env. Radioact., 69, 21–35, 2003.
Burnett, W. C., Bokuniewicz, H., Huettel, M., Moore, W. S., and Taniguchi, M.: Groundwater and pore water inputs to the coastal zone, Biogeochem., 66, 3–33, 2003.
Charette, M. A., Buesseler, K. O., and Andrews, J. E.: Utility of radium isotopes for evaluating the input and transport of groundwater-derived nitrogen to a Cape Cod estuary, Limnol. Oceanogr., 46, 465–470, 2001.
Charette, M. A. and Sholkovitz, E. R.: Oxidative precipitation of groundwater-derived ferrous iron in the subterranean estuary of a coastal bay, Geophys. Res. Lett., 29, 85-1–85-4, 2002. Corbett, D. R. and Cable, J. E.: Seepage meters and advective
trans-port in coastal environments: Comments on “Seepage meters and Bernoulli’s revenge” by Shinn, E. A., Reich, C. D., and Hickey, T. D., Estuaries, 25, 126–132, 2002, Estuaries, 26, 1383–1387, 2003.
Crusius J., Koopmans D., Bratton J. F., Charette M. A., Kroeger K. D., Henderson P., Ryckman L., Halloran K., and Colman J. A.: Submarine groundwater discharge to a small estuary estimated from radon and salinity measurements and a box model, Biogeo-sciences Discuss., 2, 1–35, 2005,
SRef-ID: 1810-6285/bgd/2005-2-1.
D’Elia, C. F., Steudler, P. A., and Corwin, N.: Determination of total nitrogen in aqueous samples using persulfate digestion, Limnol. Oceanogr., 22, 760–764, 1977.
Donelan, M., Air-sea interaction. in: The Sea: Ocean Engineering Science, Wiley, 239–292, 1990.
Ellins, K. K., Roman-Mas, A., and Lee, R.: Using222Rn to examine groundwater/surface discharge interaction in the Rio Grande de Manati, Puerto Rico, J. Hydrol., 115, 319–341, 1990.
Geyer, W. R.: Influence of wind on dynamics and flushing of shal-low estuaries, Estuarine Coastal and Shelf Science, 44, 713–722, 1997.
Giblin, A. E. and Gaines, A. G.: Nitrogen Inputs to a Marine Em-bayment: The Importance of Groundwater, Biogeochem., 10, 309–328, 1990.
Hamersley, M. R. and Howes, B. L.: Contribution of denitrification to nitrogen, carbon, and oxygen cycling in tidal creek sediments of a New England salt marsh, Mar. Ecol.-Prog. Ser., 262, 55–69, 2003.
Hussain, N., Church, T. M., and Kim, G.: Use of222Rn and226Ra to trace groundwater discharge into the Chesapeake Bay, Mar. Chem., 65, 127–134, 1999.
Lambert, M. J. and Burnett, W. C.: Submarine groundwater dis-charge estimates at a Florida coastal site based on continuous radon measurements, Biogeochem., 66, 55–73, 2003.
Large, W. P. and Pond, S.: Open ocean momentum flux measure-ments in moderate to strong winds, J. Phys. Ocean., 11, 324–226, 1981.
Lee, D. R.: A device for measuring seepage flux in lakes and estu-aries, Limnol. Oceanogr., 22, 140–147, 1977.
Masterson, J. P., Walter, D. A., and LeBlanc, D. R.: Delineation of contributing areas to selected public-supply wells, western Cape Cod, Massachusetts, US Geological Survey Water Resources In-vestigations Report, 45 pp., 1998.
Masterson, J. P.: Simulated interaction between freshwater and salt-water and effects of ground-salt-water pumping and sea-level change, lower Cape Cod aquifer system, Massachusetts, Rep. 2004-5014, US Geological Survey, 1–72, 2004.
Moore, W. S.: Sampling228Ra in the deep ocean, Deep Sea Res. Oceanogr. Abstr., 23, 647–651, 1976.
Moore, W. S.: Large groundwater inputs to coastal waters revealed by226Ra enrichments, Nature, 380, 612–614, 1996.
Moore, W. S.: The subterranean estuary: a reaction zone of ground water and sea water, Mar. Chem., 65, 111–125, 1999.
Nowicki, B. L., Requintina, E., Van Keuren, D., and Portnoy, J.: The role of sediment denitrification in reducing groundwater-derived nitrate inputs to Nauset Marsh estuary, Cape Cod, Mas-sachusetts, Estuaries, 22, 245–259, 1999.
Portnoy, J. W., Nowicki, B. L., Roman, C. T., and Urish, D. W.: The discharge of nitrate-contaminated groundwater from developed shoreline to marsh-fringed estuary, Wat. Res. Res., 34, 3095– 3104, 1998.
Schwartz, M. C.: Significant groundwater input to a coastal plain estuary: assessment from excess radon, Estuarine, Coastal and Shelf Science, 56, 31–42, 2003.
Shaw, R. D. and Prepas, E. E.: Anomalous, short-term influx of water into seepage meters, Limnol. Oceanogr., 34, 1343–1351, 1989.
Shinn, E. A., Reich, C. D., and Hickey, T. D.: Seepage meters and Bernoulli’s revenge, Estuaries, 25, 126–132, 2002.
Smith, L. and Zawadzki, W.: A hydrogeologic model of sub-marine groundwater discharge: Florida intercomparison exper-iment, Biogeochemistry, 66, 95–110, 2003.
Taniguchi, M., Burnett, W. C., Smith, C. F., Paulsen, R. J., O’Rourke, O., and Krupa, S. L.: Spatial and temporal distribu-tions of submarine groundwater discharge rates obtained from various types of seepage meters at a site in the Northeastern Gulf of Mexico, Biogeochem., 66, 35–53, 2003.
Turner, S. M., Malin, G., Nightingale, P. D., and Liss, P. S.: Sea-sonal variation of dimethyl sulphide in the North Sea and an as-sessment of fluxes to the atmosphere, Marine Chem., 54, 245– 262, 1996.