ACPD
5, 655–702, 2005Trace gas scavenging in a dense Saharan
dust plume
M. de Reus et al.
Title Page
Abstract Introduction
Conclusions References
Tables Figures
◭ ◮
◭ ◮
Back Close
Full Screen / Esc
Print Version
Interactive Discussion
EGU Atmos. Chem. Phys. Discuss., 5, 655–702, 2005
www.atmos-chem-phys.org/acpd/5/655/ SRef-ID: 1680-7375/acpd/2005-5-655 European Geosciences Union
Atmospheric Chemistry and Physics Discussions
Observations and model calculations of
trace gas scavenging in a dense Saharan
dust plume during MINATROC
M. de Reus1, H. Fischer1, R. Sander1, V. Gros1, R. Kormann1, G. Salisbury1, R. Van Dingenen2, J. Williams1, M. Z ¨ollner1, and J. Lelieveld1
1
Max Planck Institute for Chemistry, PO Box 3060, 55020 Mainz, Germany 2
Joint Research Centre, Ispra, Italy
Received: 13 January 2005 – Accepted: 31 January 2005 – Published: 11 February 2005 Correspondence to: M. de Reus ([email protected])
ACPD
5, 655–702, 2005Trace gas scavenging in a dense Saharan
dust plume
M. de Reus et al.
Title Page
Abstract Introduction
Conclusions References
Tables Figures
◭ ◮
◭ ◮
Back Close
Full Screen / Esc
Print Version
Interactive Discussion
EGU
Abstract
An intensive field measurement campaign was performed in July/August 2002 at the Global Atmospheric Watch station Iza ˜na on Tenerife to study the interaction of mineral dust aerosol and tropospheric chemistry (MINATROC). A dense Saharan dust plume, with aerosol masses exceeding 500µg m−3, persisted for three days. During this dust 5
event strongly reduced mixing ratios of ROx (HO2, CH3O2 and higher organic peroxy radicals), H2O2, NOx (NO and NO2) and O3 were observed. A chemistry boxmodel, constrained by the measurements, has been used to study gas phase and heteroge-neous chemistry. It appeared to be difficult to reproduce the observed HCHO mixing ratios with the model, possibly related to the representation of precursor gas concentra-10
tions or the absence of dry deposition. The model calculations indicate that the reduced H2O2mixing ratios in the dust plume can be explained by including the heterogeneous removal reaction of HO2 with an uptake coefficient of 0.2, or by assuming heteroge-neous removal of H2O2with an accommodation coefficient of 3×10⁻⁴. However, these heterogeneous reactions cannot explain the low ROxmixing ratios observed during the 15
dust event. Whereas a mean daytime net ozone production rate (NOP) of 1.06 ppbv/hr occurred throughout the campaign, the reduced ROx and NOx mixing ratios in the Saharan dust plume contributed to a reduced NOP of 0.14–0.32 ppbv/hr, which likely explains the relatively low ozone mixing ratios observed during this event.
1. Introduction
20
The interaction between atmospheric aerosols and photochemistry via heterogeneous reactions has been subject to intense investigation during the last decades. As an example, heterogeneous reactions on polar stratospheric clouds lead to the destruction of stratospheric ozone (e.g. Crutzen and Arnold, 1986). Heterogeneous reactions on cloud droplets and aerosols are also found to be important for tropospheric chemistry 25
ACPD
5, 655–702, 2005Trace gas scavenging in a dense Saharan
dust plume
M. de Reus et al.
Title Page
Abstract Introduction
Conclusions References
Tables Figures
◭ ◮
◭ ◮
Back Close
Full Screen / Esc
Print Version
Interactive Discussion
EGU mineral dust aerosol (e.g. Usher et al., 2003), since these particles provide a large
surface area for heterogeneous reactions in the troposphere (IPCC, 1996).
During several field campaigns a correlation between high dust loadings and low O3 and HNO3concentrations has been observed (e.g. de Reus et al., 2000; Hanke et al., 2003; Bonasoni et al., 2004). The latter authors also showed that dust-poor airmasses 5
originating in North Africa had significantly higher O3concentrations than those which carried dust.
Chemical boxmodels as well as global and regional chemical-transport models have been used to calculate the reduction in trace gas mixing ratios due to heterogeneous reactions on mineral dust aerosol. Most studies focussed on ozone and nitrogen 10
species, while only a few studies report effects of mineral dust on OH and HO2mixing ratios. Zhang et al. (1994) and Zhang and Carmichael (1999), for example, used a box-model to simulate the loss of SO2, NOx, HO2 and O3due to heterogeneous reactions on mineral dust aerosol. Dentener et al. (1996) performed simulations with a global chemistry-transport model and calculated an O3 reduction up to 10% in and nearby 15
dust source areas. De Reus et al. (2000) calculated a 30–40% reduction of O3 in a Saharan dust plume near the coast of Africa, attributed to the direct removal of O3by dust aerosol and the heterogeneous removal of HNO3. Bauer et al. (2004) calculated a 5% reduction in global tropospheric ozone and concluded that this was mainly due to the uptake of HNO3 on dust aerosol and not due to the direct uptake of O3. How-20
ever, the HNO3concentration was overestimated by the global model, which may have strongly biased the results of this study. Bian and Zender (2003) investigated the effect of reduced photolysis rates and heterogeneous chemistry on the tropospheric trace gas mixing ratios. They concluded that both processes cause a combined decrease in global mean O3 of 0.7%, and 11.1% for OH, 5.2% for HO2 and 3.5% for HNO3. 25
ACPD
5, 655–702, 2005Trace gas scavenging in a dense Saharan
dust plume
M. de Reus et al.
Title Page
Abstract Introduction
Conclusions References
Tables Figures
◭ ◮
◭ ◮
Back Close
Full Screen / Esc
Print Version
Interactive Discussion
EGU campaign. They investigated both the reduction in solar (actinic) radiation and
het-erogeneous reactions on the dust aerosol. Low O3 concentrations in the dust plume could only be explained by heterogeneous reactions. It was inferred that the reduc-tion of photolysis rates largely determines changes in OH concentrareduc-tions, whereas the large decrease in HNO3 (up to 95%) and SO2 (up to 55%) concentrations was due to 5
heterogeneous reactions.
Although all aforementioned studies indicate a strong influence of mineral dust aerosols on tropospheric chemistry, the results are very different. This is mainly due to the large uncertainty in the uptake coefficients for the different trace gases on mineral dust aerosols. Moreover, for boxmodel calculations it has proven difficult to provide 10
realistic initial conditions, and for regional and global models the comparison with ob-servations appears to be a main limitation.
In this study we use an alternative approach. We employ a chemical boxmodel to analyse measurements performed within a dense Saharan dust plume at the Iza ˜na ob-servatory on Tenerife, Canary Islands. We use the model to calculate the steady state 15
concentrations of ROx, H2O2and HCHO and compare them with observed values. For the model initialisation measured quantities are used to the extend possible. In addi-tion to heterogeneous O3 and HNO3 uptake and the reduction of photolysis rates by mineral dust aerosol, as addressed in previous studies, we focus on the effects of HO2 and H2O2 uptake in this study. Furthermore, we compare the net ozone production 20
rate in the Saharan dust plume with airmasses not containing dust.
2. The MINATROC experiment
The MINATROC (MINeral dust And TROpospheric Chemistry) project was designed to investigate the effects of heterogeneous reactions involving mineral aerosol on tropo-spheric chemistry. The project combined three types of research activities: laboratory 25
chem-ACPD
5, 655–702, 2005Trace gas scavenging in a dense Saharan
dust plume
M. de Reus et al.
Title Page
Abstract Introduction
Conclusions References
Tables Figures
◭ ◮
◭ ◮
Back Close
Full Screen / Esc
Print Version
Interactive Discussion
EGU istry under realistic conditions, and global model studies to put the results of the former
two into perspective. In this paper we will present observations of the second field experiment, performed in July/August 2002 at the Iza ˜na observatory on the island of Tenerife, Spain.
Iza ˜na observatory is part of the World Meteorological Organisation (WMO) Global 5
Atmospheric Watch (GAW) network, and is operated by the Spanish Meteorological In-stitute. The station is situated on a mountain ridge on the island of Tenerife at 2360 m above sea level (a.s.l., 28◦18′N, 16◦29′W). Between 15 July and 15 August 2002 inten-sive aerosol and trace gas measurements were performed. The influence of mineral dust on the chemistry of the troposphere could be studied extensively during this pe-10
riod, since, besides several smaller dust episodes, a major dust event was probed between 28 and 31 July 2002.
3. Instrumentation
Additional to the set of measurements of the global watch program at Iza ˜na, intensive measurements of aerosols and trace gases were performed during MINATROC by 15
different institutes.
The instruments to measure atmospheric trace gases were operated by the Max Planck Institute for Chemistry, Mainz, Germany, from two laboratory containers. A sample air inlet was placed at the roof of both containers about 4 m above the ground. The ROx instrument and the upward looking JNO2 and JO1D filter radiometers were 20
deployed directly on the roof of the container at about 3 m above ground level, while the downward looking JNO2 and JO
1
D filter radiometers were mounted at a height of 1.5 m above ground level.
Table 1 lists the trace gas instruments which are relevant for this study, together with their associated uncertainties and detection limits. Since most instruments are 25
ACPD
5, 655–702, 2005Trace gas scavenging in a dense Saharan
dust plume
M. de Reus et al.
Title Page
Abstract Introduction
Conclusions References
Tables Figures
◭ ◮
◭ ◮
Back Close
Full Screen / Esc
Print Version
Interactive Discussion
EGU instruments can be found in Fischer et al. (2003). For the other instruments more
details are given below.
A liquid chemistry fluorescence detector (AERO laser model AL 4021) was used to measure formaldehyde (HCHO). The instrument first strips the HCHO from the am-bient air into a strongly diluted H2SO4 solution, after which it reacts with acetylace-5
tone and ammoniumacetate to form 3,5-diacetyl-1,4-dihydrolutidine (DDL) following the Hantzsch reaction. The fluorescence signal of the excited reaction product is detected by a photomultiplier at 510 nm. The same instrument has been employed during a previous aircraft campaign (Kormann et al., 2003).
For the determination of H2O2 a second liquid chemistry fluorescence detector has 10
been used (AERO laser model AL 2001CA). After stripping H2O2 from the ambient air in a slightly acidic solution, this instrument determines the total peroxide concentration by the liquid phase reaction of peroxides with p-hydroxyphenylacetic acid, catalysed by peroxidase. To distinguish between H2O2and organic peroxides two parallel chan-nels are used. In one channel H2O2 is selectively destroyed by catalase prior to the 15
fluorescence detection in the instrument. The difference between the signals from both channels is a measure for the H2O2concentration (Lazrus et al., 1986).
No quantification of organic peroxides can be achieved without knowing the specific peroxide composition in the atmosphere. This is due to the high variability in the relative amounts of peroxides in ambient air, the large variations in Henry’s law constants, and, 20
consequently, the collection efficiencies for these compounds. However, if we assume that the most abundant organic peroxide in the atmosphere is methylhydroperoxide (MHP, CH3OOH) and that the collection efficiency of MHP is 60%, an upper limit for the MHP mixing ratio can be determined. The obtained CH3OOH mixing ratio should, however, be interpreted with considerable care.
25
ACPD
5, 655–702, 2005Trace gas scavenging in a dense Saharan
dust plume
M. de Reus et al.
Title Page
Abstract Introduction
Conclusions References
Tables Figures
◭ ◮
◭ ◮
Back Close
Full Screen / Esc
Print Version
Interactive Discussion
EGU saturated H2O2environment (glass bottle with a small amount of 30% H2O2solution,
operated at a constant temperature of 30◦C). Zero air (CAP60 Headline Filters air pu-rifier) with a total flow of 6 L/min was mixed with the calibration gas stream leading to a mixing ratio of 13.3 ppbv HCHO and 5.9 ppbv H2O2. Every 4–6 h calibration gas was added to the sample air at the top of the sample mast, to determine the losses of 5
HCHO and H2O2in the inlet line. To test the stability of the instrument, additional liquid calibrations were performed once a day with 1µM HCHO and H2O2solutions.
Measurements of a range of volatile organic carbons (VOC) were performed using a proton-transfer-reaction mass spectrometer (PTRMS). Inside this instrument organic species are chemically ionised by the proton transfer with H3O+ ions and the products 10
are detected with a quadrupole mass spectrometer (Lindinger et al., 1998). In this study the measurements of acetone, methanol and isoprene are used. The isoprene mixing ratios measured with the PTRMS, however, should be regarded as upper limits, due to other possible contributions to this mass (Williams et al., 2001). More details about the measurement technique and calibration procedure can be found in Salisbury 15
et al. (2003).
For the measurement of non methane hydrocarbons (NMHC) stainless steel canis-ter samples were taken every 3 or 6 h during the campaign, which were analysed in the laboratory of the Max Planck Institute in Mainz, using a gas chromatograph–mass spectrometer system (GC-MS). Due to the set-up of the GC-MS system only hydrocar-20
bons with more than 3 C atoms were analysed. More details about the collection of the samples, the GS-MS system and its calibration procedure can be found in Gros et al. (2003).
Aerosol measurements were performed from a mobile laboratory by the Joint Re-search Centre, Ispra, Italy. Dry aerosol size distributions in the size range 6–600 nm 25
ACPD
5, 655–702, 2005Trace gas scavenging in a dense Saharan
dust plume
M. de Reus et al.
Title Page
Abstract Introduction
Conclusions References
Tables Figures
◭ ◮
◭ ◮
Back Close
Full Screen / Esc
Print Version
Interactive Discussion
EGU classes from 300 nm to 10µm diameter. Note that the aerosols entering the OPC have
not been dried, however, for the low relative humidities (<60%) observed during the campaign, the observed aerosol diameter can be regarded as dry diameter. Combin-ing the data of both instruments provides the aerosol size distribution between 6 nm and 10µm diameter, from which the total aerosol surface area and volume was calcu-5
lated. Total PM10 (particle diameter (Dp)<10µm) aerosol mass was obtained on-line with a tapered element oscillating microbalance (TEOM) system, with a total uncer-tainty of±15%.
4. Meteorology
The synoptic situation over the Canary Islands is usually dominated by a subtropical 10
anticyclone, centred over the Azores (Carslaw et al., 1997). Deviations in the position of this anticyclone generally determine the origin of the airmasses observed at the Iza ˜na observatory. During the MINATROC campaign in July/August 2002 four regions of origin could be identified based on backtrajectories calculated with the HYSPLIT model (HYbrid Single-Particle Lagrangian Integrated Trajectory, http://www.arl.noaa. 15
gov/ready/hysplit4.html): north Atlantic, central Atlantic, tropical Africa and the Sahara region.
Several time periods with airmasses containing mineral dust, originating in the Sa-hara region and tropical Africa could be identified. The strongest SaSa-haran dust plume was observed between 28 and 31 July. Aerosol index images from the TOMS satel-20
lite indicate that this dust plume originated in western Algeria and its border region with Mali and Mauritania. Backtrajectory calculations suggest that the airmasses were lifted from between 500 and 1500 m above ground level to the measurement altitude of about 2.5 km, 2.5 to 3 days before arrival at the Iza ˜na measurement station, and originate more to the southwest in Mauritania. Lidar measurements indicate that the 25
ACPD
5, 655–702, 2005Trace gas scavenging in a dense Saharan
dust plume
M. de Reus et al.
Title Page
Abstract Introduction
Conclusions References
Tables Figures
◭ ◮
◭ ◮
Back Close
Full Screen / Esc
Print Version
Interactive Discussion
EGU
5. Observations
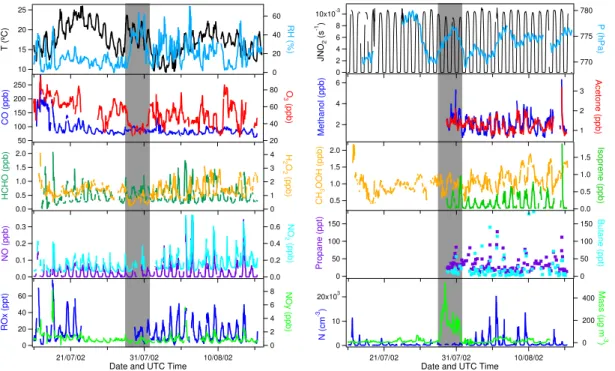
The mixing ratios of a selection of trace gases together with the observed temperature, relative humidity, aerosol number concentration and aerosol surface area are shown in Fig. 1. Continuous in-situ measurements were performed between 16 July and 15 August 2002. Due to instrument calibrations some short gaps occur in the dataset. A 5
delay in the analytic gas shipment to the measurement station precluded ROx mea-surements between 22 July and 29 July. Moreover, due to inlet problems no reliable measurements of acetone, methanol, isoprene and NMHC could be obtained before 29 July. The dataset has been reduced to 30 min averaged values, except for the aerosol mass concentrations for which only hourly averages are available.
10
Figure 2 shows the average diurnal cycle for a selection of species observed dur-ing the campaign. A strong diurnal cycle was observed for most trace gases and the aerosol number concentration. This is mainly driven by local air circulation patterns at the measurement site, which are typical for a high-elevation mountainous site. During daytime the air flows upward to the sampling site resulting from surface warming (up-15
slope winds), while downslope winds are observed during the night, due to cooling of the mountain slopes (Zaveri et al., 1995). As a result, free tropospheric air masses were observed during the night (21:00–07:00 UTC) and airmasses influenced by an-thropogenic pollution from the local boundary layer during the day (07:00–21:00 UTC). The fraction of boundary layer air which has been mixed into the free tropospheric 20
airmasses at the measurement station has been estimated using relative humidity pro-files obtained by radiosondes launched in Santa Cruz, the capital of Tenerife, situated at the south-western coast of the island (Schultz, 1995). For this method three water vapour mixing ratios are used: (1) the H2O mixing ratio measured at the Iza ˜na station (H2Oi zo), (2) the H2O mixing ratio measured by the radiosonde in the free troposphere 25
ACPD
5, 655–702, 2005Trace gas scavenging in a dense Saharan
dust plume
M. de Reus et al.
Title Page
Abstract Introduction
Conclusions References
Tables Figures
◭ ◮
◭ ◮
Back Close
Full Screen / Esc
Print Version
Interactive Discussion
EGU two radiosondes were launched per day only one instantaneous daytime value for the
mixing factor could be obtained per day. The daytime mixing factor ranged between
−30 and 65% and had a median value of 17% in the dust-poor airmasses. During the major dust event the measurements were less influenced by local pollution, the median mixing factor during the dust event was 0.8%.
5
For CO, NOx, methanol, acetone and aerosols the upslope winds resulted in an en-hancement of the concentrations during the day, due to the intrusion of anthropogenic pollution from the boundary layer. On the other hand O3and H2O2mixing ratios were lower during the day, as a result of their positive vertical gradients in the lower atmo-sphere, mainly due to enhanced destruction of these species by dry deposition at the 10
surface. The ROxand HCHO mixing ratios closely followed the solar radiation intensity. For these shorter lived species the diurnal variation is less affected by transport and much more dependent on local photochemical production, maximizing around local noon.
For a statistical analysis of the data, upslope and downslope conditions have been 15
separated. Upslope conditions could be identified by a strong enhancement in aerosol number concentration and occurred between 07:00 and 21:00 UTC (daytime), downs-lope conditions correspondingly between 21:00 and 07:00 UTC (nighttime). Average daytime and nighttime values for the observed trace gas mixing ratios and aerosol number concentration, surface area, volume and mass are listed in Table 2.
20
Table 2 and Fig. 2 also distinguish airmasses containing dust from those which were not influenced by dust. During the measurement campaign several Saharan dust events were probed with PM10 aerosol mass concentrations exceeding 25µg m−3. The most pronounced dust event was probed between 28 July, 16.45 UTC and 31 July, 15.15 UTC, when aerosol mass concentrations up to 500µg m−3were observed, and 25
ACPD
5, 655–702, 2005Trace gas scavenging in a dense Saharan
dust plume
M. de Reus et al.
Title Page
Abstract Introduction
Conclusions References
Tables Figures
◭ ◮
◭ ◮
Back Close
Full Screen / Esc
Print Version
Interactive Discussion
EGU been marked by a grey box in Fig. 1.
Some of the observed trace gases show a distinct change during the dust event. The most pronounced is the decrease in ozone mixing ratio from about 65 ppbv just before the dust event started to below 35 ppbv during the dust event (ppbv=nmol/mol). At the same time relatively low H2O2mixing ratios were observed. In free tropospheric 5
air masses (nighttime), an average H2O2mixing ratio of 0.61±0.25 ppbv was observed during the dust period, whereas it was 1.72±0.55 ppbv during the rest of the cam-paign. Also Fig. 2 depicts significantly lower O3and H2O2 mixing ratios in airmasses containing dust compared to dust-poor air. Unfortunately no ROxmeasurements were available for the first half of the dust period, although during the second part of the 10
dust period lower ROx peak values, i.e. 23 pptv at 30 July and 32 pptv at 31 July were observed compared to the dust-poor days (43±16 pptv). Moreover, a difference in NOx mixing ratio was found between dust and dust-poor airmasses, which could be a result of the suppressed transport of boundary layer air to the measurement station during the dust event. During upslope conditions 0.17 ppbv NOx was found in the dust plume, 15
while 0.26 ppbv NOxwas observed in the dust-poor airmasses. An additional and pos-sibly more significant effect may be the heterogeneous loss of HNO3and N2O5on the dust particles, which indirecty deplete NOx. The mean relative humidity during the Sa-haran dust episode was 35%, with peak values up to 60%. This is high compared to the relative humidity observed during the rest of the campaign.
20
Furthermore, no significant change in the HCHO and CO mixing ratio was observed. Overall, an inhibition of the VOC diurnal cycle could be observed, with enhanced mix-ing ratios durmix-ing the night throughout the dust event, indicatmix-ing a slightly altered local wind pattern. Although a strong decrease in the HNO3 mixing ratio is expected in a mineral dust plume (e.g. Dentener et al., 1996) and observed by Hanke et al. (2003), 25
ACPD
5, 655–702, 2005Trace gas scavenging in a dense Saharan
dust plume
M. de Reus et al.
Title Page
Abstract Introduction
Conclusions References
Tables Figures
◭ ◮
◭ ◮
Back Close
Full Screen / Esc
Print Version
Interactive Discussion
EGU is highest in the dust-poor airmasses, which may also be explained by a reduced
mix-ing of boundary layer air in the dust plume. The much higher particle surface area and mass concentration observed during the dust event indicates a very different aerosol size distribution in the dust loaded airmasses, with a higher number of larger particles. The small particles are probably scavenged by the larger Saharan dust aerosols in the 5
plume, reducing the total aerosol number concentration. The photolysis rates of O3 and NO2are reduced in the dust plume due to the absorption and scattering of solar radiation by the dense aerosol. The average daytime JNO2photolysis rate decreased by 17% and JO1D by 15% during the Saharan dust event compared to the rest of the campaign.
10
Another interesting observation is the very high CO and O3mixing ratios during the first two days of the measurement campaign, which could be attributed to long range transport of a biomass burning plume from large forest fires in Quebec, Canada, on 6–9 July 2002. During these two days CO mixing ratios as high as 290 ppbv and O3mixing ratios of 100 ppbv were observed. Although very interesting, this period will not be 15
further studied in this paper.
A comparison of the observed trace gas mixing ratios with observations made dur-ing the first MINATROC field campaign on Mt. Cimone in June 2000 (Fischer et al., 2003) is presented in Table 3. The Mt. Cimone station is situated at 2165 m a.s.l. on the highest mountain in the northern Italian Apennines (44◦11′N, 10◦42′E). Due to its 20
location in southern Europe, the sampled airmasses represent European continental background conditions. Similar O3mixing ratios have been observed at both measure-ments sites, while the CO and NOxmixing ratios were slightly lower at Iza ˜na, indicative of a more remote site, though influenced by continental pollution. The HCHO mixing ra-tios observed at Iza ˜na were, however, much lower than those observed at Mt. Cimone. 25
ACPD
5, 655–702, 2005Trace gas scavenging in a dense Saharan
dust plume
M. de Reus et al.
Title Page
Abstract Introduction
Conclusions References
Tables Figures
◭ ◮
◭ ◮
Back Close
Full Screen / Esc
Print Version
Interactive Discussion
EGU mixing ratios were observed in 2002. This appears to be consistent with an upward
O3 trend observed downwind of western Africa (Lelieveld et al., 2004). The median nighttime CO mixing ratio in 2002 was 9 ppbv lower than that observed in 1993, in line with the observed CO trend of−0.92±0.15 ppbv/yr in the northern hemisphere lower troposphere (Novelli et al., 2003). The observed ROx mixing ratios were similar, taking 5
into account the large uncertainty in the ROxmeasurements.
6. Boxmodel calculations
To investigate photochemistry, net ozone production and the influence of Saharan dust aerosol on the mixing ratios of peroxy radicals, formaldehyde and hydrogen peroxide, model calculations were performed with the chemistry box model MECCA (Module Ef-10
ficiently Calculating the Chemistry of the Atmosphere). The chemical reaction scheme has been adopted from von Kuhlmann et al. (2003) and includes detailed chemistry of organic species with up to four C-atoms and isoprene (Sander et al., 2004). The reaction rates have generally been adopted from the Jet Propulsion Laboratory (JPL) 2003 database (Sander et al., 2003). Heterogeneous removal reactions of HO2 and 15
H2O2on mineral dust have been added to the chemical scheme, analogous to de Reus et al. (2000). In total 67 chemical species, 110 gas phase chemical reactions, 34 pho-tolysis reactions and 2 heterogeneous removal reactions were included (see electronic supplementhttp://www.copernicus.org/EGU/acp/acpd/5/655/acpd-5-655-sp1.pdf).
The boxmodel has been employed by constraining the concentrations of relatively 20
ACPD
5, 655–702, 2005Trace gas scavenging in a dense Saharan
dust plume
M. de Reus et al.
Title Page
Abstract Introduction
Conclusions References
Tables Figures
◭ ◮
◭ ◮
Back Close
Full Screen / Esc
Print Version
Interactive Discussion
EGU 6.1. Input parameters
Since two sets of observations are available per hour, a model simulation is started every 30 min. Each simulation has been initialised with the observed temperature, pressure, O3, CO, H2O, NO, H2O2, CH3OOH, acetone, methanol, isoprene, propane and butane mixing ratios, which are shown in Fig. 1. Short gaps for which data are 5
missing have been filled through interpolation. HNO3is initialised using the observed NOz mixing ratio (NOz=NOy-NOx). Since NOy also includes atmospheric aerosol ni-trate, HNO3 will likely be strongly overestimated during the dust event when NOz is used as a proxy for HNO3 (see Sect. 5). Therefore, HNO3 is set to zero during the major Saharan dust event. For CH4 and CO2 background mixing ratios for the year 10
2002 of 1.75 and 372 ppmv have been used, respectively. Since no measurements of ethane, ethene and propene were performed during MINATROC, the mixing ratios of these species were scaled to the observed propane mixing ratio using the mean daytime mixing ratios observed during a former campaign at Iza ˜na in July/August 1993 (Fischer et al., 1998). During this campaign the mean ratios of ethane, ethene and 15
propene to propane were 10, 0.6 and 0.2, respectively.
JO1D and JNO2photolysis rates were measured during the campaign and have been used as reaction rates for the photolysis reaction of O3(to O
1
D) and NO2, respectively. Other photolysis rates have been calculated using the Tropospheric Ultraviolet-Visible (TUV, version 4.1) radiation model (Madronich and Flocke, 1998). For these calcu-20
lations, the total ozone column measured with a Dobson spectrometer at the Iza ˜na station has been used as input value, while default values for the SO2, NO2, cloud and aerosol optical depth were used. To account for cloud overpasses and the reduction of solar radiation due to the Saharan dust plume, the calculated photolysis rates have been scaled to the ratio of the measured to the calculated JNO2photolysis rates. 25
simula-ACPD
5, 655–702, 2005Trace gas scavenging in a dense Saharan
dust plume
M. de Reus et al.
Title Page
Abstract Introduction
Conclusions References
Tables Figures
◭ ◮
◭ ◮
Back Close
Full Screen / Esc
Print Version
Interactive Discussion
EGU tion, while the model was run for 10 days, to make sure that steady state was achieved.
Since no VOC and NMHC data are available before 29 July, only the later part of the campaign has been analysed.
6.2. Gas phase chemistry
Before we performed model simulations for the MINATROC dataset, we first carried 5
out some calculations to determine the time needed to reach steady state for different species. At local noon, a steady state peroxy radical mixing ratio is achieved within an hour, however, the model has to run for at least 6 h to reach a steady state HCHO concentration. At higher solar zenith angles it takes somewhat longer to attain steady state, whereas during the night a steady state ROx and HCHO mixing ratio is not 10
reached at all. Therefore, each model simulation continues for 10 days, to ensure that steady state is achieved, and the simulations are limited to time periods during which the solar zenith angle is less than 70◦. In later sensitivity runs the model is also used to calculate the H2O2 mixing ratio. Also for this trace gas steady state is reached well within 10 days for zenith angles<70◦.
15
6.2.1. Reference run
The ROx mixing ratio calculated by the model without heterogeneous chemistry, for the period 29 July to 15 August 2002, is shown in Fig. 3a. ROx is the sum of HO2, CH3O2, higher organic peroxy radicals with up to 4 C atoms and peroxy radicals formed during isoprene degradation. The main constituents of the modelled ROx are HO2 20
(60%), CH3O2 (18%) and the peroxy radicals from isoprene degradation (16%). The contribution of other higher organic peroxy radicals to the total ROx is very small, on average C2H5O2contributes 0.06% to the total modelled ROx, C2H3O35.6%, C3H7O2 0.01%, C3H6O20.17%, C3H5O30.08%, C4H9O20.02% and C4H9O40.003%. The ROx mixing ratio is clearly overestimated by the model, and the mean ratio of the calculated 25
ACPD
5, 655–702, 2005Trace gas scavenging in a dense Saharan
dust plume
M. de Reus et al.
Title Page
Abstract Introduction
Conclusions References
Tables Figures
◭ ◮
◭ ◮
Back Close
Full Screen / Esc
Print Version
Interactive Discussion
EGU Figure 3b shows the calculated and observed HCHO mixing ratios. The HCHO
mix-ing ratios are also strongly overestimated by the model. The daytime maximum HCHO mixing ratio calculated by the model ranges between 1.5 and 7.5 ppbv, while the ob-served values vary between 0.7 and 1.7 ppbv. The mean ratio of the calculated to observed HCHO mixing ratio (HCHO calc/obs) equals 2.29, however, a good correla-5
tion can be found between the observed and calculated HCHO mixing ratios. When fitting a straight line through the data points, the correlation coefficient r is 0.80.
Possible reasons for the model overestimation of both the ROx and HCHO mixing ratios could either be an underestimation of the observed HCHO and ROxmixing ratios, an overestimation of the precursor gas concentrations, which are used as input for the 10
calculations or unknown model errors. A comparison of the HCHO and ROx mixing ratios with a previous measurement campaign at Iza ˜na shows that the HCHO mixing ratios are a factor 2 lower than those observed nine years earlier, however, during this campaign the HCHO measurements were probably overestimated due to a spectral interference to CH4(Fischer et al., 1998). The ROxmixing ratios are similar considering 15
the large uncertainty in the ROxmeasurements (see Table 3). The influence of the input concentrations of different precursor gases for HCHO and ROx will be studied in the next section.
6.2.2. Sensitivity simulations
To investigate the effects of a range of model input parameters, several sensitivity stud-20
ies have been performed in which the mixing ratio of one trace gas has been reduced by a factor two compared to the reference run. The results are summarised in Table 4. The calculated ROx mixing ratio is rather insensitive to the changes in the input mixing ratios of most trace gases, except for O3and H2O, which are direct precursors of HO2, and for isoprene, which is a main precursor for different organic peroxides. 25
ACPD
5, 655–702, 2005Trace gas scavenging in a dense Saharan
dust plume
M. de Reus et al.
Title Page
Abstract Introduction
Conclusions References
Tables Figures
◭ ◮
◭ ◮
Back Close
Full Screen / Esc
Print Version
Interactive Discussion
EGU The simulated HCHO mixing ratio is more variable, and especially sensitive to the
input concentration of NO. A reduction of the NO mixing ratio by a factor 2 causes the HCHO mixing ratio to decrease by 33%. At low NO mixing ratios the production of HCHO mainly occurs via the reaction of HO2with CH3O2 and the subsequent photol-ysis of CH3OOH, while at higher NO mixing ratios, the HCHO production is dominated 5
by the faster reaction of CH3O2with NO, leading to an enhanced production of HCHO. The simulated HCHO mixing ratio is also sensitive to the input concentration of iso-prene (21% reduction of HCHO when the isoiso-prene mixing ratio is reduced with a factor 2), O3 (10%), H2O (7%) and CH3OOH (5%). Isoprene and CH3OOH are precursor gases of HCHO, so a reduction in the mixing ratio of these trace gases will directly 10
result in a reduced HCHO production. O3 and H2O influence the HCHO mixing ratio through the change in OH mixing ratio. If the concentration of O3or H2O is reduced, less OH is produced via the reaction of H2O with O1D and less OH will be available for the destruction of VOCs and notably isoprene, which results in a reduced production of HCHO.
15
The above described sensitivity studies show that the ROx and HCHO mixing ra-tios are most sensitive to the mixing ratio of NO, O3, H2O, CH3OOH and isoprene. Since the measurements of isoprene and CH3OOH have the largest uncertainty we will investigate these trace gases in more detail below.
Isoprene: Isoprene is an important precursor gas of formaldehyde and different 20
organic peroxy radicals. The isoprene mixing ratios observed during MINATROC were high relative to the isoprene mixing ratios observed during the OCTA campaign at Iza ˜na in July/August 1993 (Fischer et al., 1998). Excluding the measurements performed during the major dust event, the mean isoprene mixing ratio was 270±206 pptv during the day and below the detection limit at night. This is a factor 4.5 higher than the mean 25
daytime isoprene mixing ratio observed during OCTA, which was 60±124 pptv(Fischer et al., 1998).
ACPD
5, 655–702, 2005Trace gas scavenging in a dense Saharan
dust plume
M. de Reus et al.
Title Page
Abstract Introduction
Conclusions References
Tables Figures
◭ ◮
◭ ◮
Back Close
Full Screen / Esc
Print Version
Interactive Discussion
EGU during OCTA. For this simulation we divided the observed isoprene mixing ratio during
MINATROC by a factor 4.5.
A reduction of the isoprene mixing ratio leads to decreases in both the HCHO and ROx mixing ratios. The mean calc/obs ratio of ROx decreases from 1.70 in the ref-erence run to 1.41 in the low isoprene run. The contribution of the different peroxy 5
radicals to the total ROx mixing ratio changes, since less organic peroxy radicals are formed during the isoprene degradation (9%). The main constituents of ROx are still HO2 (65%) and CH3O2 (22%), while the contribution of other organic peroxy radicals decreases to 4%. The effect of isoprene on the HCHO mixing ratio is even stronger than on ROx. The calc/obs ratio of HCHO decreases from 2.29 in the reference run to 10
1.49 in the low isoprene run.
Methylhydroperoxide: From the measurements with the H2O2fluorescence detec-tor an upper limit for the CH3OOH mixing ratio could be determined. Since some major assumptions were made to infer the CH3OOH mixing ratio, it probably has the highest uncertainty of all input parameters used in the model. CH3OOH is an important precur-15
sor gas for HCHO and potentially has a large influence on the calculated HCHO mixing ratios. Therefore, we performed some sensitivity runs to determine the influence of methylhydroperoxide on the simulated ROxand HCHO mixing ratios.
The CH3OOH mixing ratio shows a similar diurnal pattern as H2O2; higher concentra-tions during the night and lower concentraconcentra-tions during the day. However, the difference 20
between the day- and nighttime concentrations is much smaller than for H2O2. The mean CH3OOH mixing ratio during the day was 1.0 ppbv, comparable to the CH3OOH mixing ratio observed in the southern hemisphere marine boundary layer (Junkermann et al., 1999; Heikes et al., 1996). It is, however, much higher than the CH3OOH mixing ratio observed at the mountain station Mauna Loa at Hawaii (3.5 km a.s.l.), where a 25
ACPD
5, 655–702, 2005Trace gas scavenging in a dense Saharan
dust plume
M. de Reus et al.
Title Page
Abstract Introduction
Conclusions References
Tables Figures
◭ ◮
◭ ◮
Back Close
Full Screen / Esc
Print Version
Interactive Discussion
EGU in the lower free troposphere over the North American continent show a much higher
median CH3OOH mixing ratio of 1.7 ppbv (Weinstein-Lloyd et al., 1998). Moreover, the observed mean daytime H2O2/CH3OOH ratio ranged between 0.9 and 1.8 in the dust-poor airmasses, which is in agreement with the ratio observed during several other campaigns in the lower free troposphere (O’Sullivan et al., 1999). Note that the ob-5
served H2O2/CH3OOH ratio in the dust plume ranged between 0.5 and 0.85, similar to the reduced ratio observed in the ITCZ region, attributed to H2O2scavenging in clouds (O’Sullivan et al., 1999).
To investigate the effect of the high measurement uncertainty of CH3OOH, a model simulation has been performed in which the input concentration of CH3OOH has been 10
divided by a factor of 2 compared to the reference run. Both the ROx and HCHO mixing ratio decrease when the input CH3OOH mixing ratio is reduced. Compared to the reference run, the calc/obs ratio of ROx decreases from 1.70 to 1.65, while the calc/obs ratio of HCHO decreases from 2.29 to 2.16.
Isoprene and methylhydroperoxide: The estimated CH3OOH and observed iso-15
prene mixing ratios appear to be inconsistent with the observed ROxand HCHO mixing ratios. Reducing the isoprene mixing ratios to values observed during a previous mea-surement campaign at the Iza ˜na observatory and reducing the CH3OOH mixing ratio to values observed at similar altitudes in the atmosphere substancially improves the agreement between the modelled and observed HCHO and ROx mixing ratios. The 20
results of the simulation with reduced isoprene and CH3OOH mixing ratios are shown in Fig. 3a and b.
The modelled ROx mixing ratio shows a smaller day to day variation compared to the observed ROx mixing ratio. ROx peak mixing ratios ranging from 36 to 45 pptv are calculated by the model, while the observed maximum values vary between 22 and 25
ACPD
5, 655–702, 2005Trace gas scavenging in a dense Saharan
dust plume
M. de Reus et al.
Title Page
Abstract Introduction
Conclusions References
Tables Figures
◭ ◮
◭ ◮
Back Close
Full Screen / Esc
Print Version
Interactive Discussion
EGU A detailed comparison between the observed and modelled ROx mixing ratios is
shown in Fig. 4a. Here the solid line represents the ideal 1:1 relationship between the modelled and observed values, while the dashed lines correspond to a deviation of this ideal relationship by a factor of 2, which about equals the total uncertainty of all measured parameters used as input for the model calculations. In total 304 model 5
data points could be used for the comparison with observations, from which 97% agree within a factor of two. A straight line fit through the calculated and observed ROxmixing ratios gives a linear correlation coefficient r of 0.58.
The diurnal variation and the absolute mixing ratios of HCHO are captured well by the model. On average the model still overestimates the HCHO mixing ratio, the mean 10
ratio of the calculated HCHO mixing ratio to the observed HCHO mixing ratio (HCHO calc/obs) is 1.32. From the 272 data points, 99% of the calculated HCHO mixing ratios are within a factor two of the observed HCHO mixing ratios (see Fig. 4b). Moreover, a good correlation is found between the observed and calculated HCHO mixing ratios. When fitting a straight line through the data points in Fig. 4b, the correlation coefficient 15
r is 0.84.
The HCHO mixing ratio is generally overestimated by the boxmodel, although sev-eral precursor gases, like terpenes such as α-pinene and other higher hydrocarbons (with more than 5 C-atoms), have not been included. Previous model studies using three dimensional global chemistry-transport or boxmodels have also investigated the 20
HCHO budget. The comparison between modelled and observed HCHO concentra-tions provides very different results. In the remote marine boundary layer (Ayers et al., 1997; Weller et al., 2000) and the upper free troposphere (Kormann et al., 2003; Jaegle et al., 2000) models tend to underestimate the concentration of HCHO. For the marine boundary layer calculations this could at least partly be explained by a lack of higher 25
ACPD
5, 655–702, 2005Trace gas scavenging in a dense Saharan
dust plume
M. de Reus et al.
Title Page
Abstract Introduction
Conclusions References
Tables Figures
◭ ◮
◭ ◮
Back Close
Full Screen / Esc
Print Version
Interactive Discussion
EGU overprediction of HCHO by models are deficiencies in considering dry deposition,
mul-tiphase chemistry in aerosols and clouds or halogen chemistry in the marine boundary layer. On the other hand, Olson et al. (2004) found a good agreement between ob-served and modelled HCHO mixing ratios between 60 and 500 pptv in the free tropo-sphere. At higher HCHO concentrations the model increasingly underpredicts HCHO, 5
which could be explained by the transport of very polluted airmasses.
HCHO dry depostion: To investigate the effect of dry deposition we included a sinusoidal dry deposition rate for HCHO analogous to H2O2, which is explained in detail in the next section. A noon time maximum dry deposition rate of 8.4×10⁻⁷s−1 is necessary to achieve good agreement between the calculated and observed HCHO 10
mixing ratios. This is more than the dry deposition rate necessary to explain the H2O2 measurements (see next section). Based on the difference in solubility and reactivity, the dry deposition velocity of H2O2 should at least be a factor 2 higher than HCHO (L. Ganzeveld, personal communication, 2004), hence dry deposition can only partly explain the difference between model and observations.
15
Discussion: According to these model analyses the measured isoprene and formaldehyde mixing ratios seem to be incompatible unless a very high dry deposi-tion rate relative to tradideposi-tional deposideposi-tion models is assumed. Such high deposideposi-tion rates have been determined recently for other carbonyl compounds (Karl et al., 2004). Moreover, recent measurements in the Amazon basin indicate that there is biologi-20
cal uptake of formaldehyde in the tropical forest (Rottenberger et al., 2004). A biogenic compensation point for formaldehyde at about 600 pptvwas found, which means that at mixing ratios below 600 pptv plants were found to emit formaldehyde directly, whereas for mixing ratios higher than this value, as was the case during MINATROC, direct up-take occurs. Such an upup-take would distort the isoprene/formaldehyde ratios relative to 25
a model containing only photochemistry.
ACPD
5, 655–702, 2005Trace gas scavenging in a dense Saharan
dust plume
M. de Reus et al.
Title Page
Abstract Introduction
Conclusions References
Tables Figures
◭ ◮
◭ ◮
Back Close
Full Screen / Esc
Print Version
Interactive Discussion
EGU measurement was erroneously high. A potential interferent at the PTR-MS mass 69
is 2-methyl-3-butenol, however, like isoprene, this species makes formaldehyde in the first oxidation step due to the terminal double bond. A recent intercomparison between this PTR-MS and both GC-FID and GC-MS systems showed very good agreement for isoprene during a measurement campaign on a forested hilltop in southern Germany 5
(Hohenpeissenberg).
Another possibility is that the steady state assumption made in this modelling study is not valid in the case of isoprene and formaldehyde. Air advected through the adja-cent forest and subsequently over the measurement site during the day may not have reached equilibrium. Therefore, the apparent incompatibility between model and mea-10
sured formaldehyde may simply indicate that this assumption is not valid for this fast reacting species.
6.2.3. Simulation of hydrogen peroxide
Since we focus on the ability of the model to simulate observed H2O2 mixing ratios, a model simulations has been performed in which H2O2 is not fixed to the measured 15
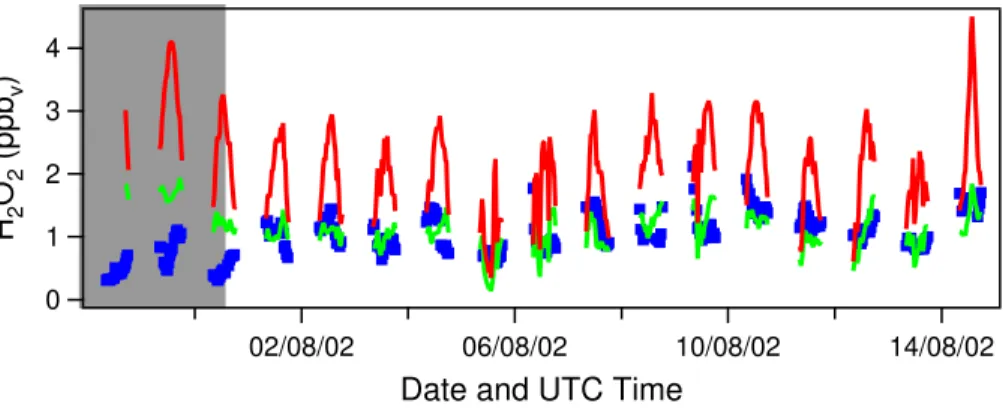
mixing ratio but has been calculated freely by the model. For this, the model run with reduced isoprene and CH3OOH mixing ratios is taken as a reference. The results of this simulation are shown in Fig. 5. The H2O2 mixing ratio calculated by the model is much higher than the observed H2O2mixing ratio (H2O2calc/obs=2.30). This is mainly due to the fact that dry deposition of H2O2at the surface is not included in the model. 20
The discrepancy between the calculated and observed values is largest during the Saharan dust event. Due to the high relative humidity observed during this period, relatively high H2O2 mixing ratios are calculated, while much lower mixing ratios were observed. Excluding the dust data points from the total dataset gives a much better agreement between observed and calculated values. For the dust-poor period, the 25
mean calc/obs ratio of H2O2is 1.89.
ACPD
5, 655–702, 2005Trace gas scavenging in a dense Saharan
dust plume
M. de Reus et al.
Title Page
Abstract Introduction
Conclusions References
Tables Figures
◭ ◮
◭ ◮
Back Close
Full Screen / Esc
Print Version
Interactive Discussion
EGU rate at local noon, when the upslope winds and turbulent exchange in the boundary
layer are relatively strong. Dry deposition was parameterised such that after each steady state calculation the concentration of H2O2 was reduced according to this dry deposition rate. A calc/obs ratio of H2O2of one was obtained (for the dust-poor period) when a maximum dry deposition rate of 7.1×10⁻⁷s−1 at local noon was assumed, 5
corresponding to a removal fraction of 62%. For the complex meteorological situation at the measurement station with mixing of boundary layer air, which is subject to dry deposition and free tropospheric air, which is likely not influenced by dry deposition, it is difficult to translate this dry deposition rate into a deposition velocity. The results of this simulation are also presented in Figure 5. From this figure it is clear that even 10
if dry deposition is included in the model calculations, the H2O2 mixing ratio is still strongly overestimated during the major Saharan dust event. A reason for this may be the uptake of H2O2 and/or HO2 on the surface of the dust aerosols, which will be investigated in the next section.
6.3. Heterogeneous chemistry 15
The observations during the Saharan dust event show reduced mixing ratios of ROx and H2O2. The reduced H2O2mixing ratios could not be explained by gas phase chem-istry or through the reduction in photolysis rates. Even after including dry deposition the model strongly overestimates the H2O2 mixing ratios during the dust event. Also the ROx mixing ratios are overestimated by the (gas phase) model during the dust event, 20
ACPD
5, 655–702, 2005Trace gas scavenging in a dense Saharan
dust plume
M. de Reus et al.
Title Page
Abstract Introduction
Conclusions References
Tables Figures
◭ ◮
◭ ◮
Back Close
Full Screen / Esc
Print Version
Interactive Discussion
EGU 6.3.1. Heterogeneous removal reactions
The removal rate of gas-phase species j by aerosol particles can be described by a pseudo-first-order rate coefficient kj (s−1), given by Heikes and Thompson (1983):
kj =
r2
Z
r1
kd ,j(r)n(r)dr (1)
wheren(r)dr (cm−3) represents the number concentration of particles with a radius be-5
tweenr andr+dr, andkd ,j(r) is the size dependent mass transfer coefficient (cm3s−1), which can be calculated using the Fuchs and Sutugin (1970) interpolation equation:
kd ,j =
4πDjV
1+K n(x+4(1−α)/3α) (2)
where Dj (cm2s−1) is the gas phase molecular diffusion coefficient of species j, V
the ventilation coefficient, which is close to unity, and Kn the dimensionless Knudsen 10
number, defined as the ratio of the effective mean free path of a gas molecule in air,
λ, to the particle radiusr. α is the mass accommodation coefficient, a dimensionless number defined as the number of molecules adsorbed by the surface of an aerosol divided by the number of collisions with the aerosol;xrepresents a correction factor for anisotropic movement and is dependent on the Knudsen number (Fuchs and Sutugin, 15
1970).
In the laboratory much effort has been undertaken to determine the reactive uptake coefficient (γ) of different atmospheric gases on mineral dust aerosol (e.g. Usher et al., 2003; Hanisch and Crowley, 2003; Underwood et al., 2001). The reactive uptake coefficient represents the fraction of collisions with a particle that leads to irreversible 20
ACPD
5, 655–702, 2005Trace gas scavenging in a dense Saharan
dust plume
M. de Reus et al.
Title Page
Abstract Introduction
Conclusions References
Tables Figures
◭ ◮
◭ ◮
Back Close
Full Screen / Esc
Print Version
Interactive Discussion
EGU incorporated into the particle. Since we do not explicitly account for chemical reactions
in the condensed phase, we substituteαbyγ. Sinceγis a measure for the net transfer of the species to the aerosol particle,α represents an upper limit ofγ.
Unfortunately no laboratory studies of the uptake of the HO2radical on mineral dust aerosol are documented, however, a few studies are performed to determine the uptake 5
of HO2 on different types of surfaces. Hanson et al. (1992), for example, determined the uptake of HO2 on a water and sulphuric acid surface and found reactive uptake coefficients of >0.01 and >0.05, respectively, while Cooper and Abbatt (1996) mea-sured net uptake coefficients for HO2 radicals on supercooled sulphuric acid water-ice surfaces of 0.055 and 0.025, respectively. The presence of free Cu ions in the 10
aerosol enhances the uptake of HO2on aqueous surfaces significantly (Mozurkewich et al., 1987). In a review Jacob (2000) concludes that the uptake of HO2by aqueous aerosols takes place with aγ of 0.1–1, and he recommends including the uptake of HO2 by aerosols withγ=0.2 in atmospheric chemistry models. This is also the value ofγ we deploy in this study. The author also concludes that although the mechanism 15
for HO2uptake is uncertain, H2O2is the likely product (Jacob, 2000).
Even fewer laboratory studies have been conducted on the uptake of H2O2 on dif-ferent types of surfaces. Worsnop et al. (1989) determined the mass accommoda-tion coefficient of H2O2 on aqueous surfaces. They found a strong negative tempera-ture dependence of the mass accommodation coefficient, with an uptake coefficient of 20
0.18±0.02 at 273 K. Clegg and Abbatt (2001) determined the absolute uptake of H2O2 on an ice surface to be 4×10⁹molecules cm−2, at an average ambient H2O2 mixing ratio of about 1 ppbv. For the maximum aerosol surface area of 500µm2/cm3observed during the major Saharan dust event during MINATROC, this will cause a negligible decrease in H2O2mixing ratio of much less than 1%. To our knowledge no laboratory 25
studies on the uptake of H2O2on mineral dust aerosol have been performed, therefore, different uptake coefficients will be tested in this study, starting with the value of 0.18.
ACPD
5, 655–702, 2005Trace gas scavenging in a dense Saharan
dust plume
M. de Reus et al.
Title Page
Abstract Introduction
Conclusions References
Tables Figures
◭ ◮
◭ ◮
Back Close
Full Screen / Esc
Print Version
Interactive Discussion
EGU complete size range from 6 nm to 10µm has been taken into account.
Trajectory analyses indicate that the dust-loaded airmasses travelled about 3 days from the source region in Africa (western Algeria and Mauritania) to the measurement station. Therefore, heterogeneous removal reactions were only activated the last three days of the simulation.
5
6.3.2. Results of heterogeneous chemistry calculations
To find the accommodation coefficient for the heterogeneous uptake of H2O2 on Sa-haran dust particles we altered the H2O2accommodation coefficient until the calc/obs ratio of H2O2was equal to one. For this all data points starting at 29 July were used and dry deposition, as described in Sect. 6.2.3, was included. When the uptake co-10
efficient for aqueous surfaces is used (γ=0.18) almost all H2O2 is scavenged and the calc/obs ratio of H2O2 decreases to 0.03. A calc/obs ratio of H2O2 of one was found for a much lower accommodation coefficient, 3×10⁻⁴. The corresponding average re-moval rate of H2O2, kj, during the major dust event was 5×10−
6
s−1. The results of the simulation with this accommodation coefficient are shown in Fig. 6a. From the 265 15
data points 93% of the modelled H2O2 mixing ratios were within a factor of 2 of the observed mixing ratio.
The influence of the reduced H2O2 mixing ratios on ROx appears to be relatively small; the calc/obs ratio of ROxdecreases from 1.41 in the run without heterogeneous removal reactions to 1.39 in the run with H2O2 scavenging. Hence, the reduced ROx 20
mixing ratios observed during the dust event cannot be explained by heterogeneous removal of H2O2 on Saharan dust aerosol. Therefore, we investigated the effect of heterogeneous removal of HO2 on Saharan dust particles on the ROx mixing ratio. For this an uptake coefficient of 0.2 is assumed, according to the recommendation of Jacob (2000), corresponding to a first order rate coefficient, kj, of 2×10⁻³s−1during the 25
ACPD
5, 655–702, 2005Trace gas scavenging in a dense Saharan
dust plume
M. de Reus et al.
Title Page
Abstract Introduction
Conclusions References
Tables Figures
◭ ◮
◭ ◮
Back Close
Full Screen / Esc
Print Version
Interactive Discussion
EGU In spite of the relatively high uptake coefficient, heterogeneous removal of HO2
causes only a small decrease in the ROx mixing ratio. The calc/obs ratio of ROx de-creases from 1.41 in the run without heterogeneous removal reactions to 1.34 in the run with heterogeneous removal of HO2(see Fig. 6b). Even when an uptake coefficient of 1 is assumed the model still overestimates the ROx mixing ratio (ROxcalc/obs=1.21). 5
The relatively small change in the calculated ROxmixing ratio indicates that the hetero-geneous removal reaction of HO2 is slow compared to the fast gas phase production and destruction reactions of HO2. The effect of heterogeneous removal of HO2on the H2O2mixing ratio, however, is very strong. The H2O2mixing ratio decreases to almost the observed value (H2O2calc/obs=1.04) when heterogeneous removal of HO2with an 10
uptake coefficient of 0.2 is included in the model. Hence, if no H2O2 is formed during the uptake reaction of HO2 on Saharan dust particles, only including heterogeneous removal of HO2leads to a good agreement between the calculated and observed H2O2 mixing ratios. Note that a calc/obs ratio of H2O2of exactly one is reached when hetero-geneous removal of H2O2with an accommodation coefficient of 7×10⁻⁵is additionally 15
included in the model.
If we assume that H2O2is formed when HO2is taken up in the Saharan dust aerosol the H2O2mixing ratio increases strongly compared to the run without heterogeneous chemistry, while the effect on ROx is marginal. During the major dust event the cal-culated H2O2 mixing ratio exceeds 5 ppbv, and an average calc/obs ratio of H2O2 of 20
1.92 is calculated. Heterogeneous removal of H2O2 with an accommodation coeffi -cient of 1.7×10⁻³had to be included to restore the agreement between calculated and observed values.
6.4. Ozone production rates
The model calculations have been set up to calculate the steady state concentrations 25
compar-ACPD
5, 655–702, 2005Trace gas scavenging in a dense Saharan
dust plume
M. de Reus et al.
Title Page
Abstract Introduction
Conclusions References
Tables Figures
◭ ◮
◭ ◮
Back Close
Full Screen / Esc
Print Version
Interactive Discussion
EGU ison of calculated and observed O3 mixing ratios, and drawing conclusions about for
example ozone uptake on Saharan dust particles. This would require a model calcula-tion along a back-trajectory, however, the concentracalcula-tion values needed to constrain the model over the dust source region are not available.
Instead, we focus on the calculation of the net ozone production rate (NOP) during 5
the campaign, to try to explain the low ozone mixing ratios observed during the major dust event by changes in the ozone production and loss rates. The method to deter-mine the NOP has been introduced by Liu et al. (1980) and is summarised below. A detailed description of the procedure can also be found in Fischer et al. (2003) for the first part of the MINATROC project.
10
The net ozone production rate can be described as the difference between the ozone production (PO3={k1[HO2]+k2[CH3O2]}[NO]) and loss rates (LO3=(f x JO1D+k3[OH]+k4[HO2]) [O3]), where k1 and k2 are the reaction rates of the reaction of NO with HO2and CH3O2, respectively, f is the fraction of O
1
D atoms reacting with H2O to produce OH rather than being deactivated through collisions with air molecules, 15
JO1D is the photolysis rate of O3, and k3 and k4 are the reaction rates of the reaction of O3 with OH and HO2, respectively. In this approach, it is assumed that ozone loss due to dry deposition, heterogeneous reactions, uptake in cloud droplets and reactions with unsaturated VOCs are negligible.
The mixing ratios of NO, O3, H2O (needed to calculate f) and the ozone photolysis 20
rate were measured during MINATROC, while the OH, HO2 and CH3O2 mixing ratios were calculated by the model (the run with reduced isoprene and CH3OOH mixing ratios is used here). The net ozone production rate is shown in Fig. 7a, and ranges between 0 and 6 ppbv/hr. During the major dust event relatively low ozone production rates are calculated. The daytime mean NOP is 0.32±0.21 ppbv/hr during the major 25
ACPD
5, 655–702, 2005Trace gas scavenging in a dense Saharan
dust plume
M. de Reus et al.
Title Page
Abstract Introduction
Conclusions References
Tables Figures
◭ ◮
◭ ◮
Back Close
Full Screen / Esc
Print Version
Interactive Discussion
EGU The reactions of NO with HO2 and CH3O2 dominate the net O3 production rate. On
the other hand, the loss terms are very small. The difference between dust-loaded and dust-poor airmasses is also determined by the difference in primary ozone production through the relatively low ROxand NO mixing ratios in the Saharan dust airmasses.
Since the ROxmixing ratio is overestimated by the boxmodel during the dust event, 5
the NOP is also calculated using the measured ROx values, maintaining the HO2/RO2 ratio as calculated by the boxmodel. Therefore, the modelled HO2 and CH3O2 con-centrations were scaled using the calc/obs ratio of ROx. When doing so, the mean daytime NOP during the dust event decreased to 0.14±0.13 ppbv/hr, while the NOP in the dust-poor airmasses remained the same.
10
The relatively low ROx and NO mixing ratios observed during the major dust event cause a significant reduction in the net ozone production rate, however, the values re-main positive. On average the difference in daytime mean O3 mixing ratio between the dust-loaded and dust-poor airmasses was 17 ppbv, while the difference in NOP was 0.74 and 0.92 ppbv/hr for the modelled and observed ROx mixing ratios, respec-15
tively. Within 23 and 18 h of sunlight, respectively, a difference of 17 ppbv O3 could be achieved, which corresponds to an air mass “age” of 2 to 3 days (assuming 10 h sunshine per day), which is close to the estimated age of the dust-loaded airmasses. However, since the ozone mixing ratios observed in the dust-loaded airmasses are relatively low, a net ozone production of 0.14–0.32 ppbv/hr during the last three days 20
would mean that the O3 mixing ratio in the source region was even lower, about 25– 30 ppbv. The low O3mixing ratio observed in the dust-loaded airmasses would then be attributed to the transport of O3 poor air from the North African continent to the mea-surement site. On the other hand, the relatively high NO mixing ratios observed at the measurement site are at least partly due to transport from the local boundary layer, and 25
ACPD
5, 655–702, 2005Trace gas scavenging in a dense Saharan
dust plume
M. de Reus et al.
Title Page
Abstract Introduction
Conclusions References
Tables Figures
◭ ◮
◭ ◮
Back Close
Full Screen / Esc
Print Version
Interactive Discussion
EGU removal of O3 on Saharan dust aerosol. Ozone destruction at the surface and cloud
uptake could be important at this measurement site as well, however, it probably did not cause the difference between the O3mixing ratio observed in the dust-loaded and dust-poor air masses, since the cloud and surface conditions did not change during the campaign.
5
Due to the relatively high NO mixing ratios observed on several days during the MI-NATROC campaign, the average net ozone production rate is high compared to other campaigns. The daily average NOP ranged between 0.16 and 3.7 ppbv/hr, and the corresponding daily average NO mixing ratio was between 27 and 265 pptv. During the first MINATROC campaign at Mt. Cimone the daytime mean NOP ranged between 10
−0.1 and 0.3 ppbv/hr for an average daily mean NO mixing ratio of about 40 pptv (Fis-cher et al., 2003), comparable to the days with lower NO mixing ratios at Iza ˜na. At Mauna Loa, a mountain station at about the same latitude as Iza ˜na, being much fur-ther away from pollution sources, net ozone destruction was found. During the summer of 1992 an average midday NOP of−0.15 ppbv/hr was calculated at an average NO 15
mixing ratio of 19 pptv (Cantrell et al., 1996).
7. Summary and conclusions
During the Saharan dust event reduced mixing ratios of O3, ROx, NOxand H2O2were observed compared to the rest of the campaign. The daytime mean O3, NOxand H2O2 mixing ratios dropped by 33%, 35% and 48% during the dust event, respectively, while 20
the midday maximum ROxmixing ratio decreased by 47% compared to the dust-poor days.
Using the MECCA chemistry box model, steady state concentrations of ROx, HCHO and H2O2 were simulated and compared to the observed mixing ratios. The observed ROx mixing ratios could be reproduced within a factor of two of the observed values, 25