An Assessment of the Expected
Cost-Effectiveness of Quadrivalent Influenza
Vaccines in Ontario, Canada Using a Static
Model
Ayman Chit1,2
*, Julie Roiz3, Samuel Aballea4
1Health Outcomes and Economics—North America, Sanofi Pasteur, Toronto, Ontario, Canada,2Faculty of Pharmacy, University of Toronto, Toronto, Ontario, Canada,3Creativ-Ceutical Ltd, London, United
Kingdom,4Creativ-Ceutical SARL, Paris, France
*Ayman.chit@sanofipasteur.com
Abstract
Ontario, Canada, immunizes against influenza using a trivalent inactivated influenza vac-cine (IIV3) under a Universal Influenza Immunization Program (UIIP). The UIIP offers IIV3 free-of-charge to all Ontarians over 6 months of age. A newly approved quadrivalent inacti-vated influenza vaccine (IIV4) offers wider protection against influenza B disease. We explored the expected cost-utility and budget impact of replacing IIV3 with IIV4, within the context of Ontario’s UIIP, using a probabilistic and static cost-utility model. Wherever possi-ble, epidemiological and cost data were obtained from Ontario sources. Canadian or U.S. sources were used when Ontario data were not available. Vaccine efficacy for IIV3 was obtained from the literature. IIV4 efficacy was derived from meta-analysis of strain-specific vaccine efficacy. Conservatively, herd protection was not considered. In the base case, we used IIV3 and IIV4 prices of $5.5/dose and $7/dose, respectively. We conducted a sensitiv-ity analysis on the price of IIV4, as well as standard univariate and multivariate statistical uncertainty analyses. Over a typical influenza season, relative to IIV3, IIV4 is expected to avert an additional 2,516 influenza cases, 1,683 influenza-associated medical visits, 27 influenza-associated hospitalizations, and 5 influenza-associated deaths. From a societal perspective, IIV4 would generate 76 more Quality Adjusted Life Years (QALYs) and a net societal budget impact of $4,784,112. The incremental cost effectiveness ratio for this com-parison was $63,773/QALY. IIV4 remains cost-effective up to a 53% price premium over IIV3. A probabilistic sensitivity analysis showed that IIV4 was cost-effective with a probabil-ity of 65% for a threshold of $100,000/QALY gained. IIV4 is expected to achieve reductions in influenza-related morbidity and mortality compared to IIV3. Despite not accounting for herd protection, IIV4 is still expected to be a cost-effective alternative to IIV3 up to a price premium of 53%. Our conclusions were robust in the face of sensitivity analyses.
OPEN ACCESS
Citation:Chit A, Roiz J, Aballea S (2015) An Assessment of the Expected Cost-Effectiveness of Quadrivalent Influenza Vaccines in Ontario, Canada Using a Static Model. PLoS ONE 10(7): e0133606. doi:10.1371/journal.pone.0133606
Editor:Jen-Hsiang Chuang, Centers for Disease Control, TAIWAN
Received:October 30, 2014
Accepted:June 29, 2015
Published:July 29, 2015
Copyright:© 2015 Chit et al. This is an open access article distributed under the terms of theCreative Commons Attribution License, which permits unrestricted use, distribution, and reproduction in any medium, provided the original author and source are credited.
Data Availability Statement:All relevant data are within the paper and its Supporting Information files.
Funding:The study was funded by Sanofi Pasteur. The study was funded by Sanofi Pasteur through the provision of author salaries and research material. The authors of the study had full control of study design, data collection and analysis, decision to publish, and preparation of the manuscript.
Introduction
In 2000, the province of Ontario, Canada established a Universal Influenza Immunization Pro-gram (UIIP) to provide free influenza vaccine to all eligible members of the public. Trivalent inactivated influenza vaccine (IIV3) is the current vaccine used in Ontario. A new quadrivalent inactivated influenza vaccine (IIV4) has been recently licensed in Canada [1,2], and Ontario is faced with a decision on the adoption of IIV4 into its UIIP program.
Traditional IIV3 contains antigens from three viral strains: A(H1N1), A(H3N2), and one of two co-circulating B lineages, B(Victoria) or B(Yamagata). Each year, the World Health Organization (WHO) decides which viral strains should be included in the next seasonal influ-enza vaccine. However, accurately predicting which B-lineage strain will predominate in the upcoming season has proven to be a challenging task resulting in frequent mismatches with the vaccine strain [3]. During mismatch seasons, efficacy and effectiveness against the opposite B lineage were lower [4–10]. To address the issue of co-circulating B lineages, several manufac-turers have developed IIV4s containing a strain from each B-lineage.
DiazGranados and colleagues [11], as well as Tricco and colleagues [12], showed that IIV3 provides cross-protection during influenza B mismatch situations. IIV3 efficacy was observed to be 86% against the same lineage and 51% against the opposite lineage influenza B [11]. Sev-eral studies have explored the expected public health and economic impact of IIV4 compared to IIV3 in the United States [13–15], United Kingdom [16], and Hong Kong [17]. Some studies included the emerging evidence on cross-protection [15,17], while others assumed no cross-protective benefit of IIV3 [13,14,16]. All studies, however, concluded that IIV4 can offer a health and economic benefit over IIV3 even if IIV4 was priced at a premium.
The objective of this analysis was to leverage the new emerging data on cross-protection and use a conservative static mathematical model to estimate the cost-utility and budget impact of replacing IIV3 with IIV4 within the context of Ontario’s UIIP.
Methods
Model Structure
Our modeling strategy was based on simulating the impact of IIV3 or IIV4 under the UIIP in an influenza season with an average influenza disease rate for the period between 2000–2001 and 2007–2008. We ran three basic simulations for this season in Ontario: 1) No influenza immunization program, 2) an IIV3 UIIP, and 3) an IIV4 UIIP. The main outputs of each simu-lation were the numbers of work days lost, general practitioner (GP) visits, emergency depart-ment (ED) visits, hospitalizations, and deaths. The model accounts for quality-adjusted life-years (QALYs) lost due to clinically relevant cases of influenza (cases resulting in a visit to the GP or ED, hospitalized cases, as well as influenza-related deaths).
Our model starts by calculating the rates of study outcomes in an unvaccinated population of Ontarians for the period between 2000–2001 and 2007–2008. No herd effects were consid-ered during this calculation. The calculation was performed through the following equation:
R0ij¼
Rij
Cjð1 VE3ijÞ þ ð1 CjÞ
Where R’ijis the mean rate of outcome i in age group j in a unvaccinated population over the study period; and where i considered 4 different outcomes: GP visits, ED visits, hospitaliza-tions, and deaths, while j was stratified into 5 groups:4, 5–19, 20–49, 50–64,65 years of age. Rijrepresents the mean rate of outcome i in age group j, over the study period when IIV3
was used under the UIIP in Ontario. Cjis the IIV3 coverage level over that same period. VE3ij describes the IIV3 effectiveness against outcome i in age group j.
The rates of disease outcomes under the IIV3 program for the study period were available from the literature and defined above as Rij. However, for the IIV4 program we used the follow-ing equation to estimate the expected outcome rates:
R@ij¼R 0
ijð1 CijÞ þR0ijCijð1 VE4ijÞ
Where i and j still represent outcome type and age group respectively. R”ijrepresents the out-come rate under the IIV4 program and VE4ijrepresents the IIV4 effectiveness.
As we did not have direct estimates of VE4ij, we derived them from other data sources. First, IIV3 effectiveness in children and adults was obtained from Reed et al [13]. In addition, we used a recently published meta-analysis by DiazGranados et al [11] on the efficacy of inacti-vated vaccines against matched and mismatched circulating influenza B to account for cross-protection offered by IIV3 against mismatched circulating virus. Below is a description of our methodology.
We start by re-rewriting how Reed and colleagues defined IIV3 VE:
VER3¼
XIV
i¼I ðxiVEiÞ
VER3is the vaccine effectiveness estimate from Reed et al for IIV3.irepresents the various influenza strains whereI–IVrepresent H1N1, H3N2, Bmatch, Bmismatchrespectively,xiis the proportion of strainirelative to overall influenza circulation, andVEiis the vaccine effective-ness against straini.
Since Reed et al estimated that IIV3 provides no protection against Bmismatch, we next calcu-lated an adjusted VE for children and adults,VECA3, that accounts for cross-protection where VEB mismatch= 0.6(VEB match).
VECA3¼
XIV
i¼I ðxiVEiÞ
Efficacy of IIV4 is derived similarly, assuming VEB mismatch= VEB match:
VECA4¼
XIII
i¼I ðxiVEiÞ
i still represents the number of influenza strains, however, the VE against mismatched B is not considered. Instead, I–III represent H1N1, H3N2, and B respectively.
Beyer and colleagues [18] estimated that the VE in seniors was lower than that reported by Reed et al [13] for the overall population. This is in line with immunosenescence in seniors. To account for this, we calculated a correction factor,α, to reflect the difference between expected
VE in the general population and that in seniors.
a¼
VEBeyer
VER3
Where, VEBeyeris the vaccine effectiveness estimate from the Beyer et al meta-analysis. VE of IIV3 in seniors, VES3, was then modeled in accordance with the equation below:
Next, we modeled the VE of IIV4 in seniors, VES4, in accordance with the equation below:
VES4 ¼aVECA4
After estimating the outcomes expected under each vaccine program, Quality of Life (QoL) data were combined with the outcome data to estimate the total number of QALYs a program would produce. Each outcome reduced the overall QoL as a function of the outcome duration and the disutility associated with influenza applied over that period. For influenza associated deaths, QALYs were lost from time of death until the life expectancy. The costs of the various outcomes were also calculated by multiplying outcome by their unit cost estimates. Finally, dif-ferences in total costs and total QALYs were computed and incremental cost effectiveness ratios (ICERs). The ICER was defined as (CostIIV4–CostIIV3)/(OutcomesIIV4–OutcomesIIV3).
Potential adverse effects of influenza vaccination were not represented in the model. These generally involve mild-to-moderate injection-site or systemic effects that are transient with negligible cost and little impact on quality of life [19]. Further, studies have shown no signifi-cant differences between the adverse event profile of IIV3 and IIV4 [19].
S1 Modelcontains a copy of the functioning model in Microsoft Excel (S1 Model).
Model Inputs
Table 1summarizes all the input parameters of the model. Results from two publications were used extensively. Firstly, Kwong et al provided rates of coverage, GP consultation, ED visit, hospitalization, and death by age group [20]. Secondly, we relied on Sander et al’s work for eco-nomic data including QALYs lost due to influenza and Ontario-based cost data [21].
Other data were obtained from a search in PubMed and statistics data bases. We used Cana-dian and Ontarian statistics whenever possible. In instances where CanaCana-dian statistics were not available, we referenced data from other countries with a geographic and socio-economic milieu similar to Ontario and Canada, such as the United States. All cost data were inflated to 2012 Canadian dollars using the medical component of the consumer price index for Canada [22]. Beyond that all outcomes and cost were discounted at a 5% annual rate.
Epidemiological Inputs
The study by Kwong et al provided annual influenza-associated outcome rates (GP visit, ED visit, hospitalization, death) from the 2000–2001 season to the 2003–2004 season [20]. Given the annual variability in the epidemiology of influenza, we were concerned that this limited time period would not constitute a representative sample to provide a valid estimate of the average burden of influenza in Ontario under the UIIP. For instance, it is possible that during these four years influenza circulation would be high and dominated by Influenza B. This would clearly bias our analysis in favor of IIV4. Accordingly, we leveraged US data on influenza-related outcome rates to employ an extrapolation beyond the Kwong et al data. This extrapola-tion involved two steps. First, we used data from the US to estimate the ratio between the influ-enza-related events in US [23,24] and Ontario [20] during the influenza seasons 2000–2001 to 2003–2004. Secondly, we used this ratio to adjust US-based influenza outcome rates for the sea-sons 2004–2005 to 2007–2008. The adjusted rates for the aforementioned period were then taken to be representative of Ontario’s outcome rates during the same time period.
Table 1. Model inputs.
Input Mean DSA*Range PSA†
distribution Source
Population characteristics (Ontario) Population size
4 years 704,260 NA NA [34]
5–19 years 2,340,140 NA NA [34]
20–49 years 5,292,680 NA NA [34]
50–64 years 2,636,405 NA NA [34]
65 years 1,878,330 NA NA [34]
Life expectancy (years)
4 years 79.56 NA NA [34]
5–19 years 69.40 NA NA [34]
20–49 years 47.23 NA NA [34]
50–64 years 27.23 NA NA [34]
65 years 12.96 NA NA [34]
Vaccine coverage
4 years 31.00% 0.2514–0.3686 Normal (0.31;0.01) [20]
5–19 years 31.00% 0.2514–0.3686 Normal (0.31;0.01) [20]
20–49 years 27.00% 0.2107–0.3293 Normal (0.27;0.01) [20]
50–64 years 47.00% 0.3971–0.5429 Normal (0.47;0.01) [20]
65–74 years 71.00% 0.6566–0.7634 Normal (0.71;0.01) [20]
75–84 years 81.00% 0.7655–0.8545 Normal (0.81;0.01) [20]
85 years 78.00% 0.7655–0.7945 Normal (0.78;0.02) [20]
Influenza-related GP‡consultation rate (per 100,000)
4 years 1,932.81 1,917–1,949 LogNormal (1,933;68) [20,23,24]
5–19 years 1,441.87 1,430–1,454 LogNormal (1,442;36) [20,23,24]
20–49 years 636.75 629–645 LogNormal (637;16) [20,23,24]
50–64 years 457.90 450–466 LogNormal (458;17) [20,23,24]
65–74 years 634.13 624–645 LogNormal (634;29) [20,23,24]
75–84 years 1,287.67 1,273–1,303 LogNormal (1,288;59) [20,23,24]
85 years 3,224.15 3,200–3,248 LogNormal (3,224;149) [20,23,24]
Influenza-related ED§consultation rate (per 100,000)
4 years 556.88 548–566 LogNormal (557;20) [20,23,24]
5–19 years 180.17 176–184 LogNormal (180;5) [20,23,24]
20–49 years 84.87 82–88 LogNormal (85;2) [20,23,24]
50–64 years 63.28 60–66 LogNormal (63;2) [20,23,24]
65–74 years 181.28 176–187 LogNormal (181;8) [20,23,24]
75–84 years 398.31 390–406 LogNormal (398;18) [20,23,24]
85 years 1148.01 1,134–1,162 LogNormal (1,148;53) [20,23,24]
Influenza-related hospitalization rate (per 100,000)
4 years 54.14 51.3–56.8 LogNormal (54;2) [20,23,24]
5–19 years 2.98 2.4–3.7 LogNormal (3;0) [20,23,24]
20–49 years 2.75 2.4–3.7 LogNormal (3;0) [20,23,24]
50–64 years 4.59 4.2–5.9 LogNormal (5;0) [20,23,24]
65–74 years 34.87 32.3–37.9 LogNormal (35;2) [20,23,24]
75–84 years 131.22 126.3–135.9 LogNormal (131;6) [20,23,24]
85 years 432.44 423.3–440.8 LogNormal (432;20) [20,23,24]
Influenza-related death rate (per 100,000)
4 years 0.40 0.24–0.63 LogNormal (0.4;0.01) [20,23,24]
Table 1. (Continued)
Input Mean DSA*Range PSA†distribution Source
5–19 years 0.40 0.24–0.63 LogNormal (0.4;0.01) [20,23,24]
20–49 years 0.40 0.19–0.74 LogNormal (0.4;0.02) [20,23,24]
50–64 years 1.30 0.89–1.84 LogNormal (1.3;0.06) [20,23,24]
65–74 years 6.20 5.15–7.40 LogNormal (6.2;0.33) [20,23,24]
75–84 years 28.40 26.06–30.89 LogNormal (28.4;1.52) [20,23,24]
85 years 134.30 129.13–139.62 LogNormal (134.3;7.16) [20,23,24]
Number of non-consulting cases for one consulting
All ages 0.49 0.2–1 [20]
Quality of life
Population utility norms
4 years 0.92 0.911–0.929 Normal (0.92;0.0047) [35,36]
5–19 years 0.89 0.867–0.915 Normal (0.89;0.0122) [35,36]
20–49 years 0.90 0.846–0.957 Normal (0.9;0.0281) [35,36]
50–64 years 0.85 0.787–0.907 Normal (0.85;0.0306) [35,36]
65 years 0.80 0.670–0.929 Normal (0.8;0.0661) [35,36]
QALYs**lost to influenza
4 years 0.0146 0.0065–0.0146 Beta (8.4;569) [21]
5–19 years 0.0146 0.0065–0.0146 Beta (8.4;569) [21]
20–49 years 0.0174 0.0097–0.0245 Beta (14.6;826) [21]
50–64 years 0.0174 0.0044–0.0245 Beta (3.6;206) [21]
65 years 0.0293 0.0233–0.0349 Beta (79.8;2,642) [21]
Workdays lost
Total annual hours lost to influenza (%)
4 years 0 NA NA [37]
5–19 years 0.0888% NA NA [37]
20–49 years 0.0993% NA NA [37]
50–64 years 0.0451% NA NA [37]
65 years 0.0451% NA NA [37]
Monetary costs ($CAD)
GP consultation1 35 18–60 LogNormal (35;13) [21]
ED consultation1 220 183–371 LogNormal (220;77) [21]
Hospitalization1 6,418 2,075–21,548 LogNormal (6,418;7,720) [21]
Medication 3 NA Uniform (1;5) [38]
Vaccine (per dose)
IIV3†† 5.5 NA NA Sano
fiPasteur IIV4‡‡
7 NA NA SanofiPasteur
Hourly labor 24.46 NA NA [26]
Strain-specific vaccine efficacy
A/H1N1 0.58 0.457–0.698 Beta (36.57;26.48) [13]
A/H3N2 0.53 0.410–0.648 Beta (34.91;30.96) [13]
Matched B 0.47 0.267–0.678 Beta (9.93;11.2) [13]
Mismatched B 0.28 0.166–0.411 Beta (13.98;35.96) [11;13]
data were only stratified by age, and we used data from Reed et al. to stratify by strain [13]. Since the data in the Kwong et al study were not stratified by influenza subtype, we superim-posed the stratification from the aforementioned US data sources for the period 2000–2001 to 2003–2004 onto the Kwong data.
Cost Inputs
Costs were estimated from the perspective of the Ontario ministry of health (MOH) and the provinces as a whole (societal perspective). The health care system perspective included the cost of administering vaccine and the cost of managing influenza disease as it is covered by the health care system in Ontario. The societal perspective was inclusive of the health care system perspective and further considers medication costs for Ontarians below the age of 65, as well as productivity losses for the working population in Ontario.
IIV3 and IIV4 are purchased under a Canadian federal tender where it is possible for differ-ent manufacturers to have differdiffer-ent prices. The average prices paid by Ontario for IIV3 and IIV4 are not publically available. Further, as tenders are renewed either every three years or annually, the prices will change over time. In this analysis we used an IIV3 price of $5.5/dose and an IIV4 price of $7/dose in the base case. We then conducted a sensitivity analysis on the difference in price between the two vaccines (IIV4 price premium).
Productivity losses were estimated based on the friction method to include losses due to absenteeism and losses due to premature death [25]. Work loss was assumed to occur amongst employed Ontarians experiencing symptomatic influenza, an influenza-associated hospitaliza-tion, or an influenza-related death (limited to 90 days post-death). The cost to a firm due to the absence of an employee depends on several factors. If the firm must replace the employee with an overtime/temporary worker, then the cost to the firm is equal to the overtime/temporary worker wages. If the employee can’t be replaced through an overtime/temporary worker, a firm might be able to sustain some degree of production while the employee is off sick. In the case that full production is sustained while the employee is off sick; then there is no cost to the firm as a result of the illness. In contrast, if the firm loses all the production associated with that employee not being at work, then the cost to the firm is the wages it pays the employee while they are at home, plus the opportunity cost, i.e. the profitability the employee would have gen-erated for the firm. As data defining many of these parameters are absent, we simplified by assuming that the firm’s cost due to the short term illness of one of its employees is equal to the average wages paid to that employee in Canada while they are off work sick. We note that there are two estimates of the hourly labor costs in Canada: $24.46/hour reported by Statistics Table 1. (Continued)
Input Mean DSA*Range PSA†distribution Source
Discount rate (%) 5 3–7 [39]
1Inflated to 2012 using Statistics Canada, CANSIM, table 326–0021, "Health and Personal care>Health care>Health care services".
*DSA: Deterministic Sensitivity Analysis †
PSA: Probabilistic Sensitivity Analysis ‡
GP: General Practitioner §ED: Emergency Department
**QALY: Quality-adjusted life-years
††
IIV3: Trivalent Inactivated Influenza Vaccine ‡‡
IIV4: Quadrivalent Inactivated Influenza Vaccine
Canada [26], and $46.4/hour reported by the Organization for Economic Co-operation and Development (OECD) [27]. Conservatively, we used the hourly labor cost reported by Statistics Canada in our base case analysis.
Sensitivity Analysis
Given the uncertainty around the difference in prices between IIV3 and IIV4 in Canada, we conducted a sensitivity analysis of the impact on the size of IIV4 price premium on the cost-effectiveness of the vaccine. Productivity costs also pose a source of non-statistical uncertainty and can be influential on the cost-effectiveness results. As such, we conducted a scenario analy-sis using $37/hour which is a 50% premium over the base case labor cost and also present a one-way sensitivity analysis of the impact of hourly Canadian worker wage on the cost-effec-tiveness of the IIV4. Further, we conducted one-way deterministic sensitivity analyses on the statistical distributions of all input parameters and results were presented as a tornado diagram. A multivariate probabilistic sensitivity analysis (PSA) of parameter statistical uncertainty was also conducted. PSA results were presented as a cost-effectiveness acceptability curve (CEAC).
Results
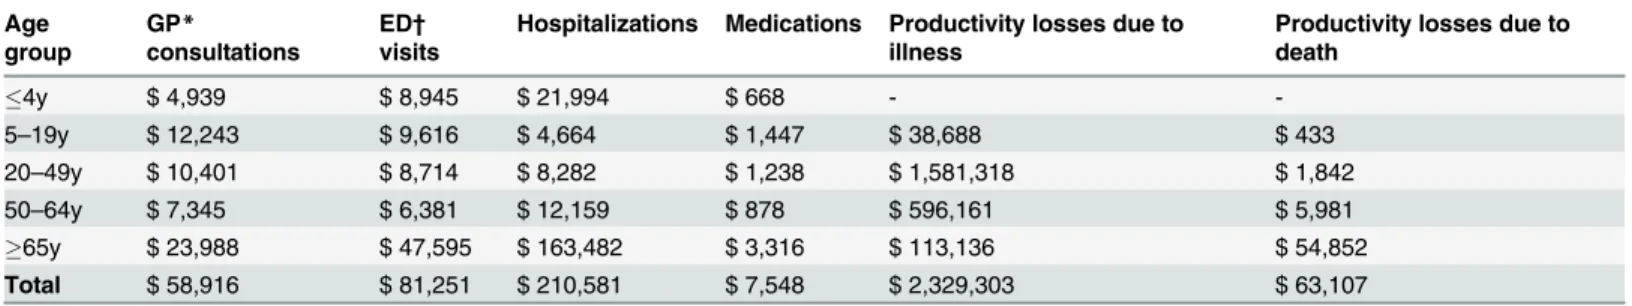
The use of IIV4 instead of IIV3 in an average Ontario influenza season would save 12,329 work days and avoid 1,380 GP visits, 303 ED visits, 27 hospitalizations, and 5 deaths. The distribu-tion of outcomes avoided by age is shown inTable 2. Most GP consultations would be avoided in the 5–19 and 20–49 years-old age groups, partly because of the larger size of these specific age groups. Most hospitalizations and almost all deaths would be prevented in individuals 50 years of age or older. The higher vaccination costs of IIV4 would be partially offset by reduc-tions in consultation and hospitalization costs as well as gains in productivity. The net annual budget impacts would be $4.8 million from a societal perspective and $7.2 million from a MOH perspective.Table 3summarizes the cost offsets associated with the use of IIV4.
The incremental cost-effectiveness ratios (ICERs) for switching from IIV3 to IIV4 are shown by age group and perspective inTable 4. For the base case, we estimated ICERs of $63,773/QALY from a societal perspective and $94,248/QALY from a MOH perspective. IIV4 was most cost-effective in individuals 65 years of age or older. The ICERs for this age group were $33,870/QALY from a societal perspective and $36,034/QALY from a MOH perspective.
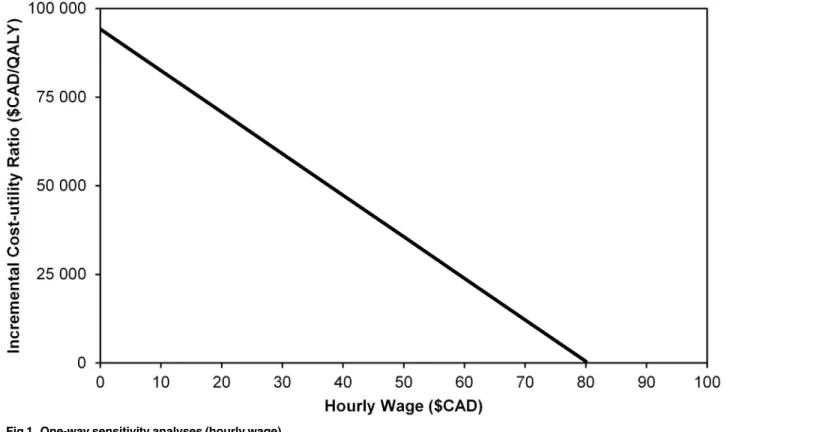
The cost faced by firms due to influenza-related absenteeism is an influential parameter in the cost-effectiveness analysis. InFig 1, we present a 1-way sensitivity analysis for the impact of the hourly labor cost on the ICER. Source data did not contain any statistical uncertainty Table 2. Health outcomes avoided with IIV4 in Ontario by age group.
Age group GP*consultations ED†
visits Hospitalizations Deaths Life-years gained QALYs‡
gained Workdays saved
4y 115.7 33.3 2.8 0.0 0.5 2.36
-5–19y 286.9 35.8 0.6 0.1 1.5 6.1 490
20–49y 243.7 32.5 1.1 0.1 2.5 7.0 8,131
50–64y 172.1 23.8 1.6 0.4 6.1 8.4 3,014
65y 562.0 177.4 20.9 4.7 38.1 52.1 694
Total 1,380 303 27 5 49 76 12,329
*GP: General Practitioner †ED: Emergency Department ‡
QALY: Quality-adjusted life-years
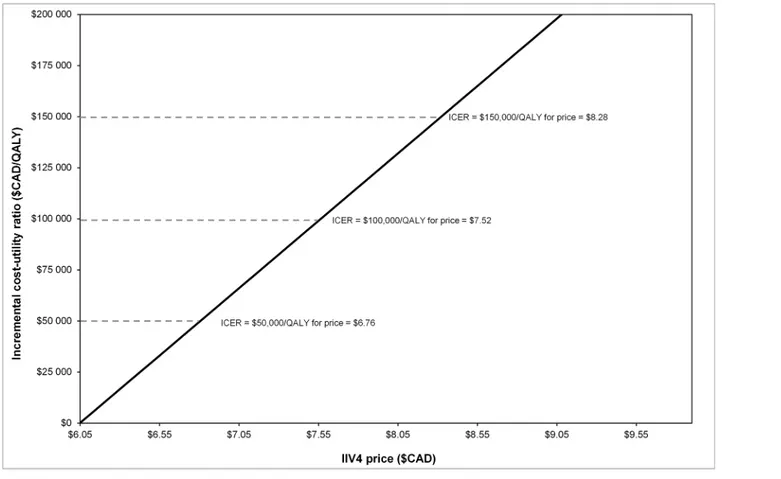
estimates for the hourly labor cost; however, we did find two different estimates for the mean hourly labor costs in Canada. The figures reported by Statistics Canada were presented in the base case. In a scenario analysis, we used the hourly wage of $37/hour and found that this reduced the base case ICER to $47,489/QALY.Fig 2shows how the ICER from the societal per-spective varied as a function of the IIV4 price premium. IIV4 would be cost-neutral (more effective at the same cost) at a price of $6.10/dose, and the ICER would be $150,000/QALY at a price of $8.40/dose. Accordingly, IIV4 is dominant at a price premium of 11% and remains below $150,000/QALY–(the likely upper limit of a Canadian cost effectiveness threshold) up to a price premium of 53%.
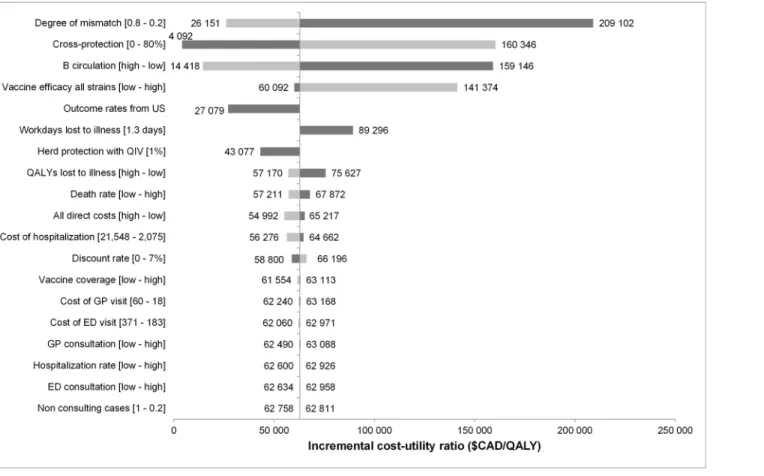
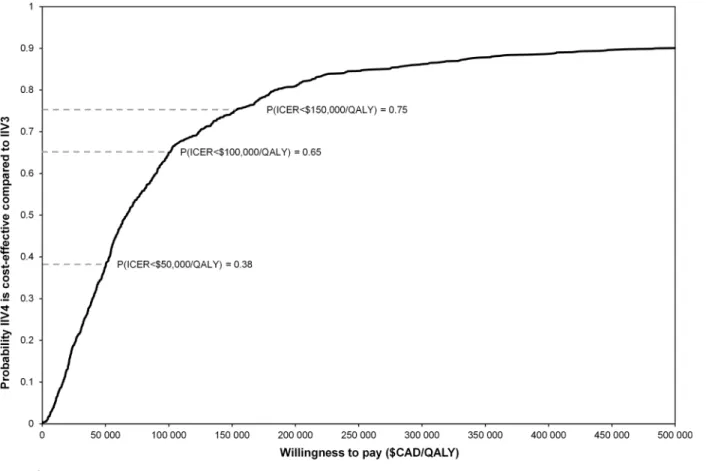
A tornado diagram highlighting the impact of univariate statistical uncertainty on the cost-effectiveness estimates is shown inFig 3. The model is most sensitive to the degree of mis-match, cross-protection, and circulation of B strain. The PSA results are presented inFig 4 where we find that 65% of the PSA simulations provided results below $100,000/QALY.
Discussion
The findings of this static modeling study show that IIV4 is expected to reduce the burden of influenza compared to IIV3 by preventing disease, reducing health care costs, and improving productivity in the work place. From a societal perspective, IIV4 would be cost-effective for Ontario’s UIIP at a price below $8.40/dose (53% price premium over IIV3). If the price of IIV4 Table 3. Cost offsets with IIV4 in Ontario ($CAD) by age group.
Age group
GP*
consultations
ED† visits
Hospitalizations Medications Productivity losses due to illness
Productivity losses due to death
4y $ 4,939 $ 8,945 $ 21,994 $ 668 -
-5–19y $ 12,243 $ 9,616 $ 4,664 $ 1,447 $ 38,688 $ 433
20–49y $ 10,401 $ 8,714 $ 8,282 $ 1,238 $ 1,581,318 $ 1,842
50–64y $ 7,345 $ 6,381 $ 12,159 $ 878 $ 596,161 $ 5,981
65y $ 23,988 $ 47,595 $ 163,482 $ 3,316 $ 113,136 $ 54,852
Total $ 58,916 $ 81,251 $ 210,581 $ 7,548 $ 2,329,303 $ 63,107
*GP: General Practitioner †
ED: Emergency Department
doi:10.1371/journal.pone.0133606.t003
Table 4. Incremental cost-effectiveness ratios of IIV4 versus IIV3 by age group.
Age group Incremental cost-effectiveness ratios ($CAD/QALY†
)
MOH*perspective Societal perspective
All ages $ 94, 248 $ 62,792
4y $ 112,274 $ 112,017
5–19y $ 174,525 $ 167,856
20–49y $ 303,851 76,351
50–64y $ 217,878 $ 146,192
65+ $ 36,034 $ 32,864
*MOH: Ministry of Health †
QALY: Quality-adjusted Life-years
drops below $6.10/dose (11% price premium over IIV3) an IIV4-based UIIP will be more effec-tive and less costly than an IIV3 based UIIP.
The International Society of Pharmacoeconomics and Outcomes Research and the Society of Medical Decision Making published a joint position paper on modeling standards for esti-mating the expected epidemiological impact and cost-effectiveness of immunization programs [28]. The recommendations indicate that dynamic models are necessary tools for investigating the impact of an intervention that affects disease transmission. Static models are only appropri-ate when their expectations suggest that the intervention would be cost effective. This is because dynamic models incorporating herd immunity would most likely only show additional benefits in favor of the intervention. It has been demonstrated by Loeb and colleagues, in a ran-domized controlled trial, that IIV3 can induce indirect protection though herd effects [29]. Accordingly, our estimation of the cost-effectiveness of IIV4 in Ontario is conservative and would support a decision to switch to IIV4 at prices below $8.40/dose. Further, our model would not be a useful tool to explore the cost-effectiveness of IIV4 at prices higher than $8.40/ dose, since this price approaches the likely upper limit of the Canadian cost-effectiveness threshold.
It should be noted that Canada does not have an explicit cost-effectiveness threshold used to inform adoption decisions. Further, the mechanism of how economic information factor into vaccine adoption decisions is heterogeneous across the provinces and not transparent [30]. To estimate the upper bound of the implicit threshold within Canadian healthcare we reviewed the ICERs of the 10 most recently approved and funded oncology medicines in Can-ada and found that 150,000/QALY was the mean ICER [31]. We selected Oncology medicines as they are known to be less cost-effective than other medical interventions, to the extent that in the UK there is an explicitly higher threshold allowed for end of life treatments.
Fig 1. One-way sensitivity analyses (hourly wage).
Our model has a novel feature in that it considers data from DiazGranados et al [11] and Tricco et al [12]. Both groups recently demonstrated that IIV3 provides cross-protection dur-ing influenza B mismatch situations. We were able to incorporate the estimate that IIV3 pro-vides 60% of the matched efficacy against lineage-mismatched influenza B [11]. It should be noted that these data were from studies of IIV3 administered to children and young adults; there were no data in individuals 65 years of age and older. We made the assumption that the size of this effect was constant across the age spectrum. In our deterministic sensitivity analysis, if the cross-protection was increased to 80% of the matched influenza B efficacy (across all age groups), the resulting base-case ICER would be $160,346/QALY.
The major limitation of our model is related to the quality of the Ontario influenza-related outcomes data. The only data available for Ontario were from a publication by Kwong and col-leagues [20]. These data were limited in three major ways; they were not stratified by influenza subtype, they used outcome definitions that are not sufficiently sensitive to capture some influ-enza-related complications, and they were limited to only 4 years after the introduction of the UIIP. The limitations of the data are further highlighted through a contrast with the US where researchers have access to time-series data for influenza-related morbidity and mortality strati-fied by age and by influenza subtype [23,24].
In the model, we leveraged the rich US data to make extrapolations for the province of Ontario. In doing so, we noted that hospitalization and death rates in some age groups were from 2-fold to more than 10-fold lower in Canada compared to the US. For example, in adults 50–64 years of age, the Ontario rate of influenza-related hospitalization was 4.6/100,000 [20] Fig 2. Threshold analysis: Incremental cost-effectiveness ratio (ICER) versus price of IIV4.
while the reported US rate was 63.2/100,000 [23]. Some of this difference might be related to the underlying health care systems in the two countries. However, some of the difference may also be explained by differences in the outcome definitions used to approximate the burden in each country. To some extent, Kwong et al’s estimates of influenza-related hospitalizations underestimate the actual burden of disease in Ontario. This is primarily because the authors only considered influenza-related hospitalizations coded as respiratory admissions. It is well established that influenza is implicated in triggering major circulatory medical events [32]. As such, the definition used by Kwong et al is clearly not broad enough to capture influenza-related hospitalizations that are coded as circulatory admissions. US estimates reported by sev-eral authors consider both respiratory and circulatory influenza-related hospitalizations and deaths [24,33]. To remain conservative, we downward-adjusted the US outcome rates reported during our study period to make them consistent with those estimated by Kwong et al as described in the methods section. In one of our deterministic sensitivity analyses, we removed the downward adjustment imposed on the US outcome rates. In doing so, the ICER was reduced to $28,351/QALY. This point highlights a conservative feature of our economic model and the need for better and more accessible influenza-related outcome data in Ontario and Canada.
In conclusion, our findings from this economic evaluation indicate that a switch in Ontar-io’s UIIP from IIV3 to IIV4 would prevent influenza-related lost productivity, GP consulta-tions, hospitalizaconsulta-tions, and deaths. IIV4 remains cost-effective up to a 53% price premium over IIV3.
Fig 3. Deterministic sensitivity analysis (societal perspective).
Supporting Information
S1 Model. IIV4 cost-effectiveness model in Microsoft Excel.
(XLSM)
Author Contributions
Conceived and designed the experiments: AC JR SA. Performed the experiments: JR. Analyzed the data: JR SA. Contributed reagents/materials/analysis tools: JR SA. Wrote the paper: JR AC.
References
1. GlaxoSmithKline. FluLaval Tetra Product Monograph. 2014. Available:http://www.gsk.ca/english/ docs-pdf/product-monographs/FluLaval-Tetra.pdf.
2. Sanofi Pasteur. Fluzone Quadrivalent Product Monograph. 2014. Available:http://www.sanofipasteur. ca/sites/default/files/sites/default/files/pictures/450-FluzoneQIV-PM-E.pdf.
3. Ambrose CS, Levin MJ. The rationale for quadrivalent influenza vaccines. Hum Vaccin Immunother. 2012; 8(1):81–88. doi:10.4161/hv.8.1.17623PMID:22252006
4. Skowronski DM, Masaro C, Kwindt TL, Mak A, Petric M, Li Y, et al. Estimating vaccine effectiveness against laboratory-confirmed influenza using a sentinel physician network: results from the 2005–2006 season of dual A and B vaccine mismatch in Canada. Vaccine. 2007; 25(15):2842–2851. PMID:
17081662
5. Beran J, Wertzova V, Honegr K, Kaliskova E, Havlickova M, Havlik J, et al. Challenge of conducting a placebo-controlled randomized efficacy study for influenza vaccine in a season with low attack rate and a mismatched vaccine B strain: a concrete example. BMC Infect Dis. 2009; 9:2. doi: 10.1186/1471-2334-9-2PMID:19149900
Fig 4. Cost-effectiveness acceptability curve.
6. Skowronski DM, De SG, Dickinson J, Petric M, Mak A, Fonseca K, et al. Component-specific effective-ness of trivalent influenza vaccine as monitored through a sentinel surveillance network in Canada, 2006–2007. J Infect Dis. 2009; 199(2):168–179. doi:10.1086/595862PMID:19086914
7. Frey S, Vesikari T, Szymczakiewicz-Multanowska A, Lattanzi M, Izu A, Groth N, et al. Clinical efficacy of cell culture-derived and egg-derived inactivated subunit influenza vaccines in healthy adults. Clin Infect Dis. 2010; 51(9):997–1004. doi:10.1086/656578PMID:20868284
8. Belongia EA, Kieke BA, Donahue JG, Coleman LA, Irving SA, Meece JK, et al. Influenza vaccine effec-tiveness in Wisconsin during the 2007–08 season: comparison of interim and final results. Vaccine. 2011; 29(38):6558–6563. doi:10.1016/j.vaccine.2011.07.002PMID:21767593
9. Heinonen S, Silvennoinen H, Lehtinen P, Vainionpaa R, Ziegler T, Heikkinen T. Effectiveness of inacti-vated influenza vaccine in children aged 9 months to 3 years: an observational cohort study. Lancet Infect Dis. 2011; 11(1):23–29. doi:10.1016/S1473-3099(10)70255-3PMID:21106443
10. Janjua NZ, Skowronski DM, De SG, Dickinson J, Crowcroft NS, Taylor M, et al. Estimates of influenza vaccine effectiveness for 2007–2008 from Canada's sentinel surveillance system: cross-protection against major and minor variants. J Infect Dis. 2012; 205(12):1858–1868. doi:10.1093/infdis/jis283
PMID:22492921
11. DiazGranados CA, Denis M, Plotkin S. Seasonal influenza vaccine efficacy and its determinants in chil-dren and non-elderly adults: a systematic review with meta-analyses of controlled trials. Vaccine. 2012; 31(1):49–57. doi:10.1016/j.vaccine.2012.10.084PMID:23142300
12. Tricco AC, Chit A, Soobiah C, Hallett D, Meier G, Chen MH, et al. Comparing influenza vaccine efficacy against mismatched and matched strains: a systematic review and meta-analysis. BMC Med. 2013; 11:153. doi:10.1186/1741-7015-11-153PMID:23800265
13. Reed C, Meltzer MI, Finelli L, Fiore A. Public health impact of including two lineages of influenza B in a quadrivalent seasonal influenza vaccine. Vaccine. 2012; 30(11):1993–1998. doi:10.1016/j.vaccine. 2011.12.098PMID:22226861
14. Lee BY, Bartsch SM, Willig AM. The economic value of a quadrivalent versus trivalent influenza vac-cine. Vacvac-cine. 2012; 30(52):7443–7446. doi:10.1016/j.vaccine.2012.10.025PMID:23084849
15. Clements KM, Meier G, McGarry LJ, Pruttivarasin N, Misurski DA. Cost-effectiveness analysis of uni-versal influenza vaccination with quadrivalent inactivated vaccine in the United States. Hum Vaccin Immunother. 2014. 10(5): 1171–80. doi:10.4161/hv.28221PMID:24609063
16. Van Bellinghen LA, Meier G, Van Vlaenderen I. The potential cost-effectiveness of quadrivalent versus trivalent influenza vaccine in elderly people and clinical risk groups in the UK: a lifetime multi- cohort model. PLoS One. 2014. 9(6): e98437. doi:10.1371/journal.pone.0098437PMID:24905235
17. You JH, Ming WK, Chan PK. Cost-effectiveness analysis of quadrivalent influenza vaccine versus triva-lent influenza vaccine for elderly in Hong Kong. BMC Infect Dis. 2014. 14(1): 618.
18. Beyer WE, McElhaney J, Smith DJ, Monto AS, Nguyen-Van-Tam JS, Osterhaus AD. Cochrane re-arranged: Support for policies to vaccinate elderly people against influenza. Vaccine 2013 Dec 5; 31 (50):6030–3. doi:10.1016/j.vaccine.2013.09.063PMID:24095882
19. Greenberg DP, Robertson CA, Noss MJ, Blatter MM, Biedenbender R, Decker MD. Safety and immu-nogenicity of a quadrivalent inactivated influenza vaccine compared to licensed trivalent inactivated influenza vaccines in adults. Vaccine. 2013 Jan 21; 31(5):770–6. doi:10.1016/j.vaccine.2012.11.074
PMID:23228813
20. Kwong JC, Stukel TA, Lim J, McGeer AJ, Upshur RE, Johansen H, et al. The effect of universal influ-enza immunization on mortality and health care use. PLoS Med. 2008 Oct 28; 5(10):e211. doi:10. 1371/journal.pmed.0050211PMID:18959473
21. Sander B, Kwong JC, Bauch CT, Maetzel A, McGeer A, Raboud JM, et al. Economic appraisal of Ontar-io's Universal Influenza Immunization Program: a cost-utility analysis. PLoS Med. 2010 Apr; 7(4): e1000256. doi:10.1371/journal.pmed.1000256PMID:20386727
22. Canadian consumer price index. Statistics Canada 2015:http://www.statcan.gc.ca/tables-tableaux/ sum-som/l01/cst01/econ161a-eng.htm
23. Centers for Disease Control and Prevention. Estimates of deaths associated with seasonal influenza— United States, 1976–2007. MMWR Morb Mortal Wkly Rep. 2010 Aug 27; 59(33):1057–62. PMID:
20798667
24. Zhou H, Thompson WW, Viboud CG, Ringholz CM, Cheng PY, Steiner C, et al. Hospitalizations associ-ated with influenza and respiratory syncytial virus in the United States, 1993–2008. Clin Infect Dis. 2012 May; 54(10):1427–36. doi:10.1093/cid/cis211PMID:22495079
26. Canadian Hourly Labor Costs. Statistics Canada 2015. Available: http://www.statcan.gc.ca/tables-tableaux/sum-som/l01/cst01/labr69a-eng.htm
27. Organisation for Economic Co-operation and Development. StatExtracts. Unit Labour Costs—Annual Indicators: Labour Compensation per Employee/Hour ($US PPP adjusted) 2013. Available:http://stats. oecd.org/Index.aspx?queryname=430&querytype = view
28. Pitman R, Fisman D, Zaric GS, Postma M, Kretzschmar M, Edmunds J, et al. Dynamic transmission modeling: a report of the ISPOR-SMDM Modeling Good Research Practices Task Force Working Group-5. Med Decis Making. 2012 Sep-Oct; 32(5):712–21. PMID:22990086
29. Loeb M, Russell ML, Moss L, Fonseca K, Fox J, Earn DJ, et al. Effect of influenza vaccination of chil-dren on infection rates in Hutterite communities: a randomized trial. JAMA. 2010 March 10; 303 (10):943–950. doi:10.1001/jama.2010.250PMID:20215608
30. Langley JM, Krahn M, Husereau D, Spika J, Fisman DN, Chit A, Van Exan R. Incorporating economic evaluation into immunization decision making in Canada: a workshop. Expert Rev Vaccines. 2014 Nov; 13(11):1291–6 doi:10.1586/14760584.2014.939637PMID:25052459
31. pan Canadian Oncology Drug Review. Canadian Agency for Drugs and Technologies in Health 2015.
https://www.cadth.ca/pcodr/find-a-review
32. Udell JA, Zawi R, Bhatt DL, Keshtkar-Jahromi M, Gaughran F, Phrommintikul A, et al. Association between influenza vaccination and cardiovascular outcomes in high-risk patients: a meta-analysis. JAMA. 2013; 310(16):1711–1720. doi:10.1001/jama.2013.279206PMID:24150467
33. Kostova D, Reed C, Finelli L, Cheng PY, Gargiullo PM, Shay DK, et al. Influenza illness and hospitaliza-tions averted by influenza vaccination in the united states, 2005–2011. PLoS One. 2013. 8(6): e66312. PMID:23840439
34. Statistics Canada. Population and life expectancy estimates. 2013. Available:http://www.statcan.gc. ca/start-debut-eng.html.
35. Pogany L, Barr RD, Shaw A, Speechley KN, Barrera M, Maunsell E. Health status in survivors of cancer in childhood and adolescence. Qual Life Res. 2006 Feb; 15(1):143–57. PMID:16411038
36. Joint Canada/USA Survey of Health 2002/3 (JCUSH 2002/3). 2003.
37. Schanzer DL, Zheng H, Gilmore J. Statistical estimates of absenteeism attributable to seasonal and pandemic influenza from the Canadian Labour Force Survey. BMC Infect Dis. 2011; 11:90. doi:10. 1186/1471-2334-11-90PMID:21486453
38. Turner D, Wailoo A, Nicholson K, Cooper N, Sutton A, Abrams K. Systematic review and economic decision modelling for the prevention and treatment of influenza A and B. Health Technol Assess. 2003; 7(35):iii–xiii, 1–170. PMID:14609480