Benefits of Turbid River Plume Habitat for
Lake Erie Yellow Perch (Perca flavescens)
Recruitment Determined by Juvenile to Larval
Genotype Assignment
Lucia B. Carreon-Martinez1, Ryan P. Walter1,2, Timothy B. Johnson3, Stuart A. Ludsin4, Daniel D. Heath1*
1Great Lakes Institute for Environmental Research, University of Windsor, Windsor, ON, N9B 3P4, Canada,
2Department of Biological Science, California State University, Fullerton, CA, 92831, United States of America,3Ontario Ministry of Natural Resources, Glenora Fisheries Station, Picton, ON, K0K 2T0, Canada,
4Aquatic Ecology Laboratory, Department of Evolution, Ecology, and Organismal Biology, The Ohio State University, Columbus, Ohio, 43212, United States of America
*dheath@uwindsor.ca
Abstract
Nutrient-rich, turbid river plumes that are common to large lakes and coastal marine ecosys-tems have been hypothesized to benefit survival of fish during early life stages by increasing food availability and (or) reducing vulnerability to visual predators. However, evidence that river plumes truly benefit the recruitment process remains meager for both freshwater and marine fishes. Here, we use genotype assignment between juvenile and larval yellow perch (Perca flavescens) from western Lake Erie to estimate and compare recruitment to the age-0 juvenile stage for larvae residing inside the highly turbid, south-shore Maumee River plume versus those occupying the less turbid, more northerly Detroit River plume. Bayesian genotype assignment of a mixed assemblage of juvenile (age-0) yellow perch to putative larval source populations established that recruitment of larvae was higher from the turbid Maumee River plume than for the less turbid Detroit River plume during 2006 and 2007, but not in 2008. Our findings add to the growing evidence that turbid river plumes can indeed enhance survival of fish larvae to recruited life stages, and also demonstrate how novel pop-ulation genetic analyses of early life stages can contribute to determining critical early life stage processes in the fish recruitment process.
Introduction
The recruitment process in fishes is complex and influenced by a large number of factors, both biotic and abiotic [1,2]. For many freshwater and marine populations, processes operating dur-ing early life stages have been shown to be important determinants of survival to older (and fishable) life stages, with factors that influence food availability and predation risk to larvae being seen as especially important (see reviews by [1,2]). Because nutrient-rich, turbid river a11111
OPEN ACCESS
Citation:Carreon-Martinez LB, Walter RP, Johnson TB, Ludsin SA, Heath DD (2015) Benefits of Turbid River Plume Habitat for Lake Erie Yellow Perch (Perca flavescens) Recruitment Determined by Juvenile to Larval Genotype Assignment. PLoS ONE 10(5): e0125234. doi:10.1371/journal.pone.0125234
Academic Editor:Tim A. Mousseau, University of South Carolina, UNITED STATES
Received:November 28, 2014
Accepted:March 22, 2015
Published:May 8, 2015
Copyright:© 2015 Carreon-Martinez et al. This is an open access article distributed under the terms of the Creative Commons Attribution License, which permits unrestricted use, distribution, and reproduction in any medium, provided the original author and source are credited.
Data Availability Statement:All relevant data are available via Dryad (http://datadryad.org/resource/ doi:10.5061/dryad.vf0t2).
plumes that are common to both large lake and coastal marine ecosystems hold great potential to benefit larval fish by enhancing zooplankton availability (via nutrient effects; [3–5]) and re-ducing risk from visual predators (via turbidity effects; [6–8]), much research has centered on quantifying the role that river plumes play in the fish recruitment process (e.g., [4,9–12]). In-deed, river inflows and their associated plume fronts have been shown to promote primary and secondary production, as well as foraging during early life stages [13–16]. Despite these gener-ally positive effects of river plumes on fish early life stages, river plumes also can at times inhibit foraging (e.g., [10]D), and evidence that any benefits provided by plumes actually carryover to affect survival at later life stages remains limited (but see [12]).
Documenting whether river plumes provide a survival advantage (or disadvantage) to larvae residing inside the plume versus outside of it requires a means to track relative survival rates be-tween areas. Doing so is difficult, however, in the absence of markers that can identify differen-tial use of the plume during the larval stage. Fortunately, the advent of natural tagging
approaches such as otolith microchemistry and molecular genetics has opened the door for ad-dressing this information gap [17]. For example, Reichert et al. [12] used differences in stron-tium concentrations (Sr) in the otoliths of larval yellow perch (Perca flavescens) captured in plume (high Sr) versus non-plume (low Sr) areas to demonstrate better recruitment to the age-0 juvenile stage of larvae residing inside a turbid (Maumee River) plume versus larvae residing outside of this plume in western Lake Erie. While we are unaware of any studies that have used molecular genetics as a natural tag to quantify relative recruitment between individuals residing inside versus outside river plumes during early life stages, its potential use as a tool to track rela-tive recruitment rates would be expected to be high, if genetic divergence could be used to identi-fy river plume habitat use. The genetic divergence could then be used with genotype assignment to determine the relative survival of juvenile fish, similar to approaches used in marine systems to document whether marine protected areas have been affecting the recruitment of both local and geographically distant coral reef fish populations (e.g., [18,19]). The application of molecu-lar genetic tags for quantifying the subtle mechanisms affecting biological processes in aquatic environments (e.g., habitat use impacts on recruitment; [20,21]) is based on the underlying ef-fects of dispersal and gene flow on population divergence [22,23]. Both dispersal and gene flow can be constrained or enhanced by environmental discontinuities such river-plumes [23,24].
We use microsatellite markers and genotype assignment between life stages (juvenile to lar-val) to test the hypothesis that survival of larval yellow perch (Perca flavescens; YP, hereafter) to the age-0 juvenile stage in western Lake Erie is higher for individuals residing inside a nutri-ent-rich, turbid river plume than those residing outside of it. Western Lake Erie is a perfect sys-tem to test this hypothesis for a number of reasons. First, it is heavily influenced by two rivers that create distinct plumes (water masses) that differ in their chemicophysical characteristics [25,26] during the spring, a period when the larvae of many economically and ecologically im-portant fishes such as yellow perch are abundant in the ecosystem [2,27]. Those two plumes constitute the majority of the water mass of the western basin of Lake Erie as the Detroit and Maumee Rivers are by far the dominant tributary rivers. The Maumee River, which discharges into the southern part of the western basin of Lake Erie, has been shown to form a plume that is more turbid, warmer and slightly more biologically productive than the plume formed by the Detroit River, which discharges into the northern portion of the basin [12,28]. Second, previ-ous research has demonstrated a strong positive correlative relationship between Maumee River plume size and recruitment of western basin YP to the age-0 juvenile stage, a life stage that is very strong predictor of future recruitment to western Lake Erie’s fishery at age-2 [29]. While the mechanisms are not yet known, turbidity’s ability to reduce predation risk (i.e., miti-gation of top-down effects) appears to be more important than zooplankton prey supplementa-tion (bottom-up effects) via nutrients [8,12,28]. Third, although no previous studies have
Grant #814014 (http://www.nserc-crsng.gc.ca/index_ eng.asp): no individuals employed or contracted by the NSERC played any role in study design, data collection and analysis, decision to publish, or preparation of the manuscript; and 3) Ontario Ministry of Natural Resources (OMNR) base funds (https:// www.ontario.ca/environment-and-energy/aquatic-research): no individuals employed or contracted by the OMNR (other than co-author T.B. Johnson) played any role in study design, data collection and analysis, decision to publish, or preparation of the manuscript.
examined genetic structure in YP larvae in their rearing environment, low levels of genetic structure have been documented in adult YP within the western basin of Lake Erie [30,31] in-dicating a high likelihood for larval genetic structure. Given that fish populations can evolve life histories that center on predictable physical phenomena such as river flows and water cir-culation patterns, and strong selection (predation) gradients appear to exist in Lake Erie that are driven by Maumee River plume formation [8,12,28], the possibility that larval YP exhibit genetic structure at the scale of the Detroit and Maumee River plumes exists. Finally, because YP is an ecologically and economically important species in all of the Laurentian Great Lakes that also has a similar life history and level of recruitment variability as many other exploited freshwater and marine fishes [2], we expect our findings and approach to have application to a wide array of ecosystems.
Here we use polymorphic microsatellite markers, population genetic analyses, and genotype assignment to explore the role of river plume-associated turbidity on YP recruitment to the age-0 juvenile stage in the western basin of Lake Erie. We postulate that larval YP will exhibit genet-ic structure at the scale of the Detroit and Maumee River plumes, and that the genetgenet-ic structure can be used in conjunction with genotype assignment of juvenile YP to their respective larval cohorts to indirectly estimate first summer relative survival in the two rearing habitats. Towards this end, we 1) tested for spatial genetic structure in larval YP in the western basin of Lake Erie, 2) quantified relative survival to the age-0 juvenile stage (age-0) of larvae residing inside versus outside of the turbid Maumee River plume, and 3) tested for temporal variation in recruitment and population genetic structure. Our analyses identifies survival differences among larval fish-es from Wfish-estern Lake Erie and suggfish-ests that river plumfish-es may confer benefits for larval YP sur-vival, adding to a growing understanding of the complex ecology of Lake Erie.
Materials and Methods
Fish collections
Larval YP were collected weekly at 8 to 12 sites within both northern (Detroit River plume) and southern (Maumee River plume) areas of the western basin of Lake Erie (Fig 1). Moderate-Resolution Imaging Spectoradiometer (MODIS) 250 m resolution, true colour, near real-time imagery from the Terra and Aqua satellites (http://coastwatch.glerl.noaa.gov/) was used to de-termine the rough boundaries of the Maumee and Detroit River plumes as the turbid waters from the Maumee River are evident in the images (see details in [12]). YP larvae were captured during close to identical periods in the two plumes, with the exception of 2007 when the date of first capture was a week earlier in the Maumee (day 122 versus day 128) and in 2008 when the date of last capture was a month later in the Maumee (day 175 versus day 144).
Fig 1. Maps of western Lake Erie with larval (large circles) and juvenile (small black squares) yellow perch sampling sites during spring 2006 (Panel a), 2007 (Panel b) and 2008 (Panel c).Transmissometry values greater than six indicate high turbidity and differentiate the Maumee River plume (dark circles) from Detroit River plume waters (white circles). In 2006, two sites were not used in the analysis due to anomalous turbidity values (eliminated sites are shown as white circles in the Maumee plume; no sample sites were eliminated in 2007 or 2008).
Committee (ACC) and the Fisheries Management Unit of the State of Michigan Department of Natural Resources prior to collections. Sampling procedures were specifically approved as part of obtaining field permits for all locations.
At each collection site, turbidity was indirectly estimated using a 5 cm path transmissometer (SeaBird SBE19): transmissometry values reflect loss of light transmission with increased water turbidity [12]. Although our sampling site positions were based on satellite images, the real time spatial location of the Maumee River plume was highly dynamic. We thus used weekly transmissometry measurements (as a proxy for turbidity) to corroborate sampling sites assign-ment to one of the two larval rearing (plume) habitats, hence providing objective criteria for delineating two distinct larval habitats for the genetic analyses.
Age-0 juveniles (i.e., surviving larval YP from the spring of the same year) were collected throughout western Lake Erie in late August of each year via bottom trawl (10.7-m headrope; 13-mm cod-end liner; 3 km/hr tow-speed). These juveniles were collected from 36, 50, and 48 sites within the western basin during 2006, 2007, and 2008, respectively (Fig 1), as part of the annual fisheries-independent assessment surveys conducted by the Ontario Ministry of Natu-ral Resources and the Ohio Department of NatuNatu-ral Resources-Division of Wildlife [29]. All in-dividuals were humanely euthanized and kept frozen until further laboratory analysis. Because juvenile abundance is a strong predictor of future recruitment to the fishery in western Lake Erie [29], juveniles used for this study in each year were subsampled from the catch at each site in proportion to the total catch per unit effort at that site.
DNA extraction and genotyping
DNA was recovered from fin tissue samples following the plate-based extraction method of [33]. Extracted DNA samples were eluted in 50–100μL of Tris—EDTA buffer (10 mM Tris, 1.0 mM EDTA, pH 8.0).
Each fish was genotyped at a total of 12 microsatellite loci ([34];Table 1). PCR amplification was performed in 25μL reactions with the following components: 1.5μL of template DNA, 2.5μL 10x PCR buffer, 2.5μL of MgCl2(25 mM), 0.3μL of dNTPs (50μM of each), 0.2μL
(0.5μM) of dye labeled primer, 0.2μL (0.5μM) of the reverse primer, and 0.10 U Taq polymer-ase (Applied Biosystems, Foster City, CA). PCR conditions were: initial denaturation at 94°C for 2 min, followed by 35 to 40 cycles of denaturing at 94°C for 15 s, annealing at various tem-peratures (according to Liet al. [34]) for 30 s, extension at 72°C for 30 s, and a final extension of 72°C for 10 min. Microsatellite allele sizes were determined using a LI-COR 4300 DNA ana-lyzer (Lincoln, NE) and scored using GeneImage IR 4.05 (Scanalytics, Inc., Rockville, MD). Mi-crosatellite data are freely available at:http://dx.doi.org/10.5061/dryad.vf0t2
Categorizing larval fish groups
Collected larvae were divided into two habitat groups based on two criteria. First, we initially divided larvae based on their geographic (sampling) location (i.e. northern vs. southern part of the western basin;Fig 1). Second, we used transmissometery (as a proxy for turbidity) estimates to select sites belonging to high and low turbidity areas (Fig 1). The larvae associated with high-ly turbid southern area will be referred to as the Maumee River plume larval group, whereas the larvae associated with low-turbidity northern area of the basin will be referred to as the De-troit River plume larval group.
Population genetic analysis
simultaneous comparisons. In addition, linkage disequilibrium was determined for all pairs of loci in all larval and age-0 juvenile groups using GENEPOP 4.0.7 [36]. Genetic differentiation was quantified by calculating FST[37] between larval groups (Detroit vs. Maumee River
plumes) within a given year (2006, 2007, or 2008) in ARLEQUIN 3.0 [38]. Pairwise Fisher’s exact tests (10,000 dememorizations and 20,000 permutations; [39]) were performed between larval groups in each year, as well as for temporal variation among sample years for the two val groups using TFPGA. Analysis of Molecular Variance (AMOVA) was used to partition lar-val YP genetic variance among years (temporal), between plumes nested within years (spatial), and within plumes, using ARLEQUIN. GENELAND 3.2.4 [40] was used to characterize and vi-sualize spatial genetic relationships among larvae for each sampling year. Ten independent Markov Chain Monte Carlo (MCMC) runs at K = 2 (based on two plumes) were performed using the correlated frequencies model, 106iterations, and a 2 × 10⁵iteration burn-in.
Genetic assignment of juveniles. Relative contributions of larvae from the two plumes to the mixed population of unknown-origin juveniles was estimated by genetic assignment of the juveniles to their putative larval group (i.e., Maumee or Detroit River plume larval groups), followed by a comparative analysis of relative proportions. For genetic assignment
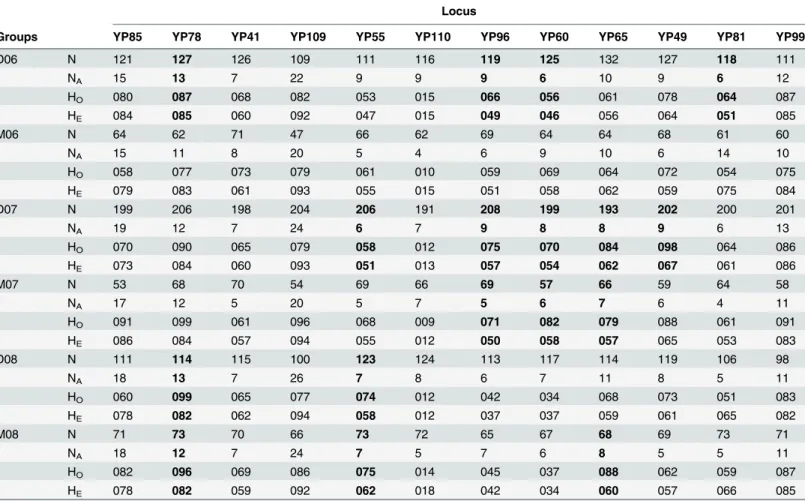
Table 1. Number of alleles (NA), and observed (HO) and expected (HE) heterozygosity for the 12 microsatellite loci (Li et al. 2007) used to genotype
larval yellow perch (YP) collected in the western basin of Lake Erie during 2006 (06), 2007 (07), and 2008 (08).
Locus
Groups YP85 YP78 YP41 YP109 YP55 YP110 YP96 YP60 YP65 YP49 YP81 YP99
D06 N 121 127 126 109 111 116 119 125 132 127 118 111
NA 15 13 7 22 9 9 9 6 10 9 6 12
HO 080 087 068 082 053 015 066 056 061 078 064 087
HE 084 085 060 092 047 015 049 046 056 064 051 085
M06 N 64 62 71 47 66 62 69 64 64 68 61 60
NA 15 11 8 20 5 4 6 9 10 6 14 10
HO 058 077 073 079 061 010 059 069 064 072 054 075
HE 079 083 061 093 055 015 051 058 062 059 075 084
D07 N 199 206 198 204 206 191 208 199 193 202 200 201
NA 19 12 7 24 6 7 9 8 8 9 6 13
HO 070 090 065 079 058 012 075 070 084 098 064 086
HE 073 084 060 093 051 013 057 054 062 067 061 086
M07 N 53 68 70 54 69 66 69 57 66 59 64 58
NA 17 12 5 20 5 7 5 6 7 6 4 11
HO 091 099 061 096 068 009 071 082 079 088 061 091
HE 086 084 057 094 055 012 050 058 057 065 053 083
D08 N 111 114 115 100 123 124 113 117 114 119 106 98
NA 18 13 7 26 7 8 6 7 11 8 5 11
HO 060 099 065 077 074 012 042 034 068 073 051 083
HE 078 082 062 094 058 012 037 037 059 061 065 082
M08 N 71 73 70 66 73 72 65 67 68 69 73 71
NA 18 12 7 24 7 5 7 6 8 5 5 11
HO 082 096 069 086 075 014 045 037 088 062 059 087
HE 078 082 059 092 062 018 042 034 060 057 066 085
Groups are denoted by river plume (Detroit or Maumee) followed by the collection year. Note: Data in bold denotes deviations from HWE (following Bonferroni correction).
purposes only, both groups of larval fish were genetically screened for first-generation mi-grants using rank-based self-assignment genotype analysis [41] in GENECLASS 2.0 [42]. The purpose of this analysis was to identify larvae that may have moved between sampling areas, likely due to passive dispersal via water movement, as larval YP are weak swimmers [43]. The probability of genotype assignment to either group (high-turbidity, south-shore Maumee River plume vs. low-turbidity, north-shore Detroit River plume) was estimated for each larva. An individual that showed a<60% likelihood of self-assignment to its collection group was deemed a migrant and eliminated from subsequent analyses to maximize the probability of successful juvenile assignment to the larval groups. Because our choice of a 60% likelihood threshold was arbitrary, we performed a sensitivity analysis to explore the effect of changing this threshold value on the analysis outcomes. It is important to note that the migrant exclu-sion was not performed for the population genetic characterization of the two plumes de-scribed above, only for the genotype assignment.
Genetic assignment of juveniles to the two river plume groups was independently performed for the three collection years using GENECLASS. Our analyses consisted of a two-step proce-dure (see Beneteauet al. [44]). First, to identify (and eliminate) those individuals that may have come from other (not sampled) larval sources, we performed a Bayesian exclusion assignment [45] with Monte Carlo re-sampling using Paetkauet al.’s [46] simulation algorithm (10,000 simulated individuals at an assignment threshold p = 0.05). Based on that Bayesian analysis, we excluded individual juveniles with assignment probabilities<10% of belonging to either of the two larval source populations (i.e., Detroit or Maumee River larval groups). Second, to assign the remaining individuals to one larval group, we used a rank-based genotype assignment (fre-quency method; [41]). Successful ranked-based assignments were those with probability70% of belonging to one group (hence, the second group assignment probability would be<30%). Failed assignments (i.e. unknown origin) were those with likelihoods between 30% and 70%. Since the 70% likelihood threshold value was arbitrary, we performed a sensitivity analysis to assess the effect of our choice of threshold value on the outcome of our analysis. Specifically, we varied the threshold from 60 to 90% and estimated the relative number of juveniles assigned to the Detroit versus Maumee plume larval groups.
For juvenile YP successfully assigned to Maumee and Detroit River plume larval groups, ge-netic differentiation (FST) and pairwise Fisher’s exact tests for population differentiation were
conducted in ARLEQUIN and TFPGA, respectively, for 2006, 2007 and 2008 independently. Hierarchical AMOVA was used to partition genetic variance in successfully assigned juveniles among years (temporal), between plumes nested within years (spatial), and within plumes, using ARLEQUIN.
Finally, we investigated whether juveniles that successfully assigned to the Detroit or Mau-mee River plume larval groups were spatially separated in the western basin of Lake Erie. To do so, we calculated the location of capture (latitude and longitude) for all juveniles and used Stu-dents’t-tests to see if the mean latitude and longitude differed between the Maumee and De-troit River groups.
Comparison of plume recruitment. We used information on weekly larval YP abun-dance differences between the Maumee and Detroit River plumes, as well as results from our successful genotype assignments of juveniles, to quantify differences in recruitment of larvae to the age-0 juvenile stage between the two larval rearing areas. Weekly average abundance of larvae was calculated for each river plume group (total number of larvae / m3averaged over all sites sampled in that week) with analysis of variance (ANOVA) used to quantify temporal stability of weekly larval abundance within each river plume. The highest weekly larval abun-dance estimate has been shown to provide a good estimate of larval production (Reichert
estimate the YP larval abundance ratio between Detroit and Maumee River plumes. In this study the peak larval YP abundance varied from 40–198 larvae/m3.
If recruitment of larvae (survival of larvae to August, when juveniles were sampled) was equal for the Detroit and Maumee River plume habitats, we would expect the Maumee: Detroit ratio of larval abundance to remain constant over time. In turn, we would expect the ratio of as-signed juveniles from Maumee versus the Detroit plume areas to be the same as the ratio of lar-val abundance. We used the larlar-val YP abundance ratio (estimated based on metered bongo net tows; see above) to assess differences in relative recruitment between Detroit and Maumee lar-vae from the larval to the juvenile stage for each year separately. Expected values for the num-ber of juveniles from each plume in each year were calculated by multiplying the Detroit: Maumee larval abundance ratio by the total number of juveniles successfully assigned for that year. Observed values came from the juvenile genetic assignment results (see above). We com-pared expected versus observed estimates using Chi-square (χ2) tests for each year. If the
ob-served number of juveniles was significantly higher than the expected value for a plume (and would thus be lower than expected for the other plume), then relative recruitment would be higher for that river plume.
Results
The collection sites for larval fish corresponded well with the water turbidity data in discriminat-ing high transmissometry (>6.0 m-1) Maumee River plume sites from the low transmissometry (<6.0 m-1) Detroit River plume sites. Using a 6.0 m-1transmissometry threshold criterion, only two of 12 sampling sites from the Maumee River plume were removed from our initial spatial classification in 2006, and none were removed from either plume in 2007 or 2008 (Fig 1).
A total of 853 larvae and 403 juveniles were genotyped at 12 microsatellite loci across sam-pling years (2006–2008), with 5 to 23 alleles per locus. Observed (HO) and expected
heterozy-gosities (HE) ranged from 0.091 to 0.991 across loci (Table 1). Seventeen of 72 tests revealed
significant departures from HWE following Bonferroni correction; however, none was consis-tent across larval groups or loci (Table 1). In addition, no evidence for linkage disequilibrium was found between any pair of loci after Bonferroni correction.
Population genetic structure
Genetic differentiation (FSTvalues) between larvae collected in the Detroit versus Maumee
River plumes were 0.0086 (P<0.001), 0.0054 (P<0.01) and 0.0082 (P<0.001) in 2006, 2007 and 2008, respectively (Table 2). Fisher exact tests revealed significant (P<0.001) differences in allele frequency distributions for all comparisons, both with years (i.e., between Maumee and Detroit larval groups) and among years (i.e., among 2006, 2007 and 2008). AMOVA parti-tioning showed no significant variance component among years (variance explained = 0.43%, P = 0.22), whereas the between-plume variance component (nested within years) was signifi-cant (variance explained = 0.31%, P<0.001). Within-river plume group variation explained the majority of the variance (variance explained = 99.26%, P<0.001).
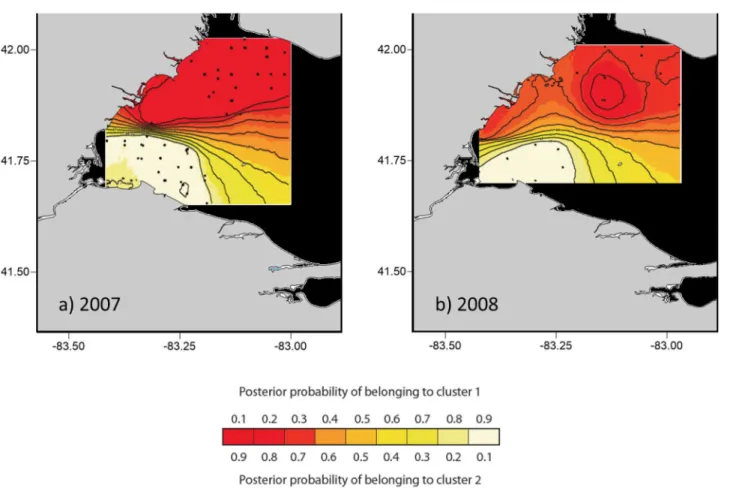
consistent with the river plumes (Fig 2). For 2006, all 10 runs produced assignments indicative of population admixture among the plumes (results not shown).
Genetic assignment of YOY. The microsatellite genotype assignment analysis for plume membership identified a relatively small number of larvae as likely first-generation migrants: 15% (25 of 160) and 17% (15 of 90) from Detroit and Maumee River plume, respectively, in 2006; 26% (74 of 283) and 13% (11 of 81), respectively, in 2007; and 18% (29 of 153) and 15% (13 of 86), respectively, in 2008. While all larvae were used for the population genetic analyses (above), the putative first-generation migrants were not used in the juvenile
assignment analyses.
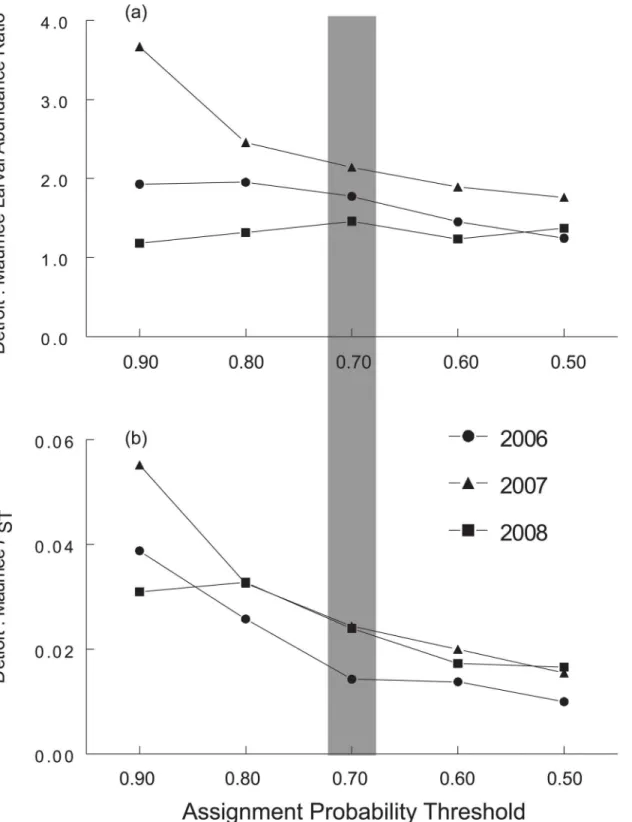
The percentage of juveniles that were excluded from both possible source populations based on the Bayesian analysis was 0% (0 out of 119), 8% (13 out of 167), and 25% (30 out of 117) in 2006, 2007, and 2008 respectively (Table 3). Although some juveniles were not successfully as-signed to either larval rearing area in our rank-based assignment analysis (see“failed assign-ments”inTable 3), those that did were assigned as Detroit River plume individuals at almost twice the frequency of those assigned to the Maumee River plume in 2006, 2007, and 2008. Fur-ther, our sensitivity analysis showed that, although the proportion of juveniles assigned to the Detroit River plume varied with the assignment threshold used, the number of juveniles as-signed to the Detroit River plume was always higher than the number asas-signed to the Maumee River plume (i.e., ratio>1.0;Fig 3a).
Genetic differentiation (FST) between juveniles successfully assigned to Detroit and Maumee
River plumes was 0.011 in 2006, 0.021 in 2007 and 0.029 in 2008, with significant differences in allele frequency distributions in all years (Fisher’s exact test, P<0.001). To explore the role of our assignment threshold choice on genetic divergence in successfully assigned juveniles, we performed a sensitivity analysis to quantify changes in FSTestimates with varying assignment
thresholds. Although lower thresholds did reduce FSTvalues, the juvenile FSTestimates (Fig
3b) were substantially higher than larval FSTestimates in 2007 and 2008 across all assignment
probability thresholds.
Table 2. Microsatellite FSTvalues (Detroit versus Maumee River plume groups) for both yellow perch larvae and age-0 juveniles collected in
west-ern Lake Erie during 2006, 2007, and 2008.
Locus Larval FST Juvenile FST
2006 2007 2008 2006 2007 2008
YP85 -0.0057 0.0298 0.0323 0.0015 0.0721 0.0403
YP78 -0.0060 -0.0036 0.0043 0.0049 0.0054 0.0020
YP41 -0.0048 -0.0025 0.0076 0.0050 -0.0084 0.0380
YP109 0.0006 -0.0034 -0.0034 0.0298 0.0176 0.0432
YP55 0.0437 -0.0007 0.0162 0.0072 0.0646 0.0259
YP110 -0.0005 -0.0035 0.0016 0.0736 0.0010 0.0331
YP96 -0.0030 -0.0042 0.0007 0.0033 -0.0029 0.0165
YP60 0.0349 -0.0047 0.0058 -0.0041 -0.0042 0.0012
YP65 0.0264 -0.0042 0.0016 0.0058 -0.0035 0.0175
YP49 -0.0016 0.0050 -0.0045 -0.0076 -0.0030 0.0057
YP81 0.0914 0.0010 0.0034 0.0790 0.0894 0.0468
YP99 -0.0014 -0.0008 0.0018 -0.0052 0.0120 0.0018
All loci 0.0086 0.0054 0.0082 0.0143 0.0244 0.0240
Values are given for all 12 loci individually, as well as across all loci. The larval FSTestimates are based on all sampled larvae; the juvenile FSTestimates
are based onfish assigned to Maumee or Detroit River plumes at a 70% probability threshold.
All temporal comparisons for juvenile YP allele frequency distribution differences were sig-nificant (Fisher’s exact tests, P<0.001). AMOVA results for juveniles that were successfully assigned to either the Detroit or Maumee River plume showed no variation among years (df = 2, variation = -0.35%, P = 0.68). However, significant variation existed between assigned groups nested within years (df = 3, variation = 1.98%, P<0.001), with the majority of the vari-ation being explained by within-group effects (df = 458, varivari-ation = 98.37%, P<0.001).
Fig 2. Spatial patterning of western Lake Erie larval yellow perch genetic structure for 2007 and 2008 using GENELAND genetic analysis software.
Runs were fixed for two groups (K = 2) for each year. Panels show consensus results of 10 runs for each of two sample years (2007: 10/10; 2008: 6/10). GENELAND failed to converge and no consensus outcome was identified for 2006. Points on the contour maps indicate collection locations of larvae.
doi:10.1371/journal.pone.0125234.g002
Table 3. Genotype assignment of age-0 juvenile yellow perch collected in the western basin of Lake Erie to Detroit versus Maumee River plume lar-val groups during 2006–2008.
Age-0 Juvenile assignment
Detroit Maumee Failed Excluded Total
2006 55 32 32 0 119
2007 69 33 52 13 167
2008 27 16 44 30 117
Failed assignment indicates that the juvenile genotypes provided an ambiguous likelihood ratio making assignment to either plume uncertain.“Excluded”
genotypes are those that had a<10% probability of belonging to either larval group, likely indicative of an un-sampled source group.
Fig 3. Sensitivity of western Lake Erie yellow perch genotype assignment analyses to changes in assignment likelihood ratio threshold.Panel a) portrays the effect of threshold variation on ratio of age-0 juveniles successfully assigned to the Detroit River versus Maumee River for 2006–2008. Panel b) shows the effect of threshold probability variation on FSTestimates of age-0 juveniles assigned to Maumee River versus Detroit River plume nursery areas for
2006–2008. The shading indicates the threshold used for the analyses.
Based on Student’s t- tests, no differences existed between mean latitude and mean longi-tude of collection sites coordinates for juveniles assigned to the Detroit versus Maumee River plumes in any year (P>0.05) suggesting that no spatial bias existed in either group (i.e., juve-niles from both rearing habitat areas were well-mixed).
Recruitment differences between plumes
The ratios of peak larval abundance for the Detroit:Maumee River plumes were 73:27 in 2006; 89:11 in 2007, and 70:30 in 2008. No difference in larval YP abundance was found among sam-ple weeks in the Detroit or Maumee River plumes (ANOVA, df = 2, both P>0.28). Larval YP abundance ratios were used to calculate theexpectedratio of juveniles from the Detroit River and Maumee River plumes (accounting for the total number of juveniles that were assigned), whereasobservedvalues were those obtained using genotype assignment (Table 3). Chi-square analysis revealed significant differences between observed and expected values for 2006 and 2007, but not for 2008 (Fig 4). Specifically, recruitment of larvae to the age-0 juvenile stage was higher than expected in the Maumee River plume and correspondingly lower than expected in the Detroit River plume in 2006 and 2007, whereas we could detect no difference in 2008 (Fig 4).
Finally, we conducted a sensitivity analysis to explore the effect of our choice of a 70% likeli-hood ratio threshold for juvenile genotype assignment. While we found that the choice of threshold ratio does affect the Detroit:Maumee ratio of juveniles, its effect is minor except at extreme values of the threshold (seeFig 3a). This finding indicates that the estimate of the juve-nile abundance ratio by genotype assignment is robust to the choice of the threshold value.
Discussion
Our genotype assignment analyses showed that larval YP from the Maumee River plume expe-rienced significantly higher recruitment though their first summer than the Detroit River plume larvae in 2006 and 2007, but not in 2008. The recruitment advantage for the Maumee River plume larvae may be explained by at least two different processes: 1) nutrient-rich water from the Maumee River provides a food-rich (and/or high quality food) environment causing a“bottom-up”growth effect on larval fish indirectly favouring survival [6,47]; or 2) high tur-bidity (i.e., low water clarity) due to suspended sediments and phytoplankton blooms in the Maumee River plume provide protection against visual predators during early life stages [48,
49]. A combination of both is also possible.
River discharge into bays, estuaries, and other coastal areas of both marine and freshwater ecosystems typically creates nutrient-rich areas that hold the potential to enhance larval growth and positively influence fish survival and recruitment [4,14,50]. For example, Rosemanet al. [51], working in the southern part of western Lake Erie, showed that walleye(Sander vitreus)
larvae were found in higher densities in waters with higher zooplankton availability, higher temperatures, and lower water clarity. Similarly, the south-shore Maumee River plume was found to have higher total phosphorous levels, chlorophyllalevels, and temperatures relative to other areas within the western basin of Lake Erie, including the Detroit River plume, during our study years [12,28]. Despite these differences, zooplankton density, biomass, and produc-tion, as well as larval YP feeding, diet selecproduc-tion, and growth rates have been shown to be strik-ingly similar between the Maumee and Detroit River plumes during our study years [12,28]. Hence, food availability that enhances larval growth does not appear to be the dominant factor driving higher recruitment of larvae to the age-0 juvenile stage in the Maumee River plume rel-ative to the Detroit River plume.
Fig 4. Number of western Lake Erie juvenile yellow perch (YP) assigned to the Detroit (“D”) and Maumee (“M”) River plumes during 2006–2008.Observed (black) and expected (shaded) values in panel a) were calculated based on the larval abundance ratio between Detroit and Maumee River plume groups and genetic assignment results. Residual numbers (observed minus expected) are reported in panel b). Significant differences (P<0.05) between observed and expected values based on Chi-square good of fitness analysis are denoted by asterisks. NS = not significant.
on larvae [8,28]. The low turbidity associated with the Detroit River plume in combination with higher larval YP abundance makes opportunistic predation by piscivorous fish more likely in the Detroit versus Maumee River plume [48]. Further, lower water clarity and larval YP abundance in the Maumee River plume could translate into higher energetic costs for predators in searching for larval fish prey which also would be expected to reduce opportu-nistic predation [47,52,53]. For example, Swenson [54] reported that high turbidity associat-ed with river discharge in the western arm of Lake Superior favourassociat-ed lake herring (Coregonus artedi) recruitment success by protecting individuals from lake trout (Salvelinus namaycush) that preferred less turbid water. In the same way, higher turbidity in the Maumee River plume could be a major factor protecting larval fish from visual predators in the western basin of Lake Erie [7,8,28].
Another possible explanation for the apparently higher recruitment of the Maumee River plume larvae to the age-0 juvenile stage may be strong currents from the Detroit River [55] that could flush larvae and/or early juveniles from the western basin into the central basin, an area that we did not sample. Such a phenomenon would generate a downward bias in our esti-mates of recruitment in the Detroit River plume larvae. The effect would be magnified by Mau-mee River plume larvae being less susceptible to such transport, as currents generated by the Maumee River are much weaker than the Detroit River [55,56]. However, the juvenile YP that belonged to the Detroit River plume larval group were found to be dispersed throughout the western basin, suggesting that Detroit River plume larvae were not being systematically dis-placed east towards the central basin. On average 17% of our larval YP were excluded from the self-assignment analysis in the Detroit and Maumee River plume larval groups. While the pos-sibility exists that these larvae originated from some other (un-sampled) source population(s), these unassigned larvae also may have been transported by water currents away from their natal plume area into the adjacent nursery plume area before capture in our nets. Even though otolith microchemical evidence suggests that most larvae remained in the Detroit River plume or Maumee River plume for several weeks after hatching [12], some larvae (perhaps the weak-est swimmers) may have been transported away from their natal areas before collection by us. We found significant, albeit weak, spatial genetic structure among larval YP in the western basin of Lake Erie during our study years, with genetic differentiation corresponding to geo-graphically separated larval rearing habitats (i.e., the Maumee vs. Detroit River plumes). While within-lake genetic structure has been previously reported for Lake Erie YP [30,31,57], these studies used juveniles and adults in their analyses, not larvae. Thus, our study is the first Great Lakes study to document that genetic structure exists during the larval stage for YP, a phenom-enon that has been widely documented in other sympatric populations in marine ecosystems (e.g., [58–60]). Interestingly, Lecomte and Dodson [58] also revealed levels of genetic differen-tiation similar to our own (larval FST= 0.001–0.044)) between two groups of larval rainbow
smelt (Osmerus mordax) in the St. Lawrence estuary (Canada). And, like us, Lecomte and Dod-son [58] suggested that these genetic differences arose because the two sympatric groups of lar-vae were exploiting habitats that varied in terms of turbidity.
Additionally, we found that the level of genetic divergence between the Maumee and Detroit River plumes was greater for juveniles (juvenile FSTrange = 0.0143 to 0.0244) than it was for
larvae in all years, with this increase in FSTfrom larvae to YOY being insensitive to our choice
of assignment threshold. The underlying mechanism for this increase in FSTvalues between life
stages is unknown; however, selection or severe bottleneck (e.g., sampling difference among life stages, as surviving adults are a fraction of the potential larvae) are two obvious possibilities. In-terestingly, the juveniles exhibited reduced HWE departures (relative to the larvae) and one microsatellite locus (YP81) exhibited anomalously high divergence. This latter finding is con-sistent with possible linkage disequilibrium resulting from a selection differential between the two larval habitats. These results indicate that adult or spawning population genetic analysis may not reflect larval and juvenile genetic population structure or dynamics, especially in large and complex ecosystems such as the western basin of Lake Erie.
The presence of genetic structure between populations of larval YP found near the Maumee River plume versus the Detroit River plume also may be attributed to adult YP spawning site fi-delity or homing [24,31,64] coupled with relatively weak larval swimming capabilities [42] that limits active dispersal during the first weeks post-hatching. Thus, we may be indirectly observing genetic structure among spawning adult YP. The observed year-to-year variation in the genetic structure of larvae may further reflect variation in environmental conditions at the spawning grounds and rearing sites [65], changes in cryptic barriers such as water currents [66], or differ-ential survival or reproductive success among spawning populations [65–68]. Even though the level of larval genetic structure reported in this study is low, it indicates that genetic structure can be detected very early in life and that different life stages of fish should be included in genetic studies to better understand the relationship between habitat use and dispersal.
Otolith microchemistry is another technique that has been used to assign fish to their larval rearing habitats [69–71]. Reichert et al. [12] identified water-mass specific elemental signatures in the Maumee and Detroit River plume habitats, and these elemental signatures were used to assign juvenile YP back to their larval rearing area (i.e. Detroit or Maumee River plumes), thus enabling these authors to estimate recruitment success differences between larvae from both rearing areas for 2006 and 2007. Our genetic assignment approach agreed with the results pre-sented in Reichertet al. [12] in that the Maumee River plume rearing site had a higher recruit-ment in 2006 and 2007, compared to the Detroit River plume larvae. While a quantitative comparison of our findings with Reichertet al.’s (2010) is beyond the scope of this study, both methods appear to be potentially valuable for discriminating stocks and identifying natal ori-gins of recruited individuals.
In conclusion, we found evidence to indicate that survival of larval yellow perch through their first summer was higher for individuals residing inside a nutrient-rich, turbid river plume (i.e., the Maumee River plume) than those residing outside of it (i.e., the Detroit River plume). Our ability to document this result was provided by weak but significant genetic structure between larval YP residing in the Detroit versus Maumee River plumes coupled with temporal genotype assignment (from juvenile to larval source populations). Unfortunately, the mechanisms respon-sible for the larval genetic structure and the change in genetic structure from the larval to juve-nile stages remain enigmatic, and thus require further study. Our results indicate that including early life stage population genetic analyses would provide a better picture of the complex interac-tions between nursery habitat, early life survival and genetic structure.
Acknowledgments
the collection and processing of larval fish samples; N. Hawley and S. Constance for their assis-tance in collecting and processing CTD and transmissometry data; and K. Pangle and T. Johen-gen for their assistance with limnological data collection and processing. Collections were made under the Animal Care permit number: University of Windsor AUPP# 08–01. We also thank Captain T. Joyce and crew of the R/VLaurentianand Captain M. Taetsch and crew of the R/VCyclops(National Oceanic and Atmospheric Administration-Great Lakes Environ-mental Research Laboratory), Captain C. MacDonald and crew of the R/VKeenosay(Ontario Ministry of Natural Resources; OMNR), and Captain M. Turner and E. Weimer and crew of the R/VExplorer(Ohio Department of Natural Resources-Division of Wildlife; ODNR-DOW) for providing invaluable assistance with field collections. Special thanks also go to OMNR (Wheatley, Ontario) and the ODNR-DOW (Sandusky, Ohio) for providing age-0 juveniles.
Author Contributions
Conceived and designed the experiments: LCM TBJ SAL DDH. Performed the experiments: LCM RPW SAL. Analyzed the data: LCM RPW DDH. Contributed reagents/materials/analysis tools: TBJ SAL DDH. Wrote the paper: LCM RPW TBJ SAL DDH.
References
1. Houde ED (2009) Recruitment variability.InFish reproductive biology.Edited byJakobsen T., Fogarty M.J., Megrey B.A., and Moksness E.. Wiley-Blackwell Scientific Publications, Chichester, UK. pp. 91–
171.
2. Ludsin SA, DeVanna KM, Smith REH (2014) Physical-biological coupling and the challenge of under-standing fish recruitment in large lakes. Can J Fish Aquat Sci 71:775–794.
3. Hunter M, Price PW (1992) Playing chutes and ladders: heterogeneity and the relative roles of bottom-up and top-down forces in natural communities. Ecology 73:724–732.
4. Grimes CB, Kingsford MJ (1996) How do riverine plumes of different sizes influence fish larvae: Do they enhance recruitment? Mar Freshwater Res 47: 191–208.
5. Chassot E, Mélin F, Le Pape O, Gascuel D (2007) Bottom-up control regulates fisheries production at the scale of eco-regions in European seas. Mar Ecol Prog Ser 343: 45–55.
6. McQueen DJ, Johannes MR, Post JR, Stewart TJ, Lean D (1989) Bottom-up and top-down impacts on freshwater pelagic community structure. Ecol Monogr 59: 289–309
7. Pangle KL, Malinich TD, Bunnell DB, DeVries DR, Ludsin SA (2012) Context-dependent planktivory: in-teracting effects of turbidity and predation risk on adaptive foraging. Ecosphere 3: 114. doi:10.1890/ ES12-00224.1
8. Carreon-Martinez LB, Wellband KW, Johnson TB, Ludsin SA, Heath, DD (2014) Novel molecular ap-proach demonstrates turbid river plumes reduce predation mortality on larval fish. Mol Ecol In Press.
9. Le Pape O, Chauvet F, Désaunay Y, Guérault D (2003) Relationship between interannual variations of the river plume and the extent of nursery grounds for the common sole (Solea solea, L.) in Vilaine Bay. Effects on recruitment variability. J Sea Res 50:177–185.
10. De Robertis A, Morgan CA, Schabetsberger R, Zabel RW, Brodeur RD, Emmett R L,et al. (2005) Co-lumbia River plume fronts. II. Distribution, abundance and feeding ecology of juvenile salmon. Mar Ecol Prog Ser 299:33–44.
11. Litz MN, Emmett RL, Bentley PJ, Claiborne AM, Barceló C (2013) Biotic and abiotic factors influencing forage fish and pelagic nekton community in the Columbia River plume (USA) throughout the upwelling season 1999–2009. ICES J Mar Sci: Journal du Conseil, fst082.
12. Reichert JM, Fryer BJ, Pangle KL, Johnson TB, Tyson JT, Drelich AB, et al. (2010) River-plume use during the pelagic larval stage benefits recruitment of a lentic fish. Can J Fish Aquat Sci 67: 987–1004.
13. Mortimer CH (1987) Fifty years of physical investigations and related limnological studies on Lake Erie 1928–1977. J Great Lakes Res 13: 407–435.
15. John MA, MacDonald JS, Harrison PJ, Beamish RJ, Choromanski E (1992) The Fraser River plume: some preliminary observations on the distribution of juvenile salmon, herring, and their prey. Fish Ocean 1:153–162.
16. Salen-Picard C, Darnaude AM, Arlhac D, Harmelin-Vivien ML (2002) Fluctuations of macrobenthic pop-ulations: a link between climate-driven run-off and sole fishery yields in the Gulf of Lions. Oecologia 133: 380–388.
17. Thorrold SR, Jones GP, Hellberg ME, Ronald S. Burton RS, Swearer SE, et al.(2002) Quantifying larval retention and connectivity in marine populations with artificial and natural markers. Bulletin of Marine Science 70, Supplement 1: 291–308.
18. Saenz-Agudelo P, Jones GP, Thorrold SR, Planes S (2011). Connectivity dominates larval replenish-ment in a coastal reef fish metapopulation. Proceedings of the Royal Society B: Biological Sciences, rspb20102780.
19. Hogan DR, Thiessen RJ, Sale PF, Heath DD (2012) Local retention, dispersal and fluctuating connec-tivity among populations of a coral reef fish. Oecologia 168: 61–71. doi:10.1007/s00442-011-2058-1
PMID:21735201
20. O’Connell M, Wright JM (1997) Microsatellite DNA in fishes. Rev Fish Biol Fish 7: 331–363.
21. Ward RD (2000) Genetics in fisheries management. Hydrobiologia 420: 191–201
22. Slatkin M (1985) Gene flow in natural populations. Annu Rev Ecol Syst 16: 393–430
23. Slatkin M (1987) Gene flow and the geographic structure of populations. Science 15:787–792.
24. Parker AD, Stepien CA, Sepulveda-Villet OJ, Ruehl CB, Uzarski DJ (2009) The interplay of morphology habitat resource use and genetic relationships in young yellow perch. T Am Fish Soc 138: 899–914.
25. Fuller K, Shear H, Wittig J (1995) The Great Lakes: an Environmental Atlas and Resource Book. Envi-ronment Canada and US EnviEnvi-ronmental Protection Agency Chicago Illinois USA.
26. Porta D, Fitzpatrick MAJ, Haffner GD (2005) Annual variability of phytoplankton primary production in the western basin of Lake Erie (2002–2003). J Great Lakes Res 31: 63–71.
27. Goodyear CS, Edsall TA, Ormsby DMD, Moss GD, Polanski PE (1982) Atlas of the spawning and nurs-ery areas of Great Lakes fishes. Volume 9: Lake Erie US Fish and Wildlife Service Washington DC FWS/OBS-82/52.
28. Ludsin S, Pangle K, Carreon-Martinez L, Legler N, Reichert J., Heath D, et al. (2011) River discharge as a predictor of Lake Erie yellow perch recruitment. Final Completion Report, Great Lakes.
29. Yellow Perch Task Group. 2010. Report of the Lake Erie Yellow Perch Task Group [online]. 25 March 2010, GLFC, Ann Arbor, Mich. Available:http://www.glfc.org/lakecom/lec/YPTG.htm.
30. Sepulveda-Villet OJ, Ford AM, Williams J, Stepien CA (2009) Population genetic diversity and phylo-geographic divergence patterns of the yellow perch (Perca flavescens). J Great Lakes Res 35: 107–
119.
31. Sepulveda-Villet OJ, Stepien CA (2011) Fine-scale population genetic structure of the yellow perch Perca flavescensin Lake Erie. Can J Fish Aquat Sci 68: 1–19.
32. Auer NA (1982) Identification of larval fishes of the Great Lakes basin with emphasis on the Lake Michi-gan drainage. Special Publication No. 82–3. Great Lakes Fishery Commission, Ann Arbor, Michigan. doi:10.1038/gim.2015.39PMID:25834952
33. Elphinstone MS, Hinten GN, Anderson MJ, Nock CJ (2003) An inexpensive and high-throughput proce-dure to extract and purify total genomic DNA for population studies. Mol Ecol Notes 3: 317–320.
34. Li L, Wang HP, Givens C, Czesny S, Brown B (2007) Primer note: Isolation and characterization of mi-crosatellites in yellow perch (Perca flavescens). Mol Ecol Notes 7: 600–603.
35. Miller MP (1997) Tools for population genetic analysis (TFPGA) 13: a windows program for the analysis of allozymes and molecular population genetic data: computer software distributed by author.
36. Rousset F (2008) Genepop'007: a complete reimplementation of the Genepop software for Windows and Linux. Mol Ecol Res 8: 103–106. doi:10.1111/j.1471-8286.2007.01931.xPMID:21585727 37. Weir BS, Cockerham CC (1984) Estimating F-statistics for the analysis of population structure.
Evolu-tion 38: 1358–1370.
38. Excoffier L, Laval G, Schneider S (2005) Arlequin ver 30: An integrated software package for population genetics data analysis. Evol Bioinform 1: 47–50.
39. Raymond M, Rousset F (1995) An exact test for population differentiation. Evolution 49:1280–1283.
40. Guillot G, Mortier F, Estoup A (2005) Geneland: A computer package for landscape genetics. Mol Ecol Notes 5: 708–711.
42. Piry S, Alapetite A, Cornuet JM, Paetkau D, Baudouin L, Estoup A (2004) GENECLASS2: A software for genetic assignment and first-generation migrant detection. J Hered 95: 536–539. PMID:15475402 43. Houde ED (1969) Sustained swimming ability of larvae of walleye (Stizostedion vitreum vitreum) and
yellow perch (Perca flavescens). J Fish Res Board Can 26: 1647–1659.
44. Beneteau CL, Mandrak NE, Heath DD (2009) The effects of river barriers and range expansion of the population genetic structure and stability in Greenside Darter (Etheostoma blennioides) populations. Conserv Genet 10: 477–487.
45. Rannala B, Mountain JL (1997) Detecting immigration by using multilocus genotypes. Proc Natl Acad Sci 94: 9197–9221. PMID:9256459
46. Paetkau D, Slade R, Burden M, Estoup A (2004) Direct real-time estimation of migration rate using as-signment methods: a simulation-based exploration of accuracy and power. Mol Ecol 13: 55–65. PMID:
14653788
47. Carpenter SR, Kitchell JF, Hodgson JR (1985) Cascading trophic interactions and lake productivity. BioScience 35: 634–639.
48. Abrahams MV, Kattenfeld MG (1997) The role of turbidity as a constraint on predator—prey interactions in aquatic environments. Behav Ecol Sociobiol 40: 169–174.
49. De Robertis A, Ryer CH, Veloza A, Brodeur RD (2003) Differential effects of turbidity on prey consump-tion of piscivorous and planktivorous fish. Can J Fish Aquat Sci 60: 1517–1526.
50. Gascon D, Legget WC (1977) Distribution abundance and resource utilization of littoral zone fishes in response to a nutrient-production gradient in Lake Memphremagog. J Fish Res Board Can 34: 1105–
1117.
51. Roseman EF, Taylor WW, Hayes DB, Tyson JT, Haas RC (2005) Spatial patterns emphasize the im-portance of coastal zones as nursery areas for larval walleye in western Lake Erie. J Great Lakes Res 31: 28–44.
52. Utne-Palm AC (2002) Visual feeding of fish in a turbid environment: Physical and behavioural aspects. Mar Freshw Behav Phy 35: 111–128.
53. Pekcan-Hekim Z, Lappalainen J (2006) Effects of clay turbidity and density of pikeperch (Sander lucio-perca) larvae on predation by perch (Perca fluviatilis). Naturwissenschaften 93: 356–359. PMID:
16604334
54. Swenson WA (1978) Influence of turbidity on fish abundance in western Lake Superior. US EPA Tech-nical Report EPA-600/3-78-067.
55. Saylor JH, Miller GS (1987) Studies of large-scale currents in Lake Erie 1979–80. J Great Lakes Res 13: 487–514.
56. Beletsky D Saylor JH and Schwab DJ (1999) Mean Circulation in the Great Lakes. J Great Lakes Res 25: 78–93.
57. Kocovsky PM, Sullivan TJ, Knight CT, Stepien CA (2013) Genetic and morphometric differences dem-onstrate fine-scale population substructure of the yellow perchPerca flavescens: need for redefined management units. J Fish Biol 82: 2015–2030. doi:10.1111/jfb.12129PMID:23731149
58. Lecomte F, Dodson JJ (2004) Role of early life-history constraints and resource polymorphism in the segregation of sympatric populations of an estuarine fish. Evol Ecol Res 6: 631–658.
59. Christie MR, Darren WJ, Christopher DS, Hixon MA (2010) Self-recruitment and sweepstakes repro-duction amid extensive gene flow in a coral-reef fish. Mol Ecol 19: 1042–1057. doi: 10.1111/j.1365-294X.2010.04524.xPMID:20089121
60. Hedgecock D (2010) Determining parentage and relatedness from genetic markers sheds light on pat-terns of marine larval dispersal. Mol Ecol 19: 845–847. doi:10.1111/j.1365-294X.2010.04525.xPMID:
20456220
61. Miller LM (2003) Microsatellite DNA loci reveal genetic structure of yellow perch in Lake Michigan. T Am Fish Soc 132: 503–513.
62. Bodaly RA, Ward RD, Mills CA (1989) A genetic stock study of perchPerca fluviatilisL in Windermere. J Fish Biol 34: 965–967.
63. Bergek S, Bjorklund M (2007) Cryptic barriers to dispersal within a lake allow genetic differentiation of Eurasian perch. Evolution 61: 2035–2041. PMID:17683444
64. Strange RM, Stepien CA (2007) Genetic divergence and connectivity among river and reef spawning groups of walleye (Sander vitreus vitreus) in Lake Erie. Can J Fish Aquat Sci 64: 437–448.
65. Hauser L, Carvalho GR, Pitcher TJ (1998) Genetic population structure in the Lake Tanganyika sardine Limnothrissa miodon. J Fish Biol 53: 413–429.
67. Sinclair M (1988) Marine populations: an essay on population regulation and speciation. Seattle: Uni-versity of Washington Press. 252 p.
68. Shrimpton JM, Heath DD (2003) Census vs effective population size in chinook salmon: large- and small-scale environmental perturbation effects. Mol Ecol 12: 2571–2583 PMID:12969462
69. Campana SE (1999) Chemistry and composition of fish otoliths: pathways mechanisms and applica-tions. Mar Ecol Prog Ser 188: 263–297.
70. Campana SE, Thorrold SR (2001) Otoliths increments and elements: keys to a comprehensive under-standing of fish populations. Can J Fish Aquat Sci 58: 30–38 doi:101139/cjfas- 58-1-30