SAKWeb
©– Spatial Autocorrelation and
Kriging Web Service
J. Negreiros & M. Painho
Portugal
first Web application to offer spatial autocorrelation and association measures, spatial exploratory tools, variography, Ordinary Kriging (OK) and Simple Kriging with global mean (SK). SAKWeb© version 2.0 exploits IE®, ASP®,
PHP® and IIS® capabilities and was designed in an attractive and straightforward
way for everyone’s use. Major features are presented in summary. As confirmed by the survey to GIS users, researchers suggest that this Web service and its enhanced developments are a promising alternative for the near future, including its use in an E-learning environment.
Keywords: geostatistics, spatial autocorrelation, kriging, web services, E-learning.
1 Introduction
Spatial analysis technology is now beginning to reach the stage where advanced users are struggling with new methods of spatial exploratory data analysis relating to possible explanations for any spatial phenomena. From an explanation of the unitary to a description of the collective, all views of space are correct if the where question is answered, what spatial correlations exist and why spatial distribution is structured in that way. Hence, this article mainly focuses on methods that address the inherent stochastic nature of patterns, interpolation and relationships based on measured point properties such as spatial autocorrelation and Kriging rather than deterministic ones such as buffering areas.
autocorrelation and Kriging as well as in Web services. This paper presents the
Instituto Superior de Estatística e Gestão de Informação – UNL,
Abstract
Many GIS users do not think in spatial terms and do not ask questions about spatial pattern and spatial autocorrelation. While conventional users prefer to use GIS modules because of the trademark that underlies the software or the direct need to topology access, experts tend to use statistical products and independent geo-software where interfaces are a non-concern issue. Also, conventional users continue to manage large volumes of spatial data with very deterministic spatial operations while experts are more concerned with stochastic issues such as fuzzier boundaries. If a high quality solution depends on geo-statistical and geographical knowledge then a W3 service with hypermedia help is an excellent way to fill this knowledge gap between both communities Negreiros and Painho [8].
With regard to the implementation of new spatial analysis tools, the future does not seem very bright on account of the undeclared divorce between the research community and the software developers. Therefore, the W3 environment emerges as an alternative solution when compared with the traditional statistical, independent and GIS modules approaches (Negreiros and Painho [8]). Johnston et al. [5]. From a technological standpoint, cooperative work, computation distribution and networking contribute to the widespread dissemination of geographical knowledge with more diverse embedding technologies. From the commercial perspective, the Internet can be viewed as an extension of the traditional competitive marketplace Laudon and Laudon [6]. From the science organization point of view, the synergy effect of the online educational material in which the overall information may be greater than the sum of its parts is a conviction. Under the GIS view, the greatest W3 impact is to close the data access gap among users with free and direct retrieval of spatial analysis tools in an E-learning context. Hence, in this paper we put together four components that will allow an enhancement and a wider use of spatial analysis, new and simpler spatial autocorrelation measures, alternatives to handle the Kriging nugget-effect implementation – everything in an universal access platform (the Internet).
Thus, this expose is organized as follows: The four sub-sections of the following section justifies SAKWeb project by highlighting major
geo-statistical innovations, E-learning issues, the poor knowledge concerning spatial autocorrelation, Kriging and simulation topics by many GIS users and the challenge to build an alternative framework to the traditional geostatistical modules (Geostatistical Analyst of ESRI®), independent software (VarioWin®,
GeoMS®, GSLib®, STAC®, Regard®, SAGE®, TRIWaco®) and statistical
packages (SAS-GIS®, SPSS-X®, Glim®, Systat® or Minitab®). The basic
requirements facing technologies are presented in section three while section four contains a brief description of SAKWeb© functionalities. Section five
analyses the user evaluation of SAKWeb©. The concluding section summarizes
2 Why develop SAKWeb
?
2.1 New features
It is significant to stress that all new features referenced here are being developed in other articles and documentation such as the inclusion of spatial autocorrelation measures as a valid exploratory spatial data analysis (ESDA) tool, the enhancements of the conventional Moran scatter plot, the inclusion of the four nugget-effect approaches and the implementation of the local error variance. Nevertheless, a brief overview of some of those will be mention next.
With regard to the weight neighbourhood matrix construction, inverse distance weighting (IDW) is indicated as a poor process because it is not sensitive to its direct neighbours Negreiros [7]. Hence, SAKWeb© presents the
covariogram contiguity for which neighbours’ boundaries are setup by the variogram range. Any other weight can be applied provided it means something to the researcher and can be justified theoretically Ebdon [3]. In accordance with various lag distances, Moran I is presented as a good search factor of the neighbour radius. Based on the range of the highest Moran I, the weight matrix is defined while the Moran location scatter plot is created (the IDW deterministic interpolation is also based on the same procedure). This mapping computing framework allows the study of spatial patterns, outliers, changeover areas and trends. Furthermore, the Moran I correlogram may lead to a re-estimation process of the variogram sill, model, nugget-effect and range Negreiros [7].
The discontinuity of the variogram origin can be viewed as a non-sense situation if spatial reality is considered a continuous surface. Among all variogram factors, the nugget-effect is also the most unpredictable because of the lack of close samples Clark and Harper [2]. So, SAKWeb© offers four strategies
to handle the nugget-effect: (A) γ(0) = 0 (model 1); (B) γ(0) = 0 but including C0
for superior lags (model 2); (C) γ(0) with micro-scale, γ1(h), and long-range,
γ2(h), assessment (model 3); (D) If measurement error is given, this attribute will
be incorporated within the Kriging system (model 4). It is assumed that the sill is a good global population variance estimate, a condition that most of the times is not true Soares [12]. Just as the arithmetic sample mean is a poor global mean estimate, preferential sampling with proportional effect leads to a false variability value. It is crucial to readjust the variogram sill to reflect the true global variance. Using the nearest neighborhood analysis for the samples weights, it is possible to find the relationship between the Estimated Global Variance (EGV) and the original variogram sill. It also avoids the difficulties of weighting samples at the edge. If this ratio multiplies the variogram model, a rescaling operation, then the Kriging classical variance and region confidence interval, both local and global, can be enhanced.
2.2 E-learning
Recently, a lot of interest has been put on E-learning methods. Quite often, common users request spatial analysis knowledge in a self-learning view because
of global cost reduction, both time and money. In addition, implementing the technological structure that supports E-learning platform is a scalable solution (Painho et al. [9]). Spatial analysis wizards, multimedia tools (including animation and hyperlinks), on-line help, software courses, videos, E-Learning and M-Learning with WML technology are ingredients of this demand. CRM of the Universidade Autónoma de Lisboa and GIS&Sc Master of ISEGI, certified by UNIGIS, are some examples of the Learning Space strategy (Semana Informática [11]). The International Center for Distance Learning (http://www-icdl.open.ac.uk), the AT&T Learning Network Virtual Academy (http://www.att.com/learningnetwork/virtualacademy), La Escuela de Negocios a Distancia de la Universidade Politecnica de Madrid (http://www.cepade.es), Le Centre National d’Enseignement à Distance (http://www.cned.fr) and the Universidade Aberta (http://www.univ-ab.pt) are others. As confirmed by Santos [10], five million US students were taking distance degrees in 1994 and two million in the EC in 1997.
In Europe, this learning trend has been successfully tapped into by EC programs such as Delta (1988-1990), Telematics Applications (1994-1998) and Multimedia Task-Force (1999). Strong future development is therefore expected, supported by current brain-ware know-how, and confirmed by the following examples: (A) The UNAVE project from the Universidade de Aveiro (http://www.unave.pt/fd) reveals greatly encouraging results with its multimedia Web interfaces program: 70% of the 350 students passed, 20% were advised to repeat and 10% failed. (B) With PROF2000 LAN/WAN management classes, the final grades of nineteen high-school professors ranged between 77% and 90% (Santos [10]). (C) During 1999, the estimate for Portugal Telecom’s cost savings with e-Learning (http://formare.ptinovacao.pt) reached €270,000 for ISDN, LAN/WAN and telecommunications courses. (D) Santos [10] presents a p-Fisher statistical study comparing conventional (276 participants) and distance learning (42) methodologies on the basis of age (26-35, 36-45 and 46-55) and school qualifications (grades 6, 7-9, 10-11 and 12), revealing a positive homogeneity of both approaches with a 95% confidence level. This conclusion was based on two representative populations of the same number, 30. A positive Pearson correlation was also found between final grades and school qualifications (+0.313) and a negative one with age (-0.413).
2.3 Modest expertise in sophisticated spatial analysis
Many GIS users do not possess the skills necessary to make use of sophisticated tools such as Kriging, spatial autoregressive models, autocorrelation measures and simulation uncertainty, thus creating a limitation to the understanding of further explanations to their problem. In a survey conducted to Portuguese users, ninety-two people were surveyed at six academic and research GIS institutions reveals a poor situation regarding the knowledge of spatial autocorrelation software: Statistical software – 5%; GIS software – 1%; Geo-software – 7%; No knowledge – 89% (Negreiros et al. [8]).
The First Law of Geography is only known by 5% of all respondents, with 20% possessing theoretical knowledge of some kind of spatial autocorrelation
and clustering measures: Variogram cloud (18% of the total population); Moran I (8%); Gi(d) and Geary C (5%). There are several explanations for this present
situation: (A) The present teaching subjects do not involve these recent quantitative geography matters. (B) Constant training and updating are an absolute GIS requirement. (C) The hardware requirements to run these types of packages can be high. (D) There is a lack of difficulty of access to non-cost GIS software in high-schools, colleges and universities. (E) Geostatistical foundations, for instance, are statistical complex for major users.
According to this survey, all respondents believe that the implementation of a spatial analysis Web service can be a wonderful strategy although there is no software available. To fill this present spatial analysis software vacuum is a major aim of this work. After all, E-learning and expertise lack of sophisticated spatial analysis regarding GIS problems are two different issues of the same coin. Therefore, the ambition of SAKWeb© is to develop the first spatial
autocorrelation and Ordinary Kriging approach in a Web environment for people with data observation problems that can be handled by both methodologies.
2.4 The W3 challenge
What the users appreciate and interact with is the GUI (graphical user interface), because they do not care about the technical structure, as long as the results are trustworthy, prompt and compatible with their operating system and hardware (Negreiros and Painho [8]). Users want intuitive and easy-to-use software in order to give immediate results without having to read pages of documentation. Luckily, the standard Web browser, irrespective of the background computer code adopted, fulfills this strategy quite well. It is cost free and already provided in any operating system. Ultimately, the user will work with all available software in the same way, regardless of the location of the data or its purpose: (A) In the beginning, the trend was to find the data with the browser; (B) Today, download the software and installed it; (C) In the near future, just run the programs from the Internet.
This represents a significant advance in the user interface because users will no longer have to worry about the software location and the technical knowledge necessary to connect to the data. Even today, the keyboards available on the market hold special keys for the browser such as home, search, back, mail and refresh. The standard Web browser is the future interface. This solution relies on an enhanced standard front-end acting as a protected wall against the computer code in an embeddable, extendable and reusable development. The capability to undercover technical implementation to the final user via WWW is essential. After struggling for years for digital information, spatial analysis needs to concentrate on what the information means, sharing it through the W3 and distributed architectures (Negreiros and Painho [8]). In effect, the wireless Web is developing furiously nowadays. Web-enabled wireless devices will enable millions of people to access the Internet while on the go. Therefore, the challenge of improving spatial data exploration by applying the available tools of spatial analysis and back-office technology integration with the Internet (mobile or not) is also critical.
3 SAKWeb
©technology
When common users begin to handle and understand the background concepts of spatial autocorrelation and Kriging, the difficulty of getting specialized software becomes all too clear (particularly with spatial autocorrelation and spatial autoregressive methods). It is important to forget installation procedures and operating system requirements and to embrace a direct, friendly and known GUI with mobile access. If the inferences presented in the previous section are added to this process, the final major SAKWeb© specifications are, thus, setup.
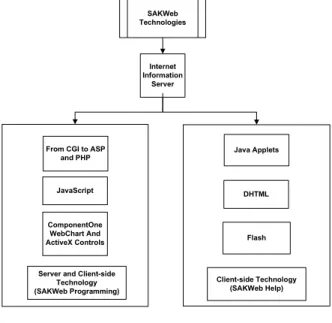
To make this project come to life, several W3 technologies were used including ASP®, PHP® and Dreamweaver® (cf. figure 1). Data Access
Components®, WebChart® from Component One®, FrontPage® Server
Extensions Service Release, Flash®, HTML, Java Applets®, VBScript® and JavaScript® are some of the other components required. On the bottom of
everything lies the client-side and server-side structure that supports this dynamic application.
This Web service is, thus, a collection of ASP® pages, server components
and a Website where the distinction among the applications is made by the root directory within the site. All content within its directory structure is considered part of the scope of the same application. Further, each application has its own set of variables and attributes that define its current state and these are maintained throughout the application lifetime. Another primary concern with Web based applications is that HTTP has no memory and retains no information from one client request to the next. ASP® gets around this issue by using
Application and Session objects to store information during a user’s session.
Internet Information
Server
DHTML JavaScript
From CGI to ASP and PHP ComponentOne WebChart And ActiveX Controls Java Applets Flash SAKWeb Technologies
Server and Client-side Technology (SAKWeb Programming)
Client-side Technology (SAKWeb Help)
The 2D and 3D WebChart® gives also power to any ASP® environment by
generating different graphic charts. Internally, the server-side component shares a common Application Program Interface (API) with the client-side that generates an .OC2 or .OC3 control to be passed to the client with the appropriate HTML tags. If the client does not have olch2x8.cab and olch3x8.cab, the server cab file generates a runtime-only copy of WebChart® on the client's machine
(these CAB files are compressed versions of Component One® Chart).
Control management of the site is achieved by means of three options: 1)
DOS Commands - The capability to browse the contents of DOS® commands; 2)
PHP Configuration - The ability to display the PHP® configuration of
SAKWeb©; 3) Session Variables – It gives the CGI parameters and the contents
of the session variables created in the current user session, a useful tool for the programmer to control the application flowchart. It also plots a horizontal 3D graphic with the distribution of the visitors to this site throughout the day by dividing it into six groups: 0h-4h, 4h-8h, 8h-12h, 12h-16h, 16h-20h and 20h-24h. This information should guide the Web users to select the best time to connect to SAKWeb©.
4 SAKWeb
main features
SAKWeb© is not a full geostatistical and simulation software package. Its
functionality is depicted on the basis of four critical procedures that implement together known spatial autocorrelation measures as well as newly developed ones:
• Data Input and Exploring View, which focuses on MS-Excel® input, control
management of the user session and exploratory data analysis. New features include the estimation of the global mean and global variance whose weights are based on the nearest neighbourhood measures.
• ESDA, Spatial Autocorrelation and Variography, which concerns variogram setup, the Moran I correlogram, the Moran location and the variance scatter plot. Recent characteristics include the Moran location and variance scatter plots.
• SAKWeb© Ordinary Kriging, which concentrates on OK calculus and
surface mapping in accordance with four nugget-effect strategies. Validation with an extra dataset, 3D-2D surface profiles, cross-validation and region plumes based on threshold values and confidence levels are also included. • SAKWeb© Help, presents ten options regarding software and geostatistical
help with the Web driven interface using hypermedia with sound and movement and an e-Learning structure that includes an IRC, Email and News service, to close the knowledge gap between experts and common GIS users.
5 SAKWeb
©end-user evaluation
In 2003, a survey was carried out to twenty GIS users. SAKWeb© was setup in
an IIS® server, for ten clients using the intranet of Rainha Dona Leonor college
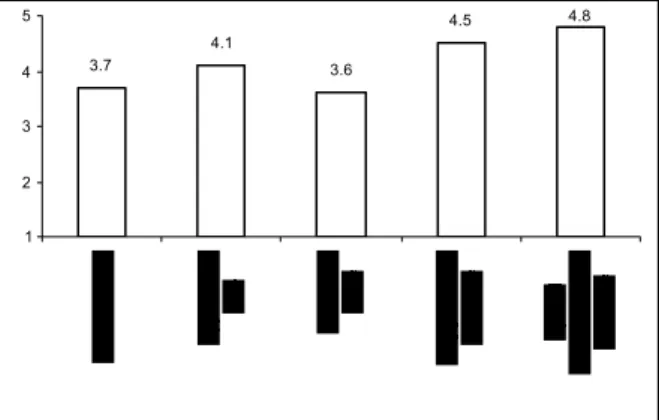
in Lisboa. The same GS+ Pb dataset was given so that they could test the SAKWeb© features (cf. Figure 2). Previously, a 45 minutes refresher overview of
spatial autocorrelation, trend surfaces, nearest neighborhood and OK subjects was presented. However, no tips were given on how to use SAKWeb©.
3.7 4.1 3.6 4.5 4.8 1 2 3 4 5
Figure 2: The average classification of the impact of SAKWeb© major features.
On the basis of the survey presented and with post-statistical processing, several interpretations can be drawn:
a. The SAKWeb© Moran variance scatter plot was too slow to be computed. In
fact, 80% of the users complained about this issue, stating that this routine leads to impaired performance, that is, the slowness of the server impacts on concurrent operations of other users. Thus, the ASP® script language that
underlies this procedure was changed to C. However, the strength of SAKWeb© in concurrent processes did not reveal any other major flaw.
b. The capability to brush and link different maps was pointed out as seriously deficient by 60% of the interviewees, a major trend in the ESRI® Geostatistical Analyst module (particularly for assessing classical statistics in a moving average context). Accordingly, two new options were setup within SAKWeb©: local interactive statistics and 3D-2D OK profile.
c. In this survey, the limited number of OK models available, especially when compared with the ESRI® Geostatistical Analyst module, is another issue to
be taken into consideration. This includes different lag spacing depending on different directions, smaller separation distances for the first lag and other variography tools such as the correlogram, the madogram, the general relative variogram and the pairwise relative variogram. Consequently, these last four features were included after this survey was carried out.
e. The questionnaire reveals that 45% of the respondents think that it is important to include the Box-Cox, Normal and logarithmic transformations in geostatistical software.
f. This questionnaire indicates that 30% of the users think that topographical and hill shade background maps enhance final Kriging maps. For this reason, image mapping in a new window was added afterwards. Curiously, no users mention the absence of the traditional semivariance/covariance cloud and the QQ-plot in SAKWeb©.
g. All answers reveal that these users support the SAKWeb© Moran location
scatter plot for verifying trends and local pockets of stationary. The bivariate scatter plot is also a good option. However, the histogram tool in conjunction with the brushing and linkage location map represents a wonderful tool for this purpose.
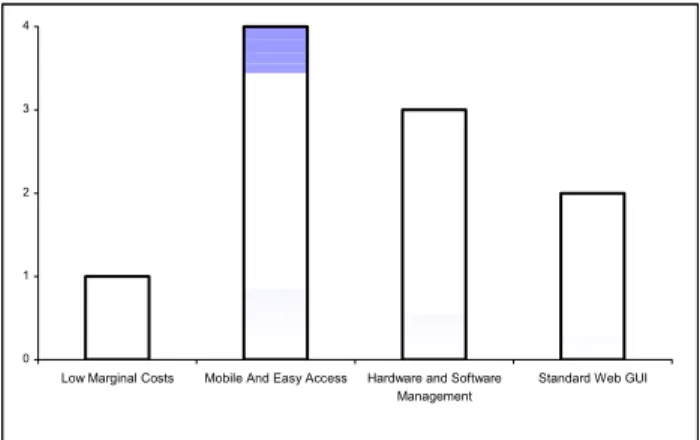
Figure 3: The final ranking for the main advantages of the Web solution. After the survey was completed, certain issues were discussed in a brief meeting. The respondents confirmed previous suggestions: they really appreciate the capability to generate several Kriging surfaces and compare them without any extra work. It is expected that future software developments will enhance this feature. Therefore, the capability to extend this on-the-fly potential based on different range, model and anisotropy factors could be a remarkable improvement since the present solution is only based on the four nugget-effect strategies. In terms of the interface, it was unanimously agreed that this Web service is extremely easy to use for two main reasons: 1) The hints given and the validation check for the input parameters; 2) The inability to proceed to the next step if the previous one is not correct (it works like a process wizard).
Two users reclaim the migration from ASP® 3.0 to ASP.Net® architecture.
However, the introduction of the Moran location scatter plot (instead of the conventional one) and the Moran variance scatter plot represents a major step in spatial autocorrelation measures. According to the questionnaire, the Moran location scatter plot was ranked first in terms of usability and visual impact for
0 1 2 3 4
Low Marginal Costs Mobile And Easy Access Hardware and Software Management
outliers, trends and patterns search. The Moran I and Geary C took second place while the variogram cloud ranked third. But, this latter measure requires the brushing and linking feature. Another interesting comment made by two users was: “Until now, the emphasis on spatial autocorrelation measures by geo-software has been limited and almost forgotten. It is hoped that SAKWeb©
restores in our minds the need to implement them with Kriging software.” Another point is that the SAKWeb© Help approach presents alternative help
software to that provided by the conventional Contents-Search-Index pattern. According to most inquiries, laying out the overall help structure with hyperlinks among subjects is really an attractive model. As some users confirmed, “it works like a puzzle where each piece corresponds to each issue, though at the same time a complete view is given of the structure topics and how they are related to each other.” Future help applications must be encouraged to follow this concept too.
6 Conclusions
There is an increased demand for systems that do more than display and data organization Ebdon [3]. The set of potential applications for spatial analysis is enormous, for example, accident patterns, victim profiles within a residential population and spread rates for pollution levels. Thus, spatial statistics must hold a specific spatial framework to apply quantitative and statistical methods for a better understanding of spatial relationships. If the finding of spatial structures is fundamental then autocorrelation, interpolation and autoregressive models are three major spatial methods that fulfill this constraint.
However, when common users begin to handle and understand the background concepts of spatial autocorrelation and Kriging, the difficulty of getting specialized software becomes all too clear. It is important to forget installation procedures and operating system requirements, to embrace a direct, friendly and known GUI with mobile access, to incorporate standard exchange for data input, to validate input parameters including suggestions and hints on-the-fly, to add new features available and to provide the capability of discussing these issues on an on-line basis with good hypermedia help.
With the advent of Web technology and modern wireless computing, it has become necessary to develop a W3 service for interpolation to understand the often complex spatial autocorrelation that exist among the samples collected in space. The E-Learning geostatistical solution and, particularly, the close linkage between spatial autocorrelation and Kriging were never considered. The inclusion of these two major components provided another inspiration for SAKWeb© version 2.0.
Although this project is still a work in progress, the future of SAKWeb© can
be bright. Already beyond the scope of this paper, the present SAKWeb©
infrastructure can be applied easily as a WWW interface with GSLib® routines to
avoid the reinvention of the wheel for other geostatistical tools, a situation required by some respondents in the survey.
The Next Kriging Menu selection has this aim by leading the user to a new choice of options that include SK, UK, IK and CK. In effect, SK with global mean has already been implemented with the following options: SK Calculation,
Default SK, SK With No C0, SK With Two Structures, Exact SK Differences, SK Versus OK, Validation With Extra Dataset and Cross-Validation (as with OK,
this selection includes the location of positive-negative/true-false samples). A third menu screen has already been sketched for simulation and spatial auto-regression procedures. Adapting Anselin [1] contemplation, the respectability of the academic research concerning implementation should be a reality, where the results are reflected in appealing pictures while the arduous work is taking place beyond-stage in a W3 environment.
References
[1] Anselin, L., Exploratory Spatial Data Analysis in a Geocomputational Environment in Geocomputation A Primer. John Wiley and Sons, New York, 1998, pp. 77-94.
[2] Clark, I., Harper, W., Practical Geostatistics Answers to the Exercises, Ecosse North America, 2000, pp. 298.
[3] Ebdon, D., Statistics In Geography, Blackwell, 1998.
[4] Goovaerts, P., Geostatistics For Natural Resources Evaluation, Oxford University Press, 1997.
[5] Johnston, K., Hoef, J., Krivoruchko, K., Lucas, N., Using ArcGIS Geostatistical Analyst, ESRI, 2001, pp. 287.
[6] Laudon, K, Laudon, J, Management Information Systems. Prentice-hall International, 2002, pp. 523.
[7] Negreiros, J., SAKWeb - Spatial Autocorrelation and Kriging Web, a W3 Computing Perspective, Unpublished Ph.D. Thesis, ISEGI-UNL, 2004, pp. 449.
[8] Negreiros, J., Painho, M., The Web Platform for Spatial Statistical Analysis, Proceedings of the 6th Conference of the Portuguese Association
in Information Systems (CAPSI), Bragança, Portugal (26-28 Nov 05). [9] Painho, M., Cabral, P., Peixoto, M., Pires, P., E-teaching and GIS:
ISEGI-UNL learning experience, Third European GIS Education Seminar EUGISES, 2002.
[10] Santos, A., Ensino à Distancia e Tecnologias de Informação: E-Learning, FCA, 2000.
[11] Semana Informática,
http://www.lotus.com/home.nsf/welcome/learnspace, 2002.
[12] Soares, A., Geoestatistica para as Ciências da Terra e do Ambiente, IST Press, 2000, pp. 206.